
よむ、つかう、まなぶ。
第24回過労死等防止対策推進協議会 全体版資料 (98 ページ)
出典
| 公開元URL | https://www.mhlw.go.jp/stf/newpage_33331.html |
| 出典情報 | 過労死等防止対策推進協議会(第24回 5/30)《厚生労働省》 |
ページ画像
ダウンロードした画像を利用する際は「出典情報」を明記してください。
低解像度画像をダウンロード
プレーンテキスト
資料テキストはコンピュータによる自動処理で生成されており、完全に資料と一致しない場合があります。
テキストをコピーしてご利用いただく際は資料と付け合わせてご確認ください。
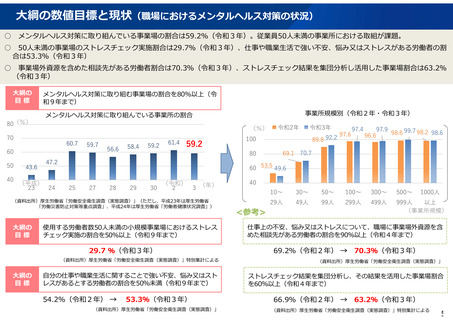
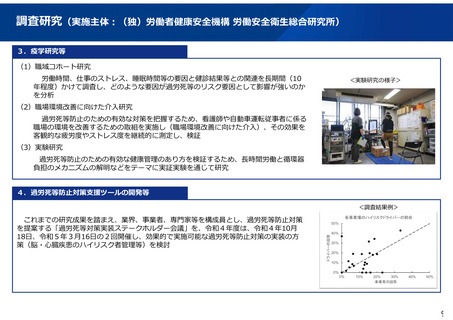
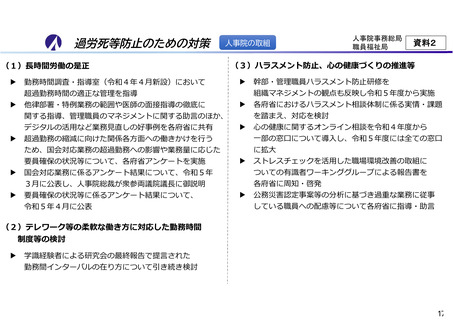
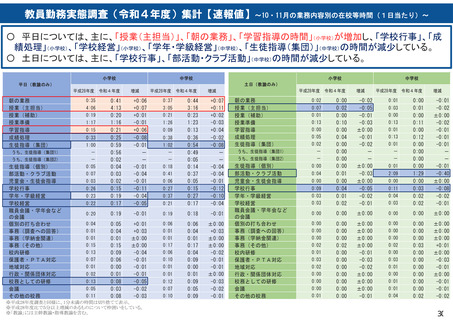
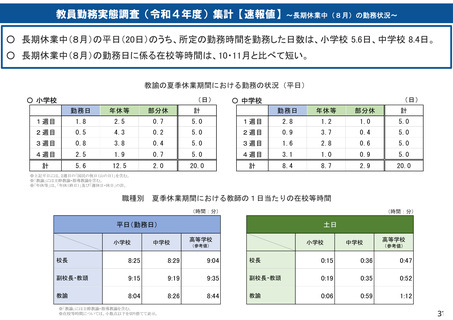
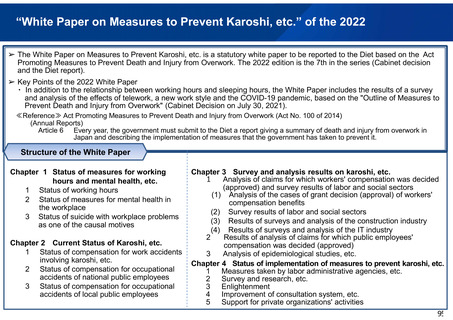
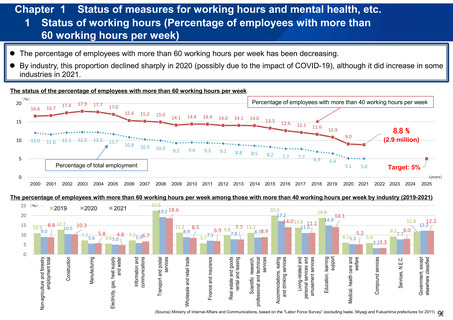
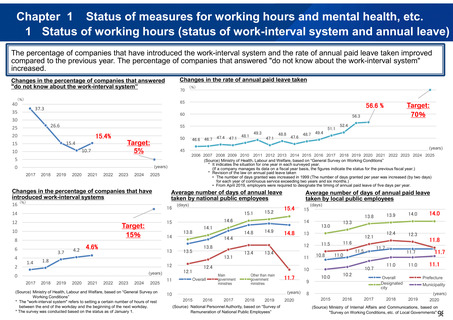
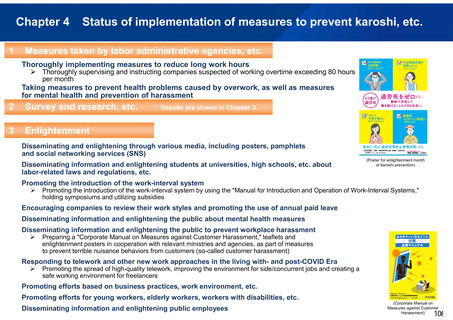
Chapter 1 Status of measures for working hours and mental health, etc.
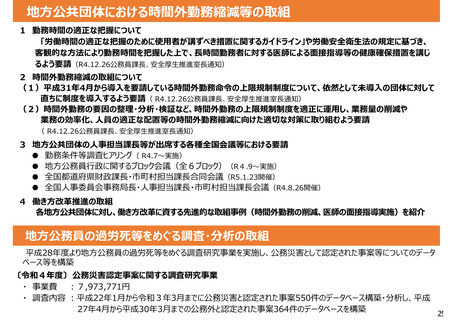
1 Status of working hours (status of work-interval system and annual leave)
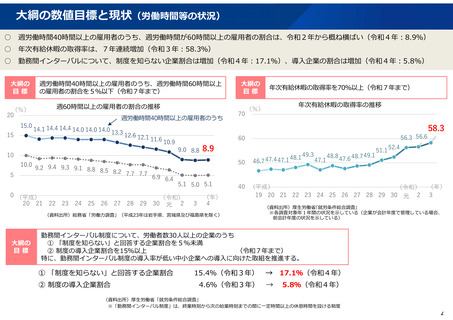
The percentage of companies that have introduced the work-interval system and the rate of annual paid leave taken improved
compared to the previous year. The percentage of companies that answered "do not know about the work-interval system"
increased.
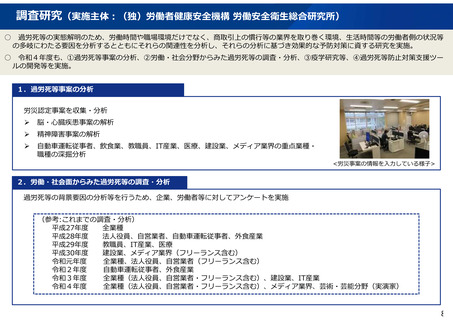
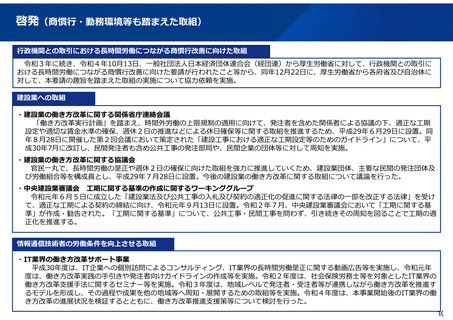
Changes in the rate of annual paid leave taken
Changes in the percentage of companies that answered
"do not know about the work-interval system”
70
(%)
65
40
60
30
26.6
25
15.4%
15.4
15
10.7
10
50
Target:
5%
0
31
2019
2
2020
3
2021
4
2022
5
2023
6
2024
7
2025
Changes in the percentage of companies that have
introduced work-interval systems
(%)
(days)
(日)
8
6
3.7
1.4
4.2
14
4.6%
13
1.8
30
2018
13.5
12.1
31
2019
2
2020
3
2021
4
2022
5
2023
6
2024
7
2025
(Source) Ministry of Health, Labour and Welfare, based on “General Survey on
Working Conditions”
* The "work-interval system" refers to setting a certain number of hours of rest
between the end of the workday and the beginning of the next workday.
* The survey was conducted based on the status as of January 1.
11
15.2
52.4
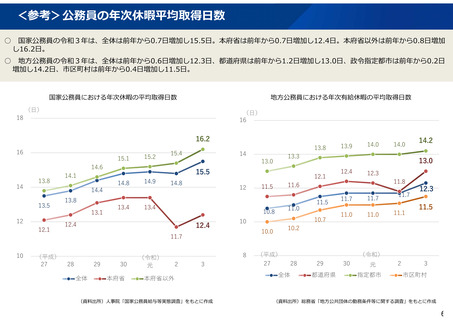
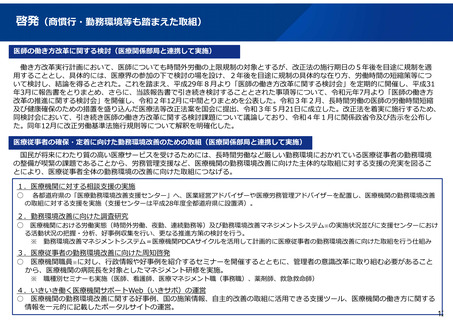
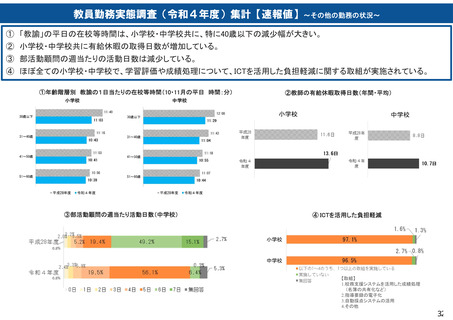
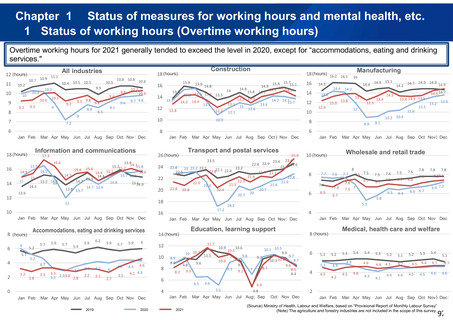
Average number of days of annual paid leave
taken by local public employees
15.4
14.8
14.9
14.8
13.4
13.4
11
12.4
Main
government
本府省
ministries
Other than main
government
本府省以外
ministries
10
2016
28
13.8
13.0
11.5
10.8
11.7
2017
29
2018
30
2019
元
(Source) National Personnel Authority, based on “Survey of
Remuneration of National Public Employees”
2020
2
9
11.6
11.0
14.0
12.4
12.3
11.7
11.5
10.7
10.0
13.9
10.2
11.7
11.0
11.0
全体
Overall
Designated
指定都市
city
2016
28
2017
29
2018
30
11.8
11.7
11.1
都道府県
Prefecture
Municipality
市区町村
8
2015
27
14.0
13.3
12.1
10
(years)
(年)
2015
27
(days)
(日)
13
12
13.8
Overall
全体
15
14
14.4
12
(年)
(years)
29
2017
13.8
14.1
13.1
0
47.6
14.6
15
Target:
15%
10
48.8
51.1
(years)
(年)
15.1
12
2
47.1
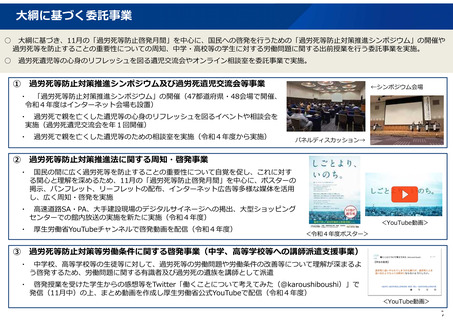
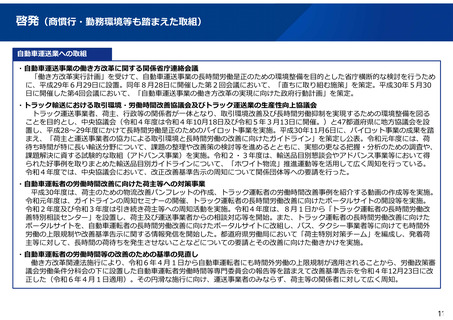
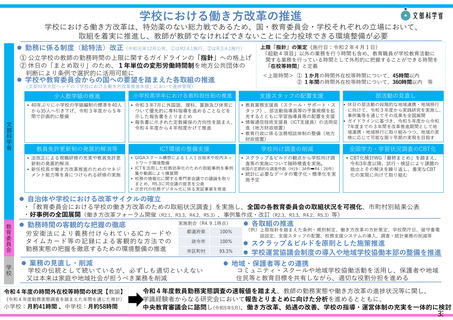
Average number of days of annual leave
taken by national public employees
16
14
4
48.1
46.6 46.7 47.4 47.1
48.7 49.4
2006
18 2007
19 2008
20 2009
21 2010
22 2011
23 2012
24 2013
25 2014
26 2015
27 2016
28 2017
29 2018
30 2019
31 2020
2 2021
3 2022
4 2023
5 2024
6 2025
7
(Source) Ministry of Health, Labour and Welfare, based on “General Survey on Working Conditions”
* It indicates the situation for one year in each surveyed year.
(If a company manages its data on a fiscal year basis, the figures indicate the status for the previous fiscal year.)
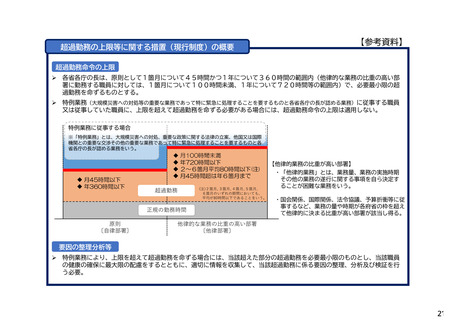
* Revision of the law on annual paid leave taken
• The number of days granted was increased in 1999 (The number of days granted per year was increased (by two days)
for each year of continuous service exceeding two years and six months.)
• From April 2019, employers were required to designate the timing of annual paid leave of five days per year.
(years)
(年)
30
2018
49.3
45
5
29
2017
56.3
55
20
Target:
70%
56.6 %
37.3
35
16
(%)
2019
元
(years)
(年)
2
2020
(Source) Ministry of Internal Affairs and Communications, based on
"Survey on Working Conditions, etc. of Local Governments"
98
1 Status of working hours (status of work-interval system and annual leave)
The percentage of companies that have introduced the work-interval system and the rate of annual paid leave taken improved
compared to the previous year. The percentage of companies that answered "do not know about the work-interval system"
increased.
Changes in the rate of annual paid leave taken
Changes in the percentage of companies that answered
"do not know about the work-interval system”
70
(%)
65
40
60
30
26.6
25
15.4%
15.4
15
10.7
10
50
Target:
5%
0
31
2019
2
2020
3
2021
4
2022
5
2023
6
2024
7
2025
Changes in the percentage of companies that have
introduced work-interval systems
(%)
(days)
(日)
8
6
3.7
1.4
4.2
14
4.6%
13
1.8
30
2018
13.5
12.1
31
2019
2
2020
3
2021
4
2022
5
2023
6
2024
7
2025
(Source) Ministry of Health, Labour and Welfare, based on “General Survey on
Working Conditions”
* The "work-interval system" refers to setting a certain number of hours of rest
between the end of the workday and the beginning of the next workday.
* The survey was conducted based on the status as of January 1.
11
15.2
52.4
Average number of days of annual paid leave
taken by local public employees
15.4
14.8
14.9
14.8
13.4
13.4
11
12.4
Main
government
本府省
ministries
Other than main
government
本府省以外
ministries
10
2016
28
13.8
13.0
11.5
10.8
11.7
2017
29
2018
30
2019
元
(Source) National Personnel Authority, based on “Survey of
Remuneration of National Public Employees”
2020
2
9
11.6
11.0
14.0
12.4
12.3
11.7
11.5
10.7
10.0
13.9
10.2
11.7
11.0
11.0
全体
Overall
Designated
指定都市
city
2016
28
2017
29
2018
30
11.8
11.7
11.1
都道府県
Prefecture
Municipality
市区町村
8
2015
27
14.0
13.3
12.1
10
(years)
(年)
2015
27
(days)
(日)
13
12
13.8
Overall
全体
15
14
14.4
12
(年)
(years)
29
2017
13.8
14.1
13.1
0
47.6
14.6
15
Target:
15%
10
48.8
51.1
(years)
(年)
15.1
12
2
47.1
Average number of days of annual leave
taken by national public employees
16
14
4
48.1
46.6 46.7 47.4 47.1
48.7 49.4
2006
18 2007
19 2008
20 2009
21 2010
22 2011
23 2012
24 2013
25 2014
26 2015
27 2016
28 2017
29 2018
30 2019
31 2020
2 2021
3 2022
4 2023
5 2024
6 2025
7
(Source) Ministry of Health, Labour and Welfare, based on “General Survey on Working Conditions”
* It indicates the situation for one year in each surveyed year.
(If a company manages its data on a fiscal year basis, the figures indicate the status for the previous fiscal year.)
* Revision of the law on annual paid leave taken
• The number of days granted was increased in 1999 (The number of days granted per year was increased (by two days)
for each year of continuous service exceeding two years and six months.)
• From April 2019, employers were required to designate the timing of annual paid leave of five days per year.
(years)
(年)
30
2018
49.3
45
5
29
2017
56.3
55
20
Target:
70%
56.6 %
37.3
35
16
(%)
2019
元
(years)
(年)
2
2020
(Source) Ministry of Internal Affairs and Communications, based on
"Survey on Working Conditions, etc. of Local Governments"
98