
よむ、つかう、まなぶ。
【参考資料3】【英版R4.1.17】Nippon AMR One Health Report (NAOR) 2020 (72 ページ)
出典
| 公開元URL | https://www.mhlw.go.jp/stf/newpage_23261.html |
| 出典情報 | 国際的に脅威となる感染症対策関係閣僚会議 薬剤耐性ワンヘルス動向調査検討会(第9回 1/17)《厚生労働省》 |
ページ画像
ダウンロードした画像を利用する際は「出典情報」を明記してください。
低解像度画像をダウンロード
プレーンテキスト
資料テキストはコンピュータによる自動処理で生成されており、完全に資料と一致しない場合があります。
テキストをコピーしてご利用いただく際は資料と付け合わせてご確認ください。
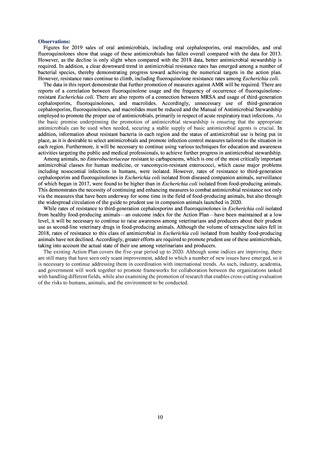
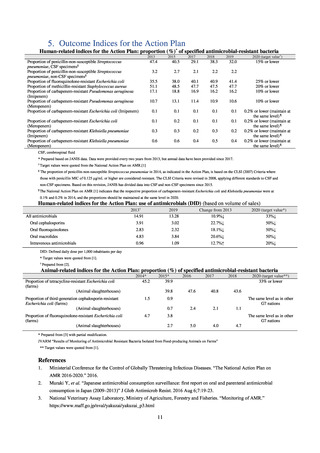
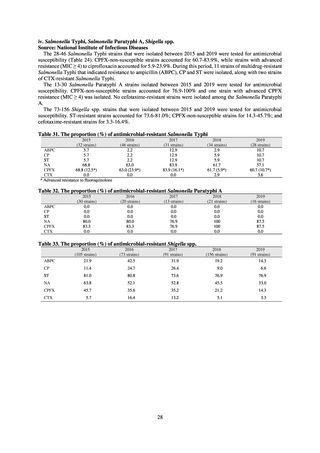
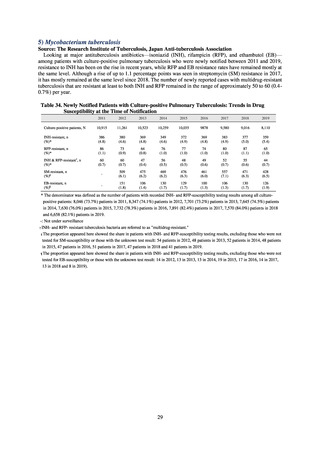
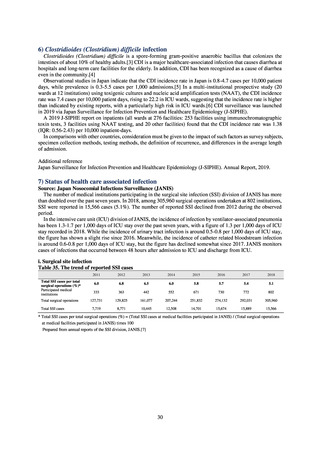
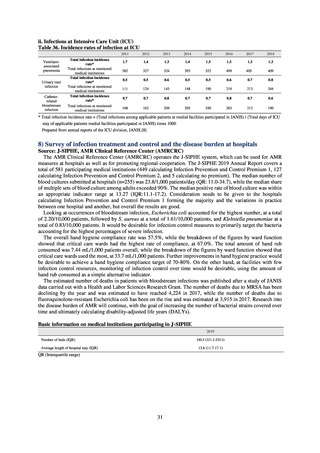
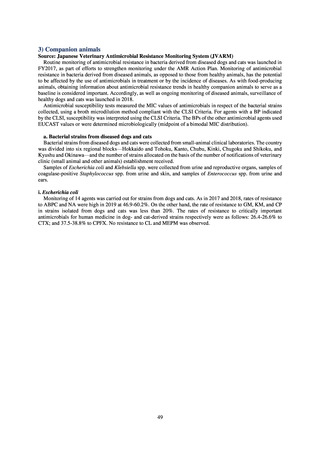
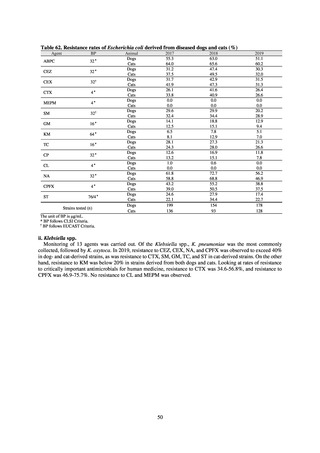
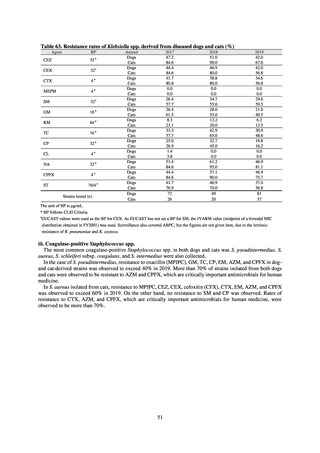
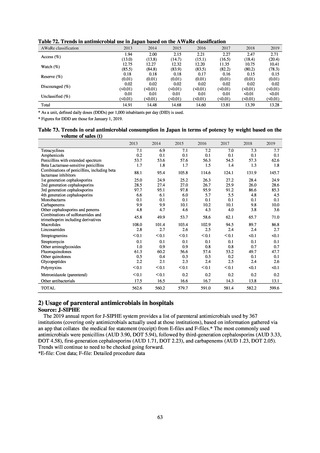
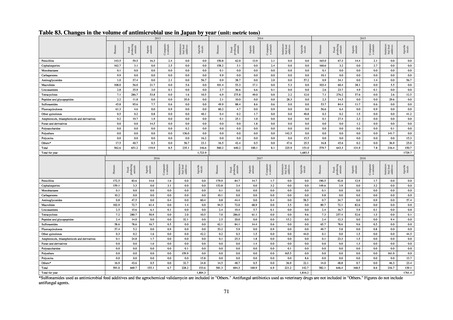
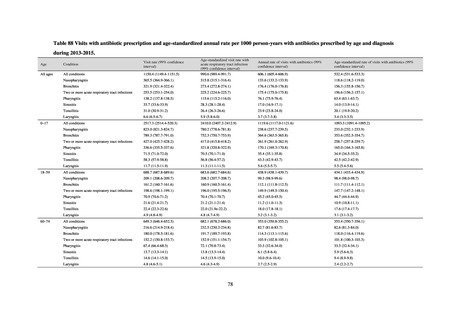
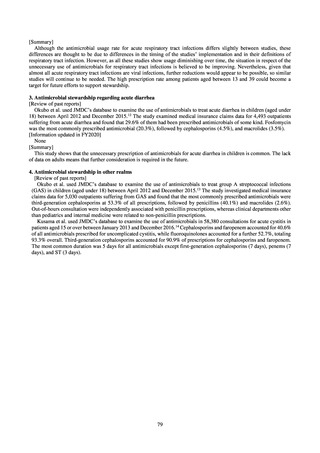
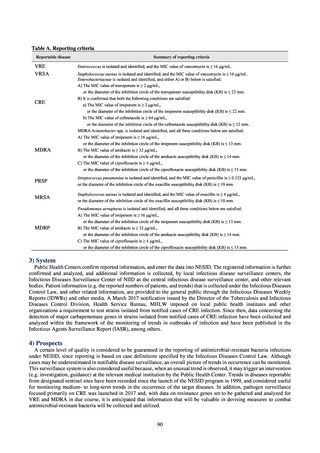
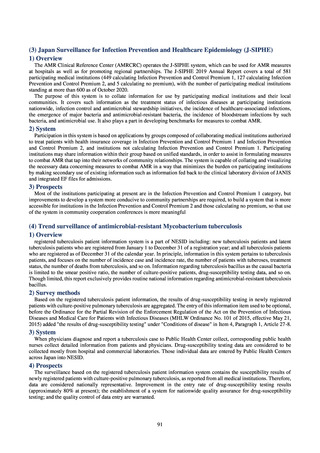
Table 83. Changes in the volume of antimicrobial use in Japan by year (unit: metric tons)
Agroche
micals
Antimicro
bial feed
additives
Companio
n animals
Aquatic
animals
Foodproducing
animals
Humans
Agroche
micals
Antimicro
bial feed
additives
2015
Companio
n animals
Aquatic
animals
Foodproducing
animals
Humans
Agroche
micals
Antimicro
bial feed
additives
2014
Companio
n animals
Aquatic
animals
Humans
Foodproducing
animals
2013
Penicillins
143.5
59.5
16.3
2.4
0.0
0.0
150.8
62.0
13.9
2.1
0.0
0.0
165.0
67.3
14.4
2.1
0.0
0.0
Cephalosporins
162.7
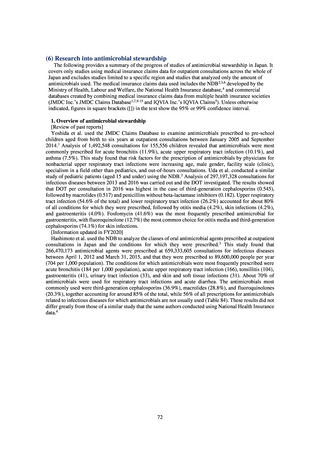
3.1
0.0
2.5
0.0
0.0
158.2
3.1
0.0
2.4
0.0
0.0
160.6
3.2
0.0
2.7
0.0
0.0
Monobactams
0.1
0.0
0.0
0.0
0.0
0.0
0.1
0.0
0.0
0.0
0.0
0.0
0.1
0.0
0.0
0.0
0.0
0.0
Carbapenems
9.9
0.0
0.0
0.0
0.0
0.0
9.9
0.0
0.0
0.0
0.0
0.0
10.1
0.0
0.0
0.0
0.0
0.0
Aminoglycosides
1.0
37.4
0.0
2.1
0.0
56.7
0.9
38.7
0.0
2.0
0.0
57.2
0.9
34.1
0.0
1.4
0.0
56.7
0.0
Macrolides
108.0
56.0
21.7
0.0
5.6
0.0
101.4
53.3
17.1
0.0
5.3
0.0
103.4
60.4
38.1
0.0
5.5
Lincosamides
2.8
35.9
3.0
0.1
0.0
0.0
2.7
36.6
6.6
0.1
0.0
0.0
2.6
23.7
4.9
0.1
0.0
0.0
Tetracyclines
7.1
286.7
53.8
0.0
1.6
10.5
6.9
275.8
49.0
0.0
2.2
12.0
7.1
276.2
57.6
0.0
2.6
12.5
Peptides and glycopeptides
2.2
11.8
0.0
0.0
35.0
0.0
2.1
10.0
0.0
0.0
28.3
0.0
2.3
14.5
0.0
0.0
29.6
0.0
Sulfonamides
45.8
95.6
7.7
0.6
0.0
0.0
49.9
88.4
8.6
0.6
0.0
0.0
53.7
84.4
11.7
0.6
0.0
0.0
Fluoroquinolones
61.3
4.6
0.0
0.9
0.0
0.0
60.2
4.7
0.0
0.9
0.0
0.0
56.6
6.4
0.0
0.9
0.0
0.0
Other quinolones
0.5
0.2
0.8
0.0
0.0
40.1
0.4
0.2
1.7
0.0
0.0
40.8
0.3
0.2
1.5
0.0
0.0
41.2
Amphenicols, thiamphenicols and derivatives
0.2
19.7
1.9
0.0
0.0
0.0
0.1
25.1
1.0
0.0
0.0
0.0
0.1
27.4
2.3
0.0
0.0
0.0
Furan and derivatives
0.0
0.0
14.5
0.0
0.0
0.0
0.0
0.0
1.8
0.0
0.0
0.0
0.0
0.0
1.2
0.0
0.0
0.0
Polysaccharides
0.0
0.0
0.0
0.0
0.2
0.0
0.0
0.0
0.0
0.0
0.0
0.0
0.0
0.0
0.0
0.0
0.1
0.0
Polyethers
0.0
0.0
0.0
0.0
136.0
0.0
0.0
0.0
0.0
0.0
142.5
0.0
0.0
0.0
0.0
0.0
141.7
0.0
Polyoxins
0.0
0.0
0.0
0.0
0.0
16.2
0.0
0.0
0.0
0.0
0.0
15.5
0.0
0.0
0.0
0.0
0.0
15.3
17.5
40.7
0.3
0.0
56.7
23.1
16.5
42.4
0.5
0.0
47.6
25.5
16.8
45.6
0.2
0.0
36.9
25.0
562.6
651.2
119.9
8.5
235.1
146.6
560.2
640.2
100.1
8.1
225.9
151.0
579.7
643.3
131.9
7.8
216.4
150.7
1,723.9
1,685.5
1729.7
Agroche
micals
Antimicro
bial feed
additives
Aquatic
animals
Humans
Foodproducing
animals
2018
Antimicro
bial feed
additives
Aquatic
animals
Foodproducing
animals
Humans
Agroche
micals
Antimicro
bial feed
additives
2017
Companio
n animals
Aquatic
animals
Humans
Foodproducing
animals
2016
Companio
n animals
Total for year
Companio
n animals
Total
Agroche
micals
Others*
Penicillins
172.5
83.6
14.6
1.6
0.0
0.0
179.9
84.7
14.7
1.7
0.0
0.0
190.5
92.8
12.9
1.7
0.0
0.0
Cephalosporins
159.1
3.3
0.0
3.1
0.0
0.0
153.8
3.4
0.0
3.2
0.0
0.0
149.6
3.9
0.0
3.2
0.0
0.0
Monobactams
0.1
0.0
0.0
0.0
0.0
0.0
0.1
0.0
0.0
0.0
0.0
0.0
0.1
0.0
0.0
0.0
0.0
0.0
Carbapenems
10.2
0.0
0.0
0.0
0.0
0.0
10.1
0.0
0.0
0.0
0.0
0.0
9.8
0.0
0.0
0.0
0.0
0.0
0.8
47.5
0.0
0.4
0.0
60.4
0.8
44.4
0.0
0.4
0.0
58.5
0.7
34.7
0.0
0.9
0.0
57.4
Aminoglycosides
Macrolides
102.9
72.7
61.4
0.0
1.4
0.0
94.5
72.0
68.9
0.0
3.5
0.0
89.7
72.1
82.6
0.0
0.0
0.0
Lincosamides
2.5
15.6
6.1
0.1
0.0
0.0
2.4
19.4
5.7
0.1
0.0
0.0
2.4
16.7
5.9
0.1
0.0
0.0
Tetracyclines
7.2
280.7
50.9
0.0
2.0
10.5
7.0
286.0
61.1
0.0
0.0
9.6
7.3
257.4
52.6
1.3
0.0
0.1
Peptides and glycopeptides
2.4
14.0
0.0
0.0
32.1
0.0
2.5
20.0
0.0
0.0
15.2
0.0
2.4
12.3
0.0
0.0
9.4
0.0
Sulfonamides
58.6
78.6
16.7
0.5
0.0
0.0
62.1
84.1
14.4
0.6
0.0
0.0
65.7
78.6
9.6
0.5
0.0
0.0
Fluoroquinolones
57.4
5.2
0.0
0.9
0.0
0.0
53.2
5.9
0.0
0.9
0.0
0.0
49.7
5.8
0.0
0.8
0.0
0.0
Other quinolones
0.3
0.2
1.6
0.0
0.0
42.2
0.2
0.3
1.5
0.0
0.0
44.0
0.1
0.0
1.5
0.0
0.0
44.5
Amphenicols, thiamphenicols and derivatives
0.1
24.8
1.7
0.0
0.0
0.0
0.1
25.3
1.8
0.0
0.0
0.0
0.1
23.3
1.5
0.0
0.0
0.0
Furan and derivatives
0.0
0.0
1.6
0.0
0.0
0.0
0.0
0.0
1.4
0.0
0.0
0.0
0.0
0.0
1.3
0.0
0.0
0.0
Polysaccharides
0.0
0.0
0.0
0.0
0.1
0.0
0.0
0.0
0.0
0.0
0.1
0.0
0.0
0.0
0.0
0.0
0.0
0.0
Polyethers
0.0
0.0
0.0
0.0
159.9
0.0
0.0
0.0
0.0
0.0
165.5
0.0
0.0
0.0
0.0
0.0
161.0
0.0
Polyoxins
0.0
0.0
0.0
0.0
0.0
15.8
0.0
0.0
0.0
0.0
0.0
8.6
0.0
0.0
0.0
0.0
0.0
13.7
Others*
Total
Total for year
16.9
43.6
0.5
0.0
32.7
24.8
14.5
48.7
0.5
0.0
36.9
22.1
14.0
48.8
0.7
0.0
46.3
23.4
591.0
669.7
155.1
6.7
228.2
153.6
581.3
694.3
169.9
6.9
221.2
142.7
582.1
646.4
168.5
8.6
216.7
139.1
1,804.3
1,816.2
*Sulfonamides used as antimicrobial feed additives and the agrochemical validamycin are included in "Others." Antifungal antibiotics used as veterinary drugs are not included in "Others." Figures do not include
antifungal agents.
71
1761.4
Agroche
micals
Antimicro
bial feed
additives
Companio
n animals
Aquatic
animals
Foodproducing
animals
Humans
Agroche
micals
Antimicro
bial feed
additives
2015
Companio
n animals
Aquatic
animals
Foodproducing
animals
Humans
Agroche
micals
Antimicro
bial feed
additives
2014
Companio
n animals
Aquatic
animals
Humans
Foodproducing
animals
2013
Penicillins
143.5
59.5
16.3
2.4
0.0
0.0
150.8
62.0
13.9
2.1
0.0
0.0
165.0
67.3
14.4
2.1
0.0
0.0
Cephalosporins
162.7
3.1
0.0
2.5
0.0
0.0
158.2
3.1
0.0
2.4
0.0
0.0
160.6
3.2
0.0
2.7
0.0
0.0
Monobactams
0.1
0.0
0.0
0.0
0.0
0.0
0.1
0.0
0.0
0.0
0.0
0.0
0.1
0.0
0.0
0.0
0.0
0.0
Carbapenems
9.9
0.0
0.0
0.0
0.0
0.0
9.9
0.0
0.0
0.0
0.0
0.0
10.1
0.0
0.0
0.0
0.0
0.0
Aminoglycosides
1.0
37.4
0.0
2.1
0.0
56.7
0.9
38.7
0.0
2.0
0.0
57.2
0.9
34.1
0.0
1.4
0.0
56.7
0.0
Macrolides
108.0
56.0
21.7
0.0
5.6
0.0
101.4
53.3
17.1
0.0
5.3
0.0
103.4
60.4
38.1
0.0
5.5
Lincosamides
2.8
35.9
3.0
0.1
0.0
0.0
2.7
36.6
6.6
0.1
0.0
0.0
2.6
23.7
4.9
0.1
0.0
0.0
Tetracyclines
7.1
286.7
53.8
0.0
1.6
10.5
6.9
275.8
49.0
0.0
2.2
12.0
7.1
276.2
57.6
0.0
2.6
12.5
Peptides and glycopeptides
2.2
11.8
0.0
0.0
35.0
0.0
2.1
10.0
0.0
0.0
28.3
0.0
2.3
14.5
0.0
0.0
29.6
0.0
Sulfonamides
45.8
95.6
7.7
0.6
0.0
0.0
49.9
88.4
8.6
0.6
0.0
0.0
53.7
84.4
11.7
0.6
0.0
0.0
Fluoroquinolones
61.3
4.6
0.0
0.9
0.0
0.0
60.2
4.7
0.0
0.9
0.0
0.0
56.6
6.4
0.0
0.9
0.0
0.0
Other quinolones
0.5
0.2
0.8
0.0
0.0
40.1
0.4
0.2
1.7
0.0
0.0
40.8
0.3
0.2
1.5
0.0
0.0
41.2
Amphenicols, thiamphenicols and derivatives
0.2
19.7
1.9
0.0
0.0
0.0
0.1
25.1
1.0
0.0
0.0
0.0
0.1
27.4
2.3
0.0
0.0
0.0
Furan and derivatives
0.0
0.0
14.5
0.0
0.0
0.0
0.0
0.0
1.8
0.0
0.0
0.0
0.0
0.0
1.2
0.0
0.0
0.0
Polysaccharides
0.0
0.0
0.0
0.0
0.2
0.0
0.0
0.0
0.0
0.0
0.0
0.0
0.0
0.0
0.0
0.0
0.1
0.0
Polyethers
0.0
0.0
0.0
0.0
136.0
0.0
0.0
0.0
0.0
0.0
142.5
0.0
0.0
0.0
0.0
0.0
141.7
0.0
Polyoxins
0.0
0.0
0.0
0.0
0.0
16.2
0.0
0.0
0.0
0.0
0.0
15.5
0.0
0.0
0.0
0.0
0.0
15.3
17.5
40.7
0.3
0.0
56.7
23.1
16.5
42.4
0.5
0.0
47.6
25.5
16.8
45.6
0.2
0.0
36.9
25.0
562.6
651.2
119.9
8.5
235.1
146.6
560.2
640.2
100.1
8.1
225.9
151.0
579.7
643.3
131.9
7.8
216.4
150.7
1,723.9
1,685.5
1729.7
Agroche
micals
Antimicro
bial feed
additives
Aquatic
animals
Humans
Foodproducing
animals
2018
Antimicro
bial feed
additives
Aquatic
animals
Foodproducing
animals
Humans
Agroche
micals
Antimicro
bial feed
additives
2017
Companio
n animals
Aquatic
animals
Humans
Foodproducing
animals
2016
Companio
n animals
Total for year
Companio
n animals
Total
Agroche
micals
Others*
Penicillins
172.5
83.6
14.6
1.6
0.0
0.0
179.9
84.7
14.7
1.7
0.0
0.0
190.5
92.8
12.9
1.7
0.0
0.0
Cephalosporins
159.1
3.3
0.0
3.1
0.0
0.0
153.8
3.4
0.0
3.2
0.0
0.0
149.6
3.9
0.0
3.2
0.0
0.0
Monobactams
0.1
0.0
0.0
0.0
0.0
0.0
0.1
0.0
0.0
0.0
0.0
0.0
0.1
0.0
0.0
0.0
0.0
0.0
Carbapenems
10.2
0.0
0.0
0.0
0.0
0.0
10.1
0.0
0.0
0.0
0.0
0.0
9.8
0.0
0.0
0.0
0.0
0.0
0.8
47.5
0.0
0.4
0.0
60.4
0.8
44.4
0.0
0.4
0.0
58.5
0.7
34.7
0.0
0.9
0.0
57.4
Aminoglycosides
Macrolides
102.9
72.7
61.4
0.0
1.4
0.0
94.5
72.0
68.9
0.0
3.5
0.0
89.7
72.1
82.6
0.0
0.0
0.0
Lincosamides
2.5
15.6
6.1
0.1
0.0
0.0
2.4
19.4
5.7
0.1
0.0
0.0
2.4
16.7
5.9
0.1
0.0
0.0
Tetracyclines
7.2
280.7
50.9
0.0
2.0
10.5
7.0
286.0
61.1
0.0
0.0
9.6
7.3
257.4
52.6
1.3
0.0
0.1
Peptides and glycopeptides
2.4
14.0
0.0
0.0
32.1
0.0
2.5
20.0
0.0
0.0
15.2
0.0
2.4
12.3
0.0
0.0
9.4
0.0
Sulfonamides
58.6
78.6
16.7
0.5
0.0
0.0
62.1
84.1
14.4
0.6
0.0
0.0
65.7
78.6
9.6
0.5
0.0
0.0
Fluoroquinolones
57.4
5.2
0.0
0.9
0.0
0.0
53.2
5.9
0.0
0.9
0.0
0.0
49.7
5.8
0.0
0.8
0.0
0.0
Other quinolones
0.3
0.2
1.6
0.0
0.0
42.2
0.2
0.3
1.5
0.0
0.0
44.0
0.1
0.0
1.5
0.0
0.0
44.5
Amphenicols, thiamphenicols and derivatives
0.1
24.8
1.7
0.0
0.0
0.0
0.1
25.3
1.8
0.0
0.0
0.0
0.1
23.3
1.5
0.0
0.0
0.0
Furan and derivatives
0.0
0.0
1.6
0.0
0.0
0.0
0.0
0.0
1.4
0.0
0.0
0.0
0.0
0.0
1.3
0.0
0.0
0.0
Polysaccharides
0.0
0.0
0.0
0.0
0.1
0.0
0.0
0.0
0.0
0.0
0.1
0.0
0.0
0.0
0.0
0.0
0.0
0.0
Polyethers
0.0
0.0
0.0
0.0
159.9
0.0
0.0
0.0
0.0
0.0
165.5
0.0
0.0
0.0
0.0
0.0
161.0
0.0
Polyoxins
0.0
0.0
0.0
0.0
0.0
15.8
0.0
0.0
0.0
0.0
0.0
8.6
0.0
0.0
0.0
0.0
0.0
13.7
Others*
Total
Total for year
16.9
43.6
0.5
0.0
32.7
24.8
14.5
48.7
0.5
0.0
36.9
22.1
14.0
48.8
0.7
0.0
46.3
23.4
591.0
669.7
155.1
6.7
228.2
153.6
581.3
694.3
169.9
6.9
221.2
142.7
582.1
646.4
168.5
8.6
216.7
139.1
1,804.3
1,816.2
*Sulfonamides used as antimicrobial feed additives and the agrochemical validamycin are included in "Others." Antifungal antibiotics used as veterinary drugs are not included in "Others." Figures do not include
antifungal agents.
71
1761.4