
よむ、つかう、まなぶ。
【参考資料3】【英版R4.1.17】Nippon AMR One Health Report (NAOR) 2020 (64 ページ)
出典
| 公開元URL | https://www.mhlw.go.jp/stf/newpage_23261.html |
| 出典情報 | 国際的に脅威となる感染症対策関係閣僚会議 薬剤耐性ワンヘルス動向調査検討会(第9回 1/17)《厚生労働省》 |
ページ画像
ダウンロードした画像を利用する際は「出典情報」を明記してください。
低解像度画像をダウンロード
プレーンテキスト
資料テキストはコンピュータによる自動処理で生成されており、完全に資料と一致しない場合があります。
テキストをコピーしてご利用いただく際は資料と付け合わせてご確認ください。
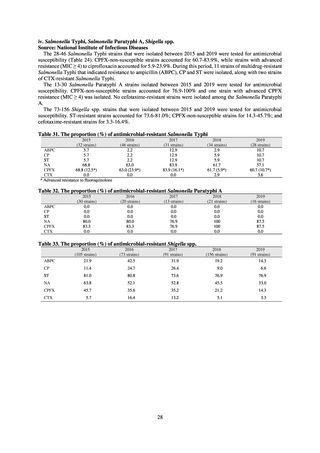
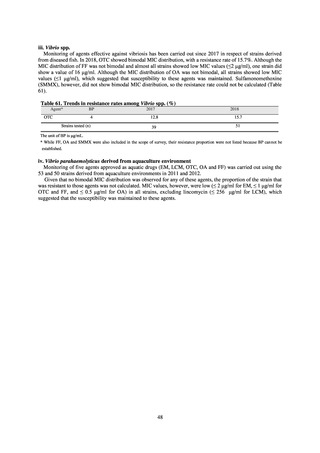
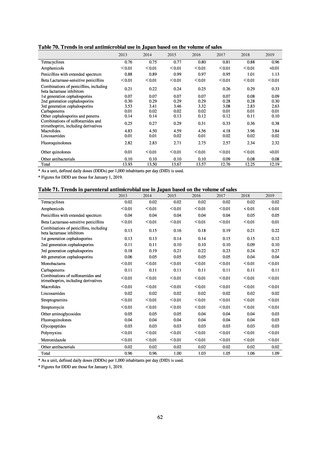
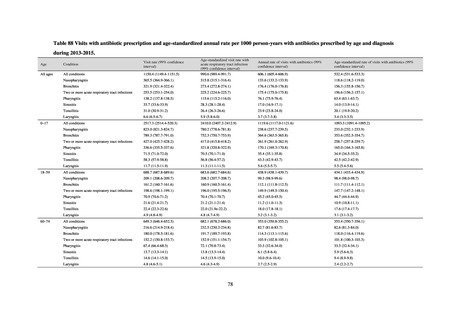
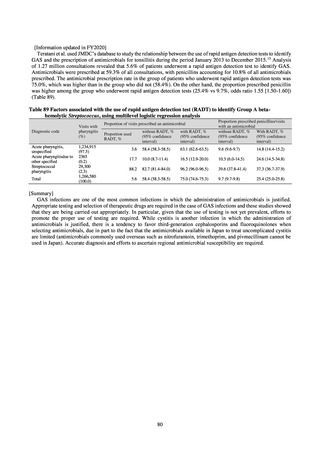
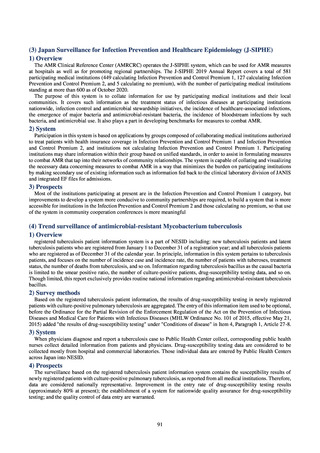
Table 72. Trends in antimicrobial use in Japan based on the AWaRe classification
AWaRe classification
Access (%)
Watch (%)
Reserve (%)
Discouraged (%)
Unclassified (%)
Total
2013
1.94
(13.0)
12.75
(85.5)
0.18
(0.01)
0.02
(<0.01)
0.01
(<0.01)
14.91
2014
2.00
(13.8)
12.27
(84.8)
0.18
(0.01)
0.02
(<0.01)
0.01
(<0.01)
14.48
2015
2.15
(14.7)
12.32
(83.9)
0.18
(0.01)
0.02
(<0.01)
0.01
(<0.01)
14.68
2016
2.21
(15.1)
12.20
(83.5)
0.17
(0.01)
0.02
(<0.01)
0.01
(<0.01)
14.60
2017
2.27
(16.5)
11.35
(82.2)
0.16
(0.01)
0.02
(<0.01)
0.01
(<0.01)
13.81
2018
2.47
(18.4)
10.75
(80.2)
0.15
(0.01)
0.02
(<0.01)
<0.01
(<0.01)
13.39
2019
2.71
(20.4)
10.41
(78.3)
0.15
(0.01)
0.02
(<0.01)
<0.01
(<0.01)
13.28
* As a unit, defined daily doses (DDDs) per 1,000 inhabitants per day (DID) is used.
* Figures for DDD are those for January 1, 2019.
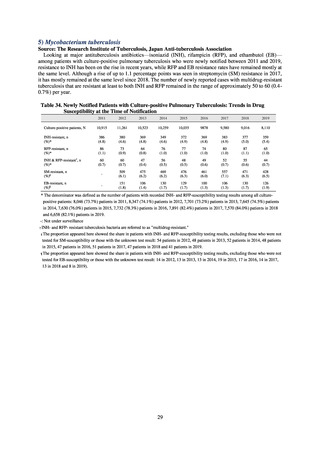
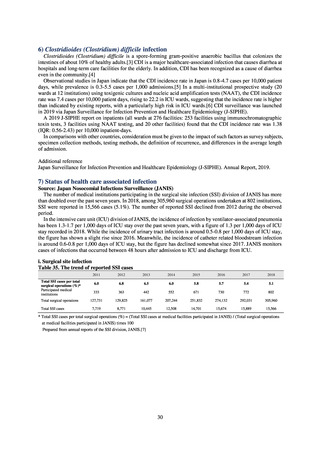
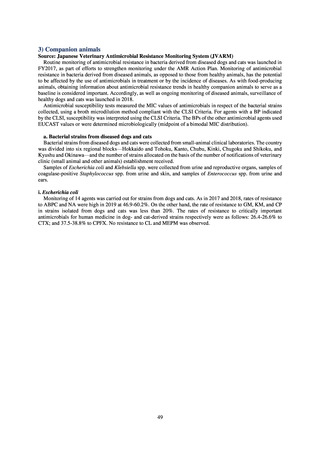
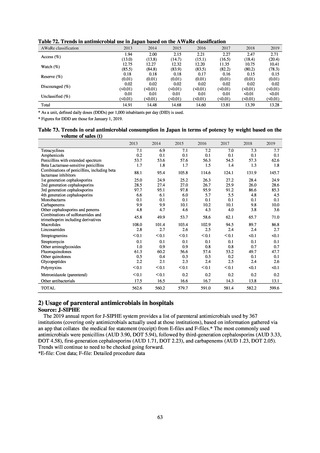
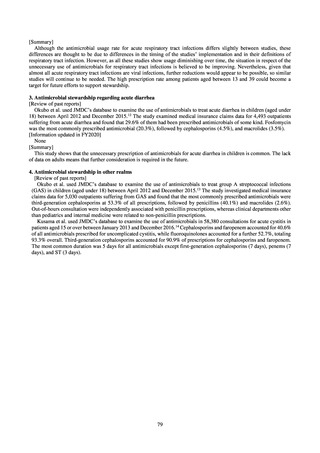
Table 73. Trends in oral antimicrobial consumption in Japan in terms of potency by weight based on the
volume of sales (t)
2013
Tetracyclines
Amphenicols
Penicillins with extended spectrum
Beta Lactamase-sensitive penicillins
Combinations of penicillins, including beta
lactamase inhibitors
1st generation cephalosporins
2nd generation cephalosporins
3rd generation cephalosporins
4th generation cephalosporins
Monobactams
Carbapenems
Other cephalosporins and penems
Combinations of sulfonamides and
trimethoprim including derivatives
Macrolides
Lincosamides
Streptogramins
Streptomycin
Other aminoglycosides
Fluoroquinolones
Other quinolones
Glycopeptides
Polymyxins
2014
2015
2016
2017
2018
2019
7.1
0.2
53.7
1.7
6.9
0.1
53.6
1.8
7.1
0.1
57.6
1.7
7.2
0.1
56.3
1.5
7.0
0.1
54.5
1.4
7.3
0.1
57.3
1.3
7.7
0.1
62.6
1.8
88.1
95.4
105.8
114.6
124.1
131.9
145.7
25.0
28.5
97.7
6.6
0.1
9.9
4.8
24.9
27.4
95.1
6.1
0.1
9.9
4.7
25.2
27.0
97.8
6.0
0.1
10.1
4.6
26.3
26.7
95.9
5.7
0.1
10.2
4.3
27.2
25.9
91.2
5.5
0.1
10.1
4.0
28.4
26.0
86.6
4.8
0.1
9.8
3.8
24.9
28.6
85.3
4.5
0.1
10.0
3.6
45.8
49.9
53.7
58.6
62.1
65.7
71.0
108.0
2.8
<0.1
0.1
1.0
61.3
0.5
2.2
<0.1
101.4
2.7
<0.1
0.1
0.9
60.2
0.4
2.1
<0.1
103.4
2.6
<0.1
0.1
0.9
56.6
0.3
2.3
<0.1
102.9
2.5
<0.1
0.1
0.8
57.4
0.3
2.4
<0.1
94.5
2.4
<0.1
0.1
0.8
53.2
0.2
2.5
<0.1
89.7
2.4
<0.1
0.1
0.7
49.7
0.1
2.4
<0.1
86.8
2.7
<0.1
0.1
0.7
47.7
0.1
2.6
<0.1
Metronidazole (parenteral)
Other antibacterials
<0.1
17.5
<0.1
16.5
0.2
16.6
0.2
16.7
0.2
14.3
0.2
13.8
0.2
13.1
TOTAL
562.6
560.2
579.7
591.0
581.4
582.2
599.6
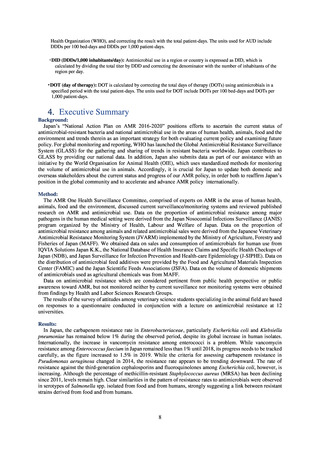
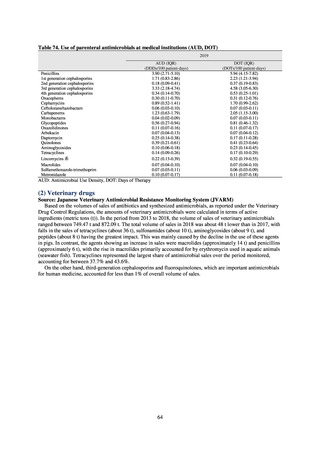
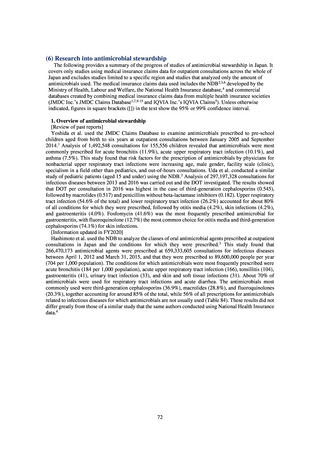
2) Usage of parenteral antimicrobials in hospitals
Source: J-SIPHE
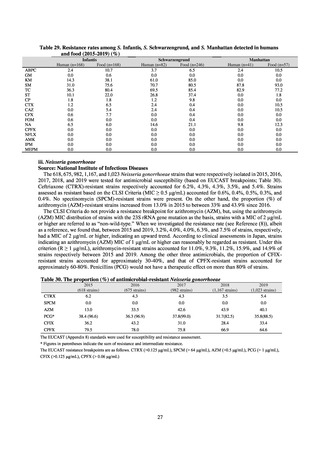
The 2019 annual report for J-SIPHE system provides a list of parenteral antimicrobials used by 367
institutions (covering only antimicrobials actually used at those institutions), based on information gathered via
an app that collates the medical fee statement (receipt) from E-files and F-files.* The most commonly used
antimicrobials were penicillins (AUD 3.90, DOT 5.94), followed by third-generation cephalosporins (AUD 3.33,
DOT 4.58), first-generation cephalosporins (AUD 1.71, DOT 2.23), and carbapenems (AUD 1.23, DOT 2.05).
Trends will continue to need to be checked going forward.
*E-file: Cost data; F-file: Detailed procedure data
63
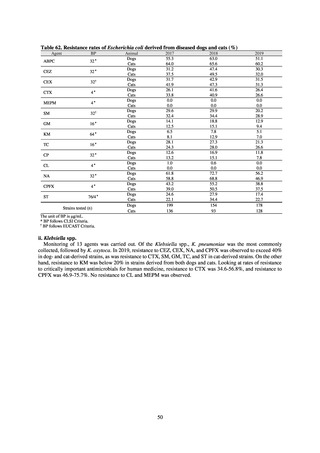
AWaRe classification
Access (%)
Watch (%)
Reserve (%)
Discouraged (%)
Unclassified (%)
Total
2013
1.94
(13.0)
12.75
(85.5)
0.18
(0.01)
0.02
(<0.01)
0.01
(<0.01)
14.91
2014
2.00
(13.8)
12.27
(84.8)
0.18
(0.01)
0.02
(<0.01)
0.01
(<0.01)
14.48
2015
2.15
(14.7)
12.32
(83.9)
0.18
(0.01)
0.02
(<0.01)
0.01
(<0.01)
14.68
2016
2.21
(15.1)
12.20
(83.5)
0.17
(0.01)
0.02
(<0.01)
0.01
(<0.01)
14.60
2017
2.27
(16.5)
11.35
(82.2)
0.16
(0.01)
0.02
(<0.01)
0.01
(<0.01)
13.81
2018
2.47
(18.4)
10.75
(80.2)
0.15
(0.01)
0.02
(<0.01)
<0.01
(<0.01)
13.39
2019
2.71
(20.4)
10.41
(78.3)
0.15
(0.01)
0.02
(<0.01)
<0.01
(<0.01)
13.28
* As a unit, defined daily doses (DDDs) per 1,000 inhabitants per day (DID) is used.
* Figures for DDD are those for January 1, 2019.
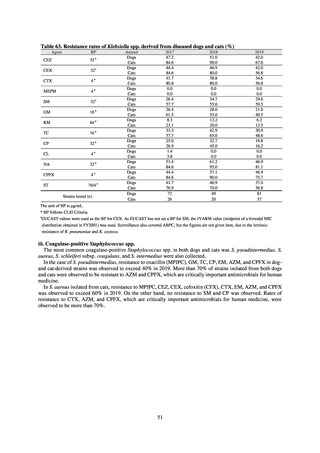
Table 73. Trends in oral antimicrobial consumption in Japan in terms of potency by weight based on the
volume of sales (t)
2013
Tetracyclines
Amphenicols
Penicillins with extended spectrum
Beta Lactamase-sensitive penicillins
Combinations of penicillins, including beta
lactamase inhibitors
1st generation cephalosporins
2nd generation cephalosporins
3rd generation cephalosporins
4th generation cephalosporins
Monobactams
Carbapenems
Other cephalosporins and penems
Combinations of sulfonamides and
trimethoprim including derivatives
Macrolides
Lincosamides
Streptogramins
Streptomycin
Other aminoglycosides
Fluoroquinolones
Other quinolones
Glycopeptides
Polymyxins
2014
2015
2016
2017
2018
2019
7.1
0.2
53.7
1.7
6.9
0.1
53.6
1.8
7.1
0.1
57.6
1.7
7.2
0.1
56.3
1.5
7.0
0.1
54.5
1.4
7.3
0.1
57.3
1.3
7.7
0.1
62.6
1.8
88.1
95.4
105.8
114.6
124.1
131.9
145.7
25.0
28.5
97.7
6.6
0.1
9.9
4.8
24.9
27.4
95.1
6.1
0.1
9.9
4.7
25.2
27.0
97.8
6.0
0.1
10.1
4.6
26.3
26.7
95.9
5.7
0.1
10.2
4.3
27.2
25.9
91.2
5.5
0.1
10.1
4.0
28.4
26.0
86.6
4.8
0.1
9.8
3.8
24.9
28.6
85.3
4.5
0.1
10.0
3.6
45.8
49.9
53.7
58.6
62.1
65.7
71.0
108.0
2.8
<0.1
0.1
1.0
61.3
0.5
2.2
<0.1
101.4
2.7
<0.1
0.1
0.9
60.2
0.4
2.1
<0.1
103.4
2.6
<0.1
0.1
0.9
56.6
0.3
2.3
<0.1
102.9
2.5
<0.1
0.1
0.8
57.4
0.3
2.4
<0.1
94.5
2.4
<0.1
0.1
0.8
53.2
0.2
2.5
<0.1
89.7
2.4
<0.1
0.1
0.7
49.7
0.1
2.4
<0.1
86.8
2.7
<0.1
0.1
0.7
47.7
0.1
2.6
<0.1
Metronidazole (parenteral)
Other antibacterials
<0.1
17.5
<0.1
16.5
0.2
16.6
0.2
16.7
0.2
14.3
0.2
13.8
0.2
13.1
TOTAL
562.6
560.2
579.7
591.0
581.4
582.2
599.6
2) Usage of parenteral antimicrobials in hospitals
Source: J-SIPHE
The 2019 annual report for J-SIPHE system provides a list of parenteral antimicrobials used by 367
institutions (covering only antimicrobials actually used at those institutions), based on information gathered via
an app that collates the medical fee statement (receipt) from E-files and F-files.* The most commonly used
antimicrobials were penicillins (AUD 3.90, DOT 5.94), followed by third-generation cephalosporins (AUD 3.33,
DOT 4.58), first-generation cephalosporins (AUD 1.71, DOT 2.23), and carbapenems (AUD 1.23, DOT 2.05).
Trends will continue to need to be checked going forward.
*E-file: Cost data; F-file: Detailed procedure data
63