
よむ、つかう、まなぶ。
【参考資料3】【英版R4.1.17】Nippon AMR One Health Report (NAOR) 2020 (10 ページ)
出典
| 公開元URL | https://www.mhlw.go.jp/stf/newpage_23261.html |
| 出典情報 | 国際的に脅威となる感染症対策関係閣僚会議 薬剤耐性ワンヘルス動向調査検討会(第9回 1/17)《厚生労働省》 |
ページ画像
ダウンロードした画像を利用する際は「出典情報」を明記してください。
低解像度画像をダウンロード
プレーンテキスト
資料テキストはコンピュータによる自動処理で生成されており、完全に資料と一致しない場合があります。
テキストをコピーしてご利用いただく際は資料と付け合わせてご確認ください。
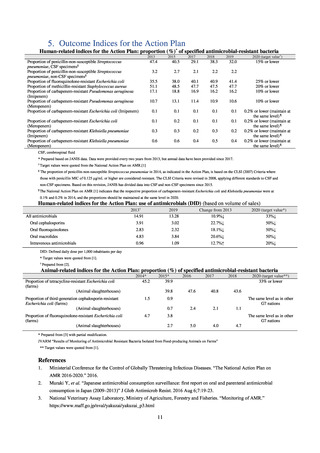
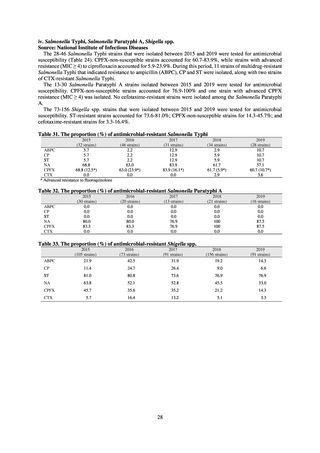
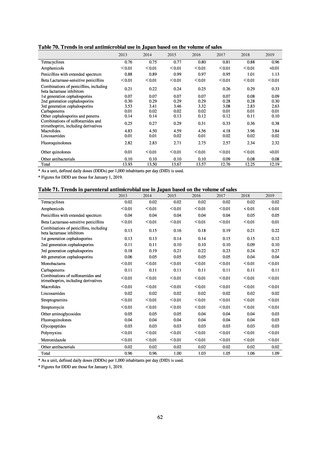
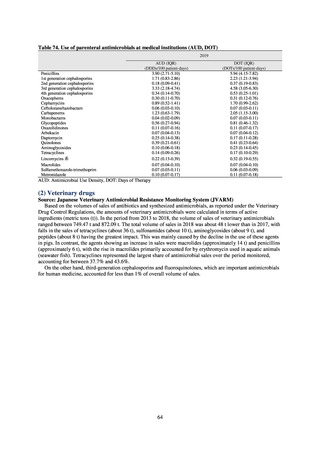
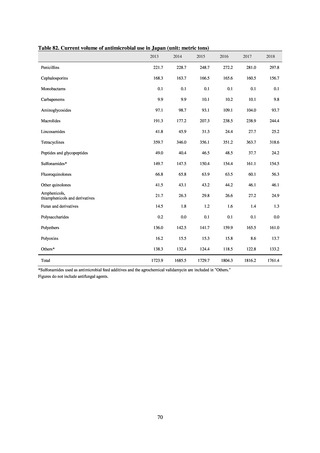
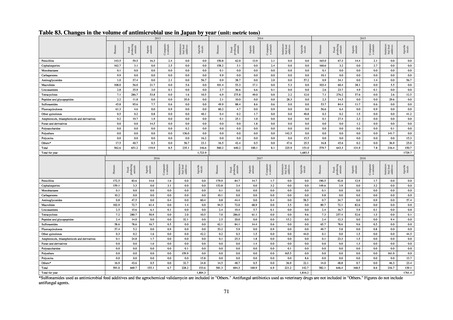
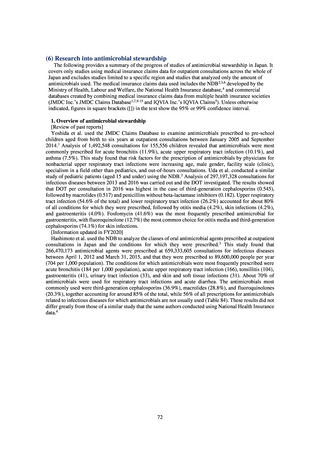
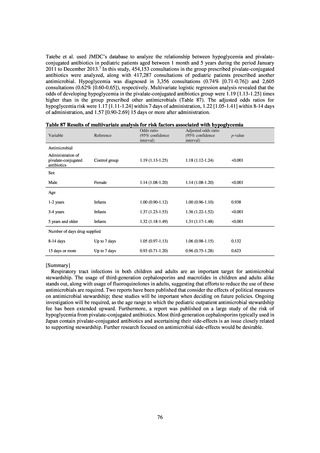
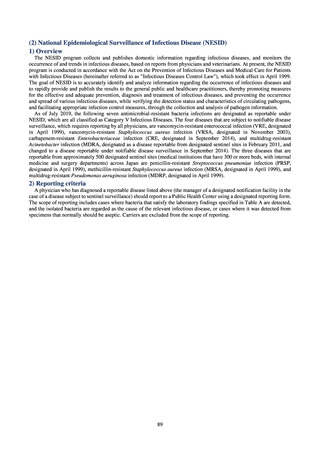
In 2019, useage of antimicrobial agents in Japan based on total yearly sales fell by 10.9% from 2013 to a defined
daily dose per 1,000 inhabitants per day (DID) of 13.3. Oral antimicrobial agents accounted for 91.8% of total
sales, with cephalosporins, fluoroquinolones, and macrolides accounting for the highest shares. While the trend
remained similar in 2019, a further decline in usage from 2018 was observed, with the usage of each agent
declining by 22.7%, 18.1%, and 20.6% respectively since 2013. However, use of parenteral antimicrobials saw a
12.7% increase from 2013.
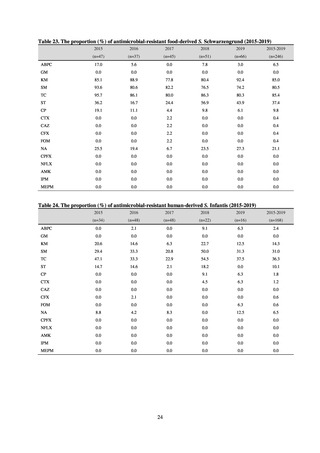
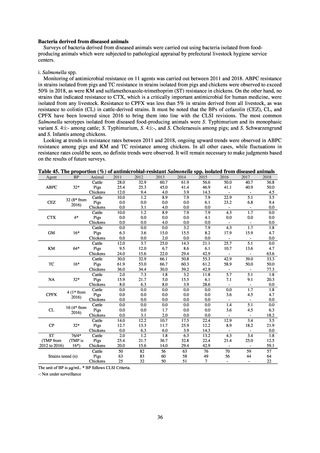
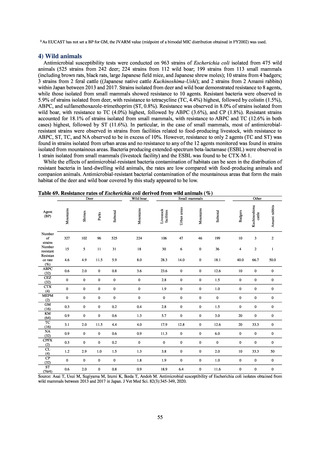
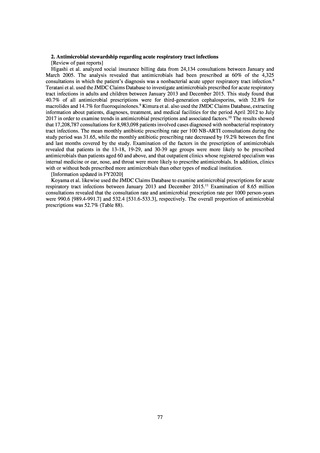
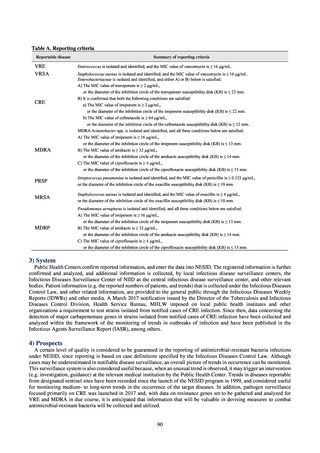
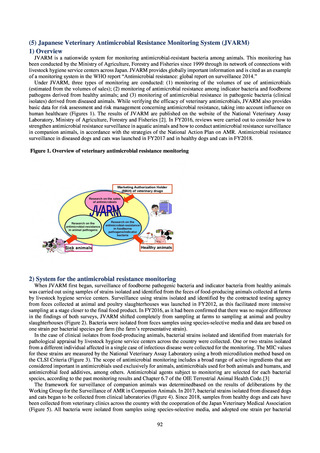
Surveillance of antimicrobial resistance in animals focuses on food-producing animals (cattle, pigs, and
chickens), aquatic animals (all farmed fish species), and companion animals (dogs and cats). No
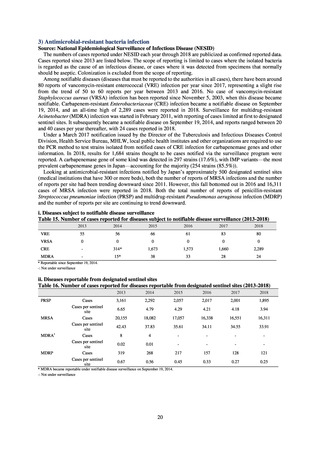
Enterobacteriaceae resistant to carbapenems, which is one of the most critically important antimicrobial classes
for human medicine, or vancomycin-resistant enterococci, which cause major problems including nosocomial
infections in humans, were isolated.
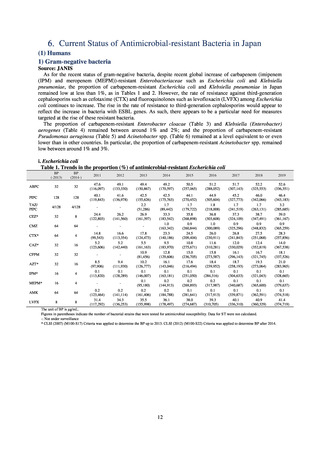
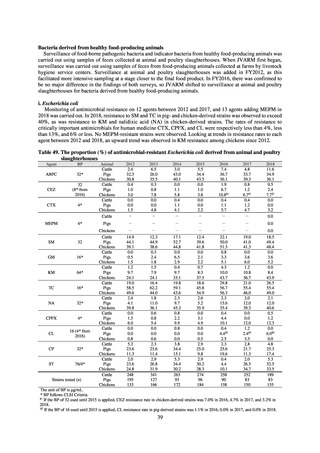
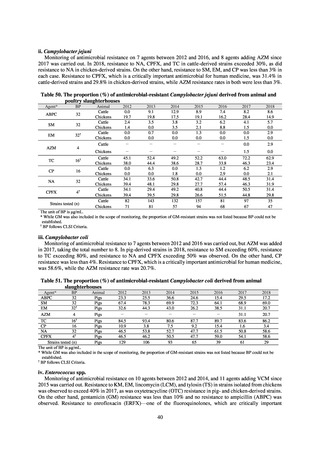
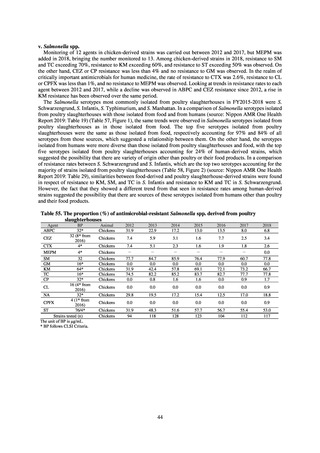
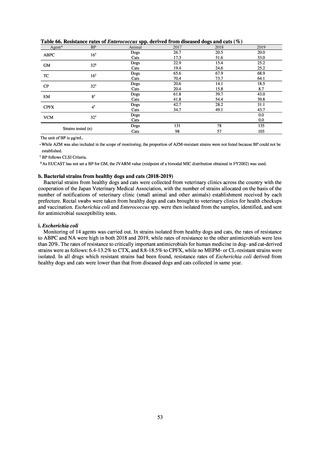
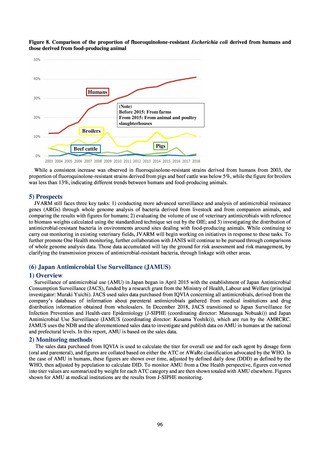
Among food-producing animals, while tetracycline resistance in Escherichia coli derived from healthy foodproducing animals—an outcome index for the Action Plan—fell from 45.2% in 2014 to 39.9% in 2015, the rate
has undergone repeated fluctuations since 2016 and has failed to fall, reaching 43.6% in 2018. On the other hand,
rates of resistance to third-generation cephalosporins and fluoroquinolones mostly remained below 10% between
2014 and 2018.
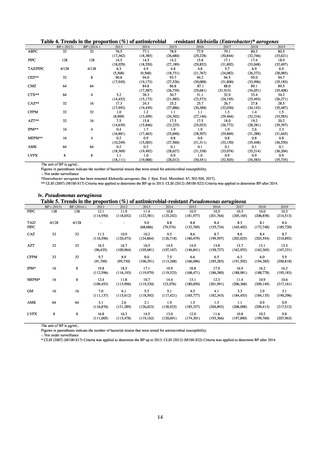
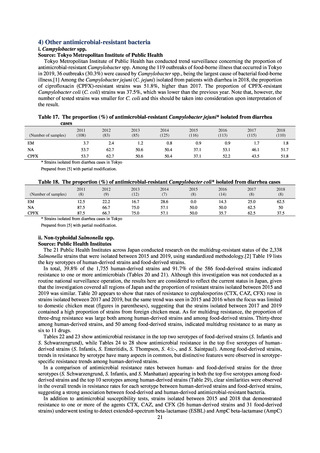
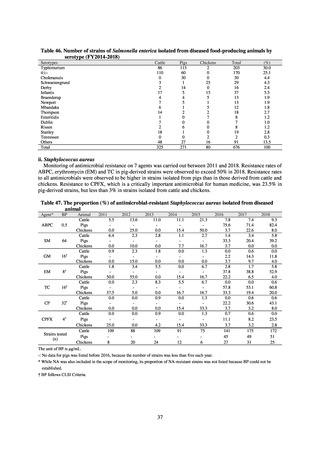
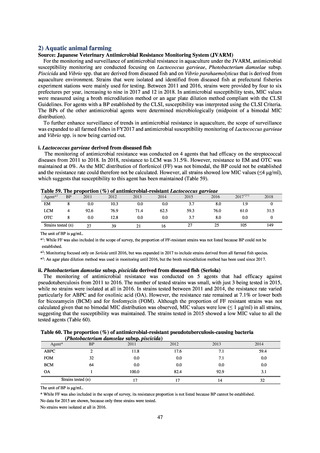
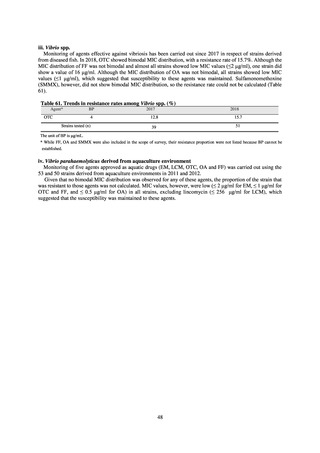
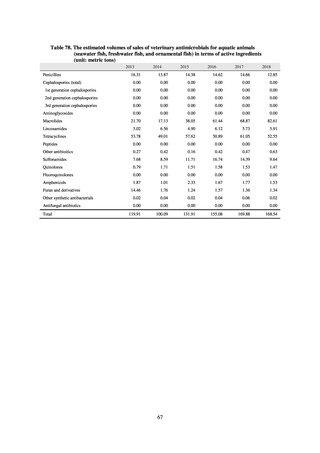
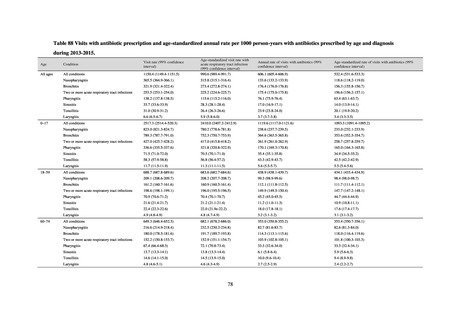
Among aquatic animals, lincomycin resistance in Lactococcus garvieae derived from diseased fish fell from
61.0% in 2017 to 31.5% in 2018, while no strains resistant to erythromycin or oxytetracycline were found in this
bacteria.
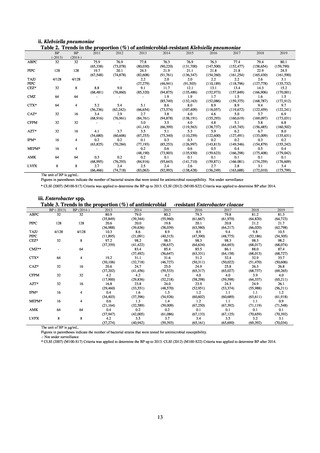
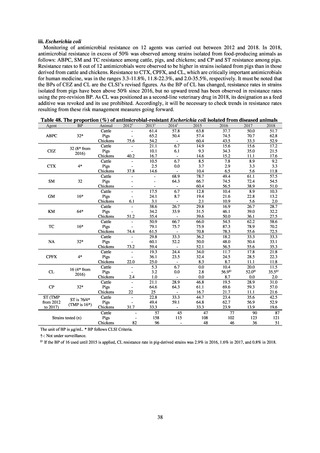
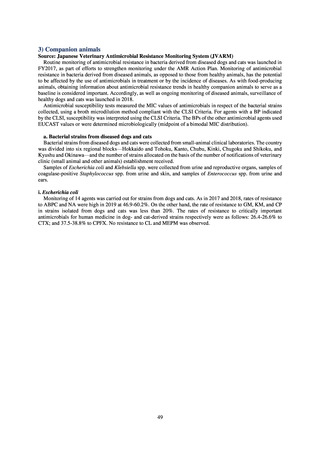
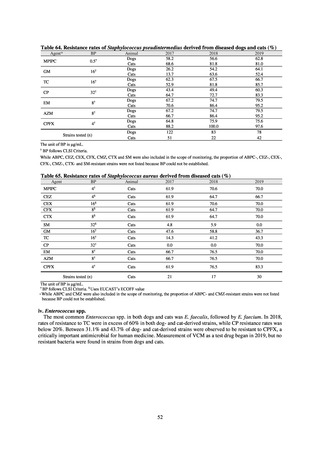
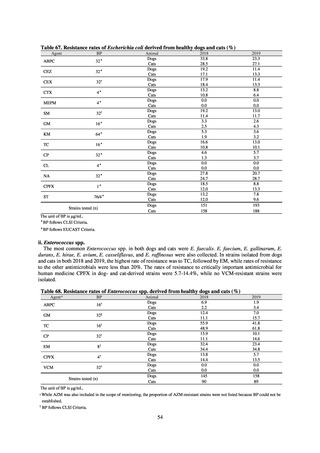
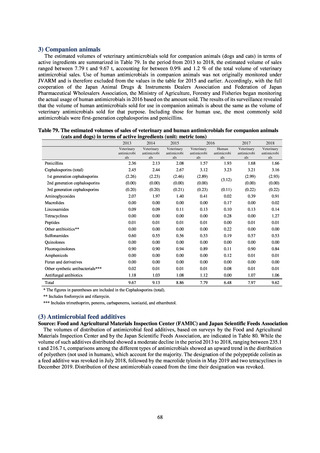
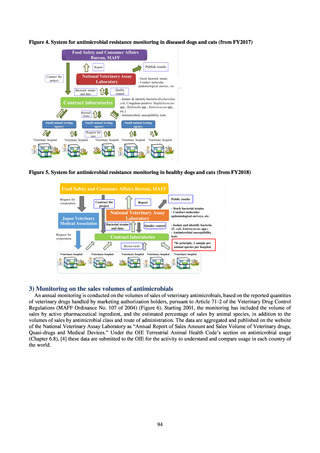
Among companion animals, while Escherichia coli isolated from diseased dogs and cats demonstrated lower
resistance to tetracyclines and aminoglycosides than among food-producing animals, resistance rates to the
fluoroquinolones and cephalosporins that are critically important antimicrobials for human medicine tended to be
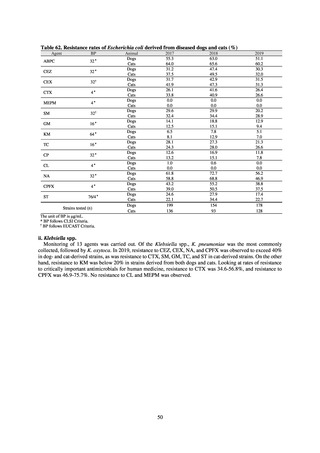
higher. Escherichia coli isolated from healthy companion animals (dogs and cats) demonstrated lower resistance
to all antimicrobials than in the case of diseased ones, demonstrating that susceptibility is being broadly maintained.
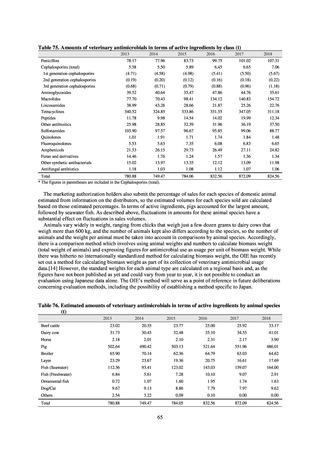
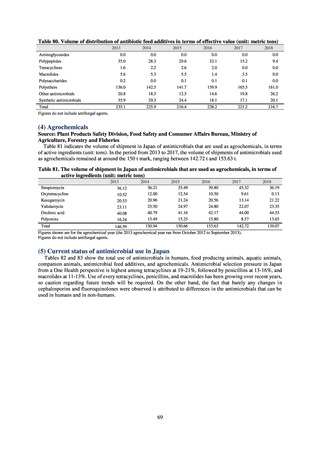
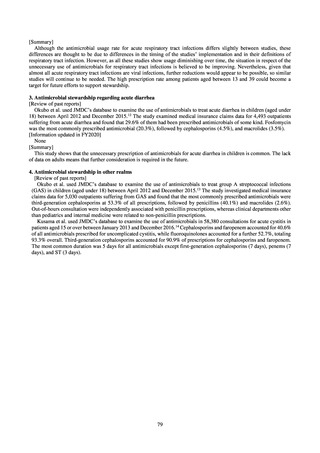
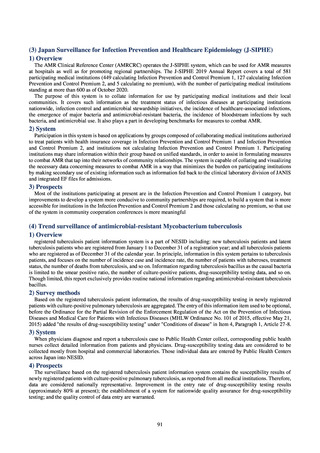
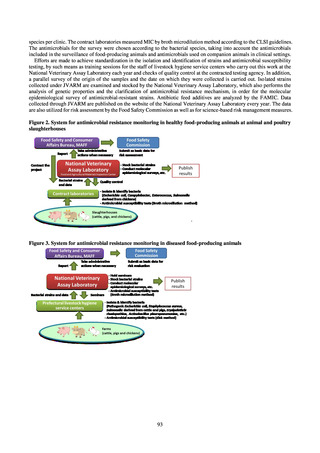
The volume of sales of antimicrobials used for animals (food-producing animals, aquatic animals, and
companion animals) was calculated in metric tons (t) of the active ingredients, based on sales reports for antibiotics
and synthetic antimicrobials mandated by Article 71-2 of the Regulations for Veterinary Drugs (Ordinance of the
Ministry of Agriculture, Forestry and Fisheries No. 107 of 2004). In 2018, tetracyclines represented the largest
share of antimicrobial sales, accounting for about 40%. In contrast, third-generation cephalosporins and
fluoroquinolones each accounted for less than 1% of the total. The total volume of veterinary antimicrobial sales
increased from 780.88 t in 2013 to 872.09 t in 2017, but then fell by around 48 t to 824.56 tons in 2018. Looking
at the figures by class, sales of tetracyclines fell by about 36 t, sulfonamide by around 10 t, and aminoglycosides
by approximately 9 t. On the other hand, sales of macrolides (erythromycin used in aquatic animals) increased by
around 14 t and penicillin derivatives used in food-producing animals by about 8 t, with the rise in erythromycin
used in aquatic animals presumed to have been triggered by treatment necessitated by an outbreak of infectious
disease caused by Lactococcus garvieae of a different serotype from that usually found.
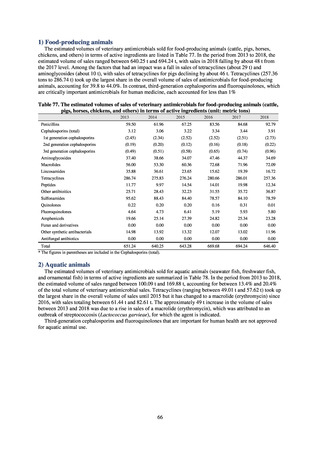
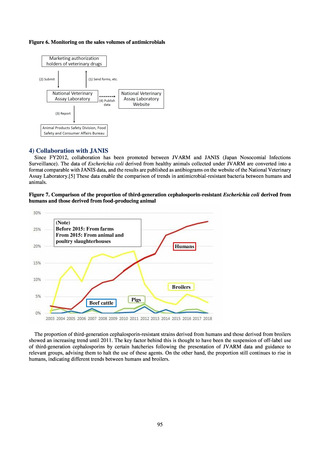
Total usage of antimicrobials in 2018 estimated from the volume of sales in each field was 1,761.4 t, comprising
582.1 t for human use, 646.4 t for food-producing animals, 168.5 t for aquatic animals, 8.6 t for companion animals,
216.7 t for antibiotic feed additives, and 139.1 t for agrochemicals.
9
daily dose per 1,000 inhabitants per day (DID) of 13.3. Oral antimicrobial agents accounted for 91.8% of total
sales, with cephalosporins, fluoroquinolones, and macrolides accounting for the highest shares. While the trend
remained similar in 2019, a further decline in usage from 2018 was observed, with the usage of each agent
declining by 22.7%, 18.1%, and 20.6% respectively since 2013. However, use of parenteral antimicrobials saw a
12.7% increase from 2013.
Surveillance of antimicrobial resistance in animals focuses on food-producing animals (cattle, pigs, and
chickens), aquatic animals (all farmed fish species), and companion animals (dogs and cats). No
Enterobacteriaceae resistant to carbapenems, which is one of the most critically important antimicrobial classes
for human medicine, or vancomycin-resistant enterococci, which cause major problems including nosocomial
infections in humans, were isolated.
Among food-producing animals, while tetracycline resistance in Escherichia coli derived from healthy foodproducing animals—an outcome index for the Action Plan—fell from 45.2% in 2014 to 39.9% in 2015, the rate
has undergone repeated fluctuations since 2016 and has failed to fall, reaching 43.6% in 2018. On the other hand,
rates of resistance to third-generation cephalosporins and fluoroquinolones mostly remained below 10% between
2014 and 2018.
Among aquatic animals, lincomycin resistance in Lactococcus garvieae derived from diseased fish fell from
61.0% in 2017 to 31.5% in 2018, while no strains resistant to erythromycin or oxytetracycline were found in this
bacteria.
Among companion animals, while Escherichia coli isolated from diseased dogs and cats demonstrated lower
resistance to tetracyclines and aminoglycosides than among food-producing animals, resistance rates to the
fluoroquinolones and cephalosporins that are critically important antimicrobials for human medicine tended to be
higher. Escherichia coli isolated from healthy companion animals (dogs and cats) demonstrated lower resistance
to all antimicrobials than in the case of diseased ones, demonstrating that susceptibility is being broadly maintained.
The volume of sales of antimicrobials used for animals (food-producing animals, aquatic animals, and
companion animals) was calculated in metric tons (t) of the active ingredients, based on sales reports for antibiotics
and synthetic antimicrobials mandated by Article 71-2 of the Regulations for Veterinary Drugs (Ordinance of the
Ministry of Agriculture, Forestry and Fisheries No. 107 of 2004). In 2018, tetracyclines represented the largest
share of antimicrobial sales, accounting for about 40%. In contrast, third-generation cephalosporins and
fluoroquinolones each accounted for less than 1% of the total. The total volume of veterinary antimicrobial sales
increased from 780.88 t in 2013 to 872.09 t in 2017, but then fell by around 48 t to 824.56 tons in 2018. Looking
at the figures by class, sales of tetracyclines fell by about 36 t, sulfonamide by around 10 t, and aminoglycosides
by approximately 9 t. On the other hand, sales of macrolides (erythromycin used in aquatic animals) increased by
around 14 t and penicillin derivatives used in food-producing animals by about 8 t, with the rise in erythromycin
used in aquatic animals presumed to have been triggered by treatment necessitated by an outbreak of infectious
disease caused by Lactococcus garvieae of a different serotype from that usually found.
Total usage of antimicrobials in 2018 estimated from the volume of sales in each field was 1,761.4 t, comprising
582.1 t for human use, 646.4 t for food-producing animals, 168.5 t for aquatic animals, 8.6 t for companion animals,
216.7 t for antibiotic feed additives, and 139.1 t for agrochemicals.
9