

よむ、つかう、まなぶ。
【参考資料3】【英版R4.1.17】Nippon AMR One Health Report (NAOR) 2020 (13 ページ)
出典
| 公開元URL | https://www.mhlw.go.jp/stf/newpage_23261.html |
| 出典情報 | 国際的に脅威となる感染症対策関係閣僚会議 薬剤耐性ワンヘルス動向調査検討会(第9回 1/17)《厚生労働省》 |
ページ画像
ダウンロードした画像を利用する際は「出典情報」を明記してください。
低解像度画像をダウンロード
プレーンテキスト
資料テキストはコンピュータによる自動処理で生成されており、完全に資料と一致しない場合があります。
テキストをコピーしてご利用いただく際は資料と付け合わせてご確認ください。
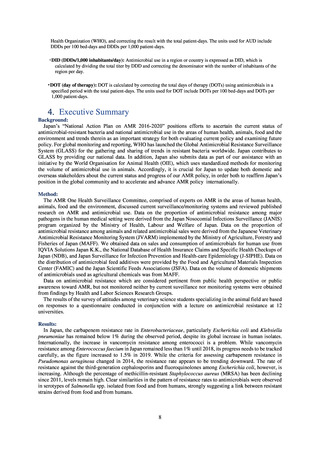
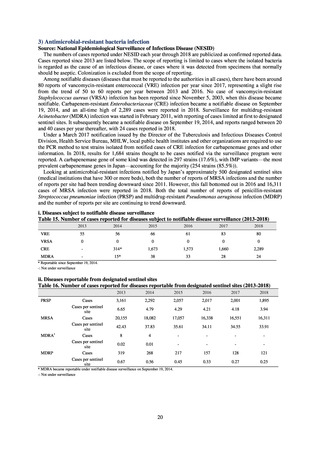
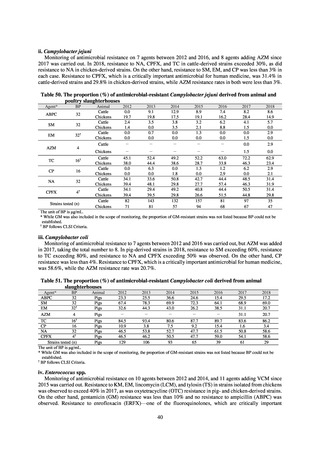
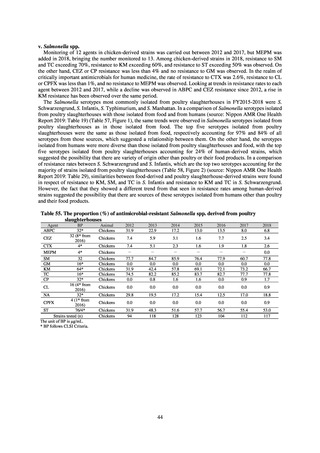
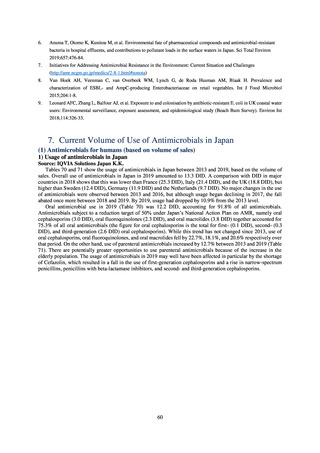
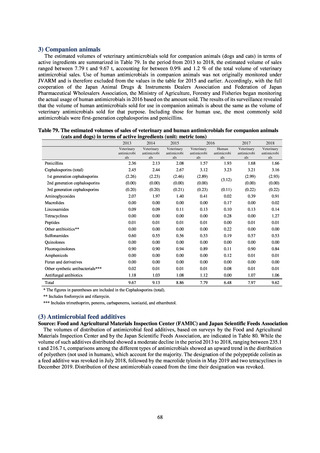
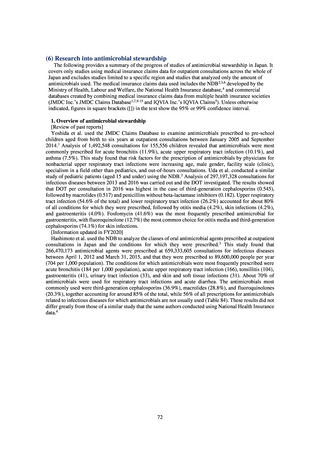
Current Status of Antimicrobial-resistant Bacteria in Japan
(1) Humans
1) Gram-negative bacteria
Source: JANIS
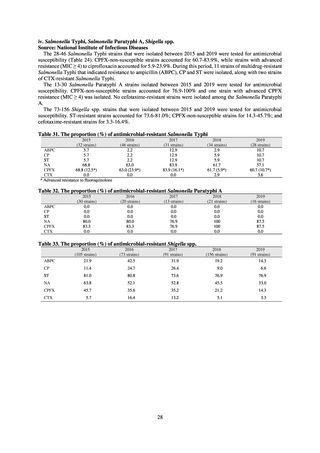
As for the recent status of gram-negative bacteria, despite recent global increase of carbapenem (imipenem
(IPM) and meropenem (MEPM))-resistant Enterobacteriaceae such as Escherichia coli and Klebsiella
pneumoniae, the proportion of carbapenem-resistant Escherichia coli and Klebsiella pneumoniae in Japan
remained low at less than 1%, as in Tables 1 and 2. However, the rate of resistance against third-generation
cephalosporins such as cefotaxime (CTX) and fluoroquinolones such as levofloxacin (LVFX) among Escherichia
coli continues to increase. The rise in the rate of resistance to third-generation cephalosporins would appear to
reflect the increase in bacteria with ESBL genes. As such, there appears to be a particular need for measures
targeted at the rise of these resistant bacteria.
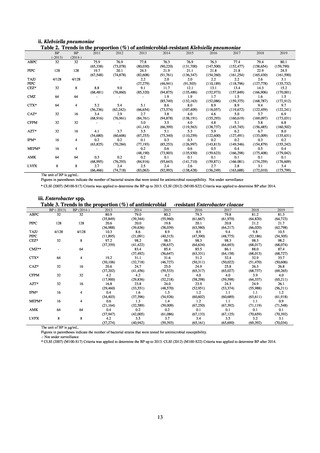
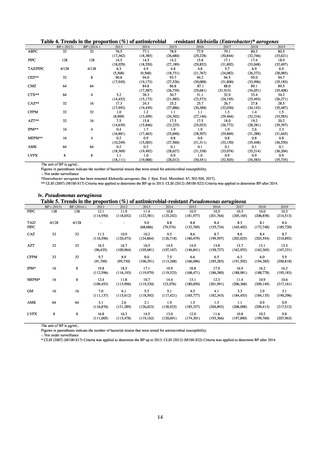
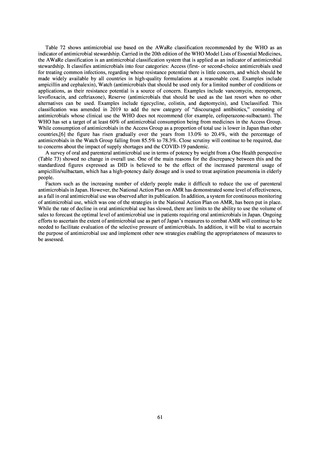
The proportion of carbapenem-resistant Enterobacter cloacae (Table 3) and Klebsiella (Enterobacter)
aerogenes (Table 4) remained between around 1% and 2%; and the proportion of carbapenem-resistant
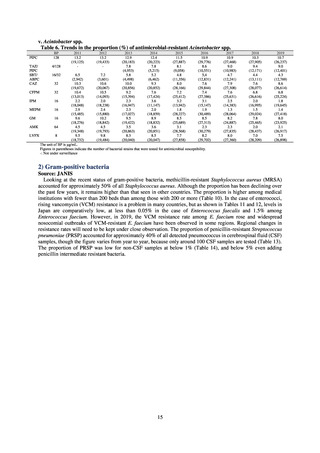
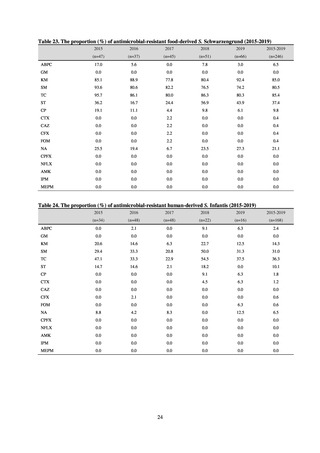
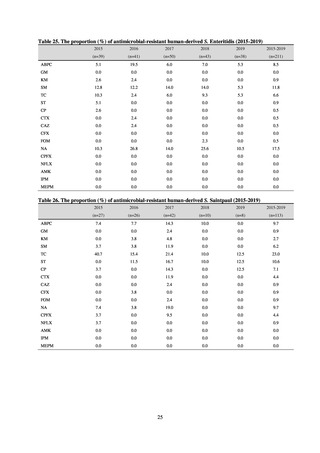
Pseudomonas aeruginosa (Table 5) and Acinetobacter spp. (Table 6) remained at a level equivalent to or even
lower than in other countries. In particular, the proportion of carbapenem-resistant Acinetobacter spp. remained
low between around 1% and 3%.
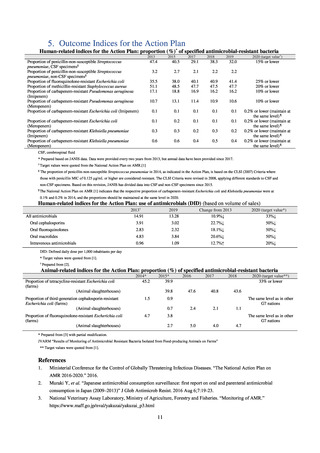
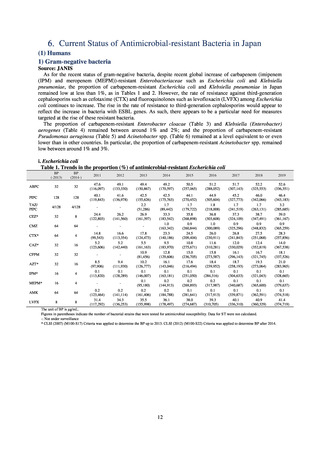
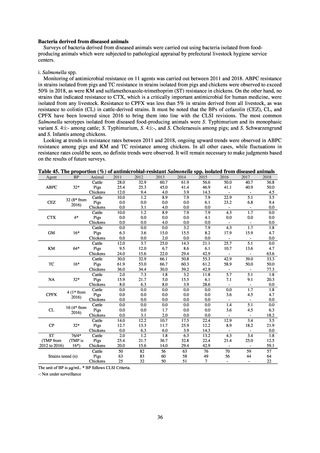
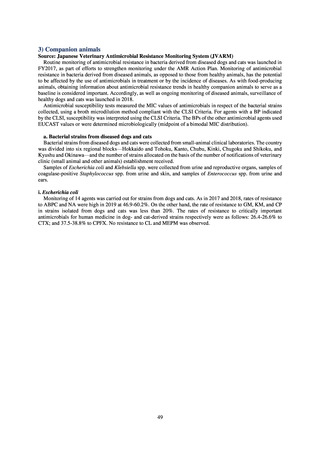
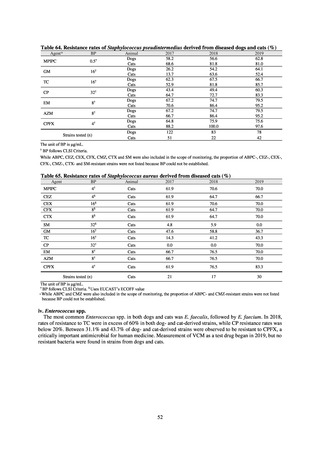
ⅰ. Escherichia coli
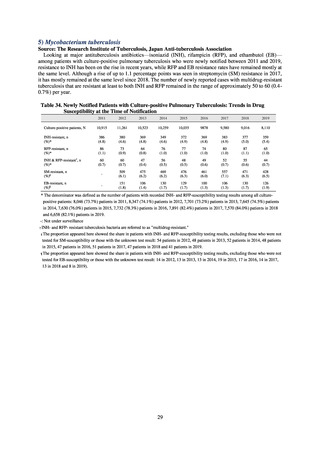
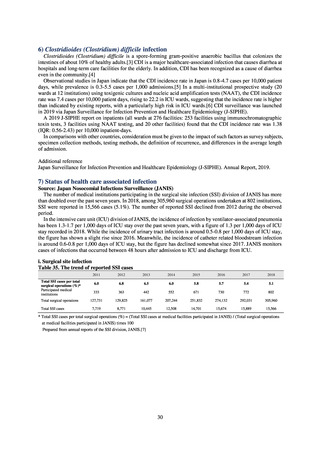
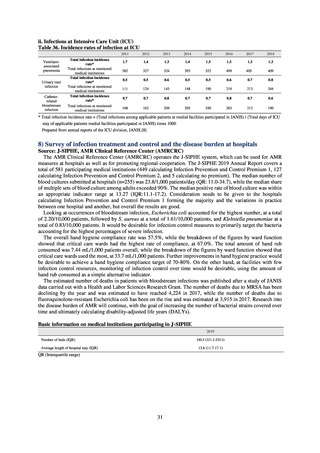
Table 1. Trends in the proportion (%) of antimicrobial-resistant Escherichia coli
BP
(-2013)
BP
(2014-)
2011
2012
2013
2014
2015
2016
2017
2018
2019
ABPC
32
32
47.6
(116,097)
49.1
(133,330)
49.4
(150,867)
49.2
(170,597)
50.5
(257,065)
51.2
(288,052)
51.7
(307,143)
52.2
(325,553)
52.6
(336,351)
PIPC
128
128
40.1
(119,843)
41.6
(136,978)
TAZ/
PIPC
4/128
4/128
-
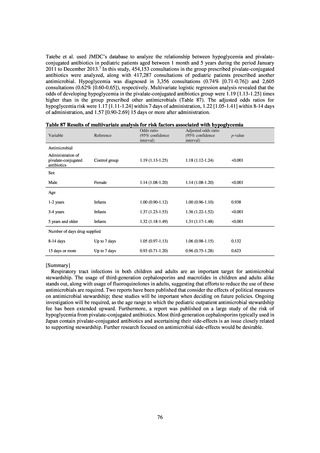
-
CEZ*
32
8
24.4
(122,803)
26.2
(141,560)
42.5
(155,626)
2.2
(51,286)
26.9
(161,397)
CMZ
64
64
-
-
-
CTX*
64
4
CAZ*
32
16
14.8
(99,543)
5.2
(123,606)
16.6
(113,354)
5.2
(142,440)
CFPM
32
32
-
-
AZT*
32
16
IPM*
16
4
8.5
(97,906)
0.1
(113,820)
9.4
(111,930)
0.1
(128,289)
MEPM*
16
4
17.8
(124,473)
5.5
(161,163)
10.9
(81,456)
10.2
(126,777)
0.1
(146,007)
0.1
(95,180)
0.2
(161,406)
35.5
(155,998)
42.5
(175,763)
1.7
(89,442)
33.3
(183,542)
1.0
(163,342)
23.3
(140,186)
9.5
(183,970)
12.8
(129,606)
16.1
(143,046)
0.1
(163,181)
0.2
(144,913)
0.2
(184,788)
36.1
(178,497)
44.1
(270,452)
1.7
(179,722)
35.8
(268,898)
0.9
(260,844)
24.5
(209,404)
10.8
(275,671)
15.0
(236,705)
17.6
(216,494)
0.1
(251,050)
0.2
(269,893)
0.1
(281,641)
38.0
(274,687)
44.9
(305,604)
1.8
(218,008)
36.8
(303,608)
1.0
(300,089)
26.0
(230,911)
11.6
(310,281)
15.8
(273,587)
18.4
(239,952)
0.1
(284,316)
0.2
(317,987)
0.1
(317,913)
39.3
(310,705)
45.2
(327,773)
1.7
(241,519)
37.3
(324,109)
0.9
(325,296)
26.8
(241,843)
12.0
(330,029)
16.1
(296,143)
18.7
(258,193)
0.1
(304,633)
0.1
(340,687)
0.1
(339,871)
40.1
(336,310)
46.0
(342,066)
1.7
(263,131)
38.7
(347,491)
0.9
(348,832)
27.5
(251,068)
12.4
(352,819)
16.7
(321,745)
19.3
(273,064)
0.1
(321,043)
0.1
(365,600)
0.1
(362,591)
40.9
(360,329)
46.4
(343,183)
3.2
(285,685)
39.0
(361,167)
0.9
(365,259)
28.3
(257,856)
14.0
(367,538)
18.1
(337,526)
21.0
(283,965)
0.1
(328,665)
0.1
(379,637)
0.1
(374,518)
41.4
(374,719)
AMK
64
64
LVFX
8
8
-
-
0.2
(123,464)
31.4
(117,292)
0.2
(141,114)
34.3
(136,253)
The unit of BP is μg/mL.
Figures in parentheses indicate the number of bacterial strains that were tested for antimicrobial susceptibility. Data for ST were not calculated.
-: Not under surveillance
* CLSI (2007) (M100-S17) Criteria was applied to determine the BP up to 2013. CLSI (2012) (M100-S22) Criteria was applied to determine BP after 2014.
12
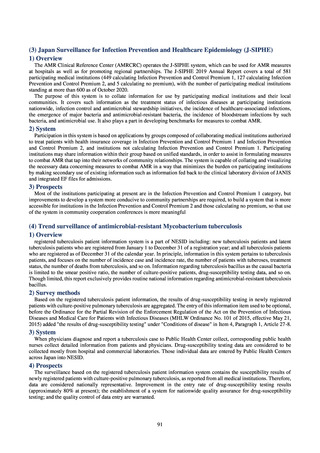
(1) Humans
1) Gram-negative bacteria
Source: JANIS
As for the recent status of gram-negative bacteria, despite recent global increase of carbapenem (imipenem
(IPM) and meropenem (MEPM))-resistant Enterobacteriaceae such as Escherichia coli and Klebsiella
pneumoniae, the proportion of carbapenem-resistant Escherichia coli and Klebsiella pneumoniae in Japan
remained low at less than 1%, as in Tables 1 and 2. However, the rate of resistance against third-generation
cephalosporins such as cefotaxime (CTX) and fluoroquinolones such as levofloxacin (LVFX) among Escherichia
coli continues to increase. The rise in the rate of resistance to third-generation cephalosporins would appear to
reflect the increase in bacteria with ESBL genes. As such, there appears to be a particular need for measures
targeted at the rise of these resistant bacteria.
The proportion of carbapenem-resistant Enterobacter cloacae (Table 3) and Klebsiella (Enterobacter)
aerogenes (Table 4) remained between around 1% and 2%; and the proportion of carbapenem-resistant
Pseudomonas aeruginosa (Table 5) and Acinetobacter spp. (Table 6) remained at a level equivalent to or even
lower than in other countries. In particular, the proportion of carbapenem-resistant Acinetobacter spp. remained
low between around 1% and 3%.
ⅰ. Escherichia coli
Table 1. Trends in the proportion (%) of antimicrobial-resistant Escherichia coli
BP
(-2013)
BP
(2014-)
2011
2012
2013
2014
2015
2016
2017
2018
2019
ABPC
32
32
47.6
(116,097)
49.1
(133,330)
49.4
(150,867)
49.2
(170,597)
50.5
(257,065)
51.2
(288,052)
51.7
(307,143)
52.2
(325,553)
52.6
(336,351)
PIPC
128
128
40.1
(119,843)
41.6
(136,978)
TAZ/
PIPC
4/128
4/128
-
-
CEZ*
32
8
24.4
(122,803)
26.2
(141,560)
42.5
(155,626)
2.2
(51,286)
26.9
(161,397)
CMZ
64
64
-
-
-
CTX*
64
4
CAZ*
32
16
14.8
(99,543)
5.2
(123,606)
16.6
(113,354)
5.2
(142,440)
CFPM
32
32
-
-
AZT*
32
16
IPM*
16
4
8.5
(97,906)
0.1
(113,820)
9.4
(111,930)
0.1
(128,289)
MEPM*
16
4
17.8
(124,473)
5.5
(161,163)
10.9
(81,456)
10.2
(126,777)
0.1
(146,007)
0.1
(95,180)
0.2
(161,406)
35.5
(155,998)
42.5
(175,763)
1.7
(89,442)
33.3
(183,542)
1.0
(163,342)
23.3
(140,186)
9.5
(183,970)
12.8
(129,606)
16.1
(143,046)
0.1
(163,181)
0.2
(144,913)
0.2
(184,788)
36.1
(178,497)
44.1
(270,452)
1.7
(179,722)
35.8
(268,898)
0.9
(260,844)
24.5
(209,404)
10.8
(275,671)
15.0
(236,705)
17.6
(216,494)
0.1
(251,050)
0.2
(269,893)
0.1
(281,641)
38.0
(274,687)
44.9
(305,604)
1.8
(218,008)
36.8
(303,608)
1.0
(300,089)
26.0
(230,911)
11.6
(310,281)
15.8
(273,587)
18.4
(239,952)
0.1
(284,316)
0.2
(317,987)
0.1
(317,913)
39.3
(310,705)
45.2
(327,773)
1.7
(241,519)
37.3
(324,109)
0.9
(325,296)
26.8
(241,843)
12.0
(330,029)
16.1
(296,143)
18.7
(258,193)
0.1
(304,633)
0.1
(340,687)
0.1
(339,871)
40.1
(336,310)
46.0
(342,066)
1.7
(263,131)
38.7
(347,491)
0.9
(348,832)
27.5
(251,068)
12.4
(352,819)
16.7
(321,745)
19.3
(273,064)
0.1
(321,043)
0.1
(365,600)
0.1
(362,591)
40.9
(360,329)
46.4
(343,183)
3.2
(285,685)
39.0
(361,167)
0.9
(365,259)
28.3
(257,856)
14.0
(367,538)
18.1
(337,526)
21.0
(283,965)
0.1
(328,665)
0.1
(379,637)
0.1
(374,518)
41.4
(374,719)
AMK
64
64
LVFX
8
8
-
-
0.2
(123,464)
31.4
(117,292)
0.2
(141,114)
34.3
(136,253)
The unit of BP is μg/mL.
Figures in parentheses indicate the number of bacterial strains that were tested for antimicrobial susceptibility. Data for ST were not calculated.
-: Not under surveillance
* CLSI (2007) (M100-S17) Criteria was applied to determine the BP up to 2013. CLSI (2012) (M100-S22) Criteria was applied to determine BP after 2014.
12