
よむ、つかう、まなぶ。
【参考資料3】【英版R4.1.17】Nippon AMR One Health Report (NAOR) 2020 (12 ページ)
出典
| 公開元URL | https://www.mhlw.go.jp/stf/newpage_23261.html |
| 出典情報 | 国際的に脅威となる感染症対策関係閣僚会議 薬剤耐性ワンヘルス動向調査検討会(第9回 1/17)《厚生労働省》 |
ページ画像
ダウンロードした画像を利用する際は「出典情報」を明記してください。
低解像度画像をダウンロード
プレーンテキスト
資料テキストはコンピュータによる自動処理で生成されており、完全に資料と一致しない場合があります。
テキストをコピーしてご利用いただく際は資料と付け合わせてご確認ください。
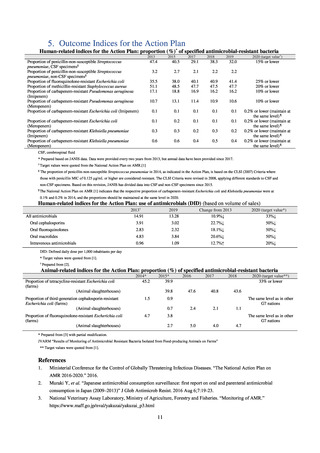
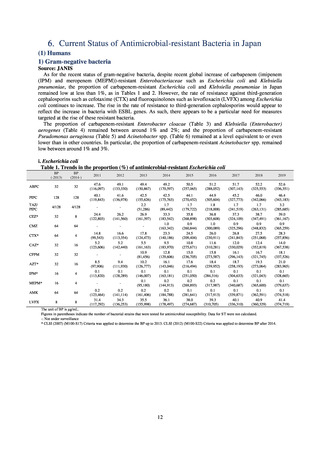
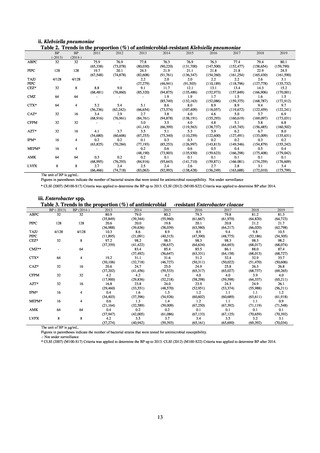
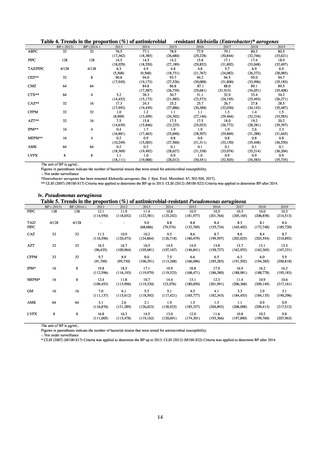
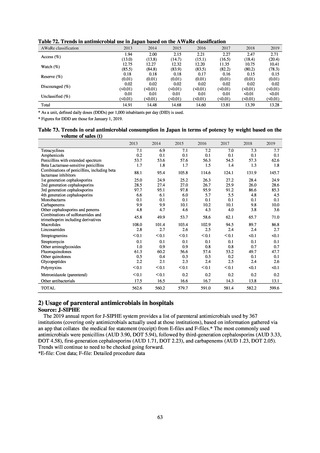
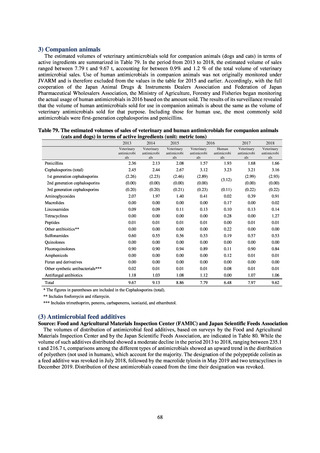
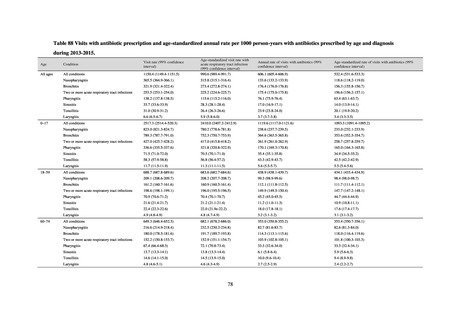
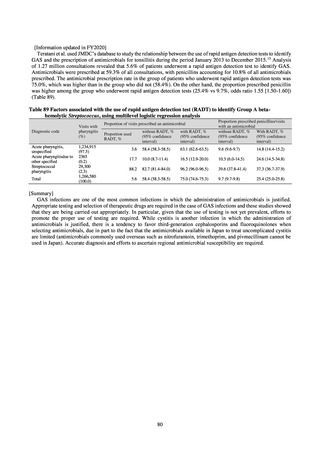
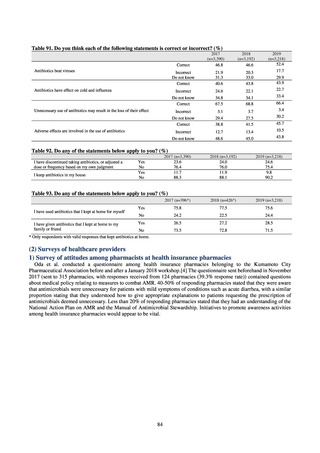
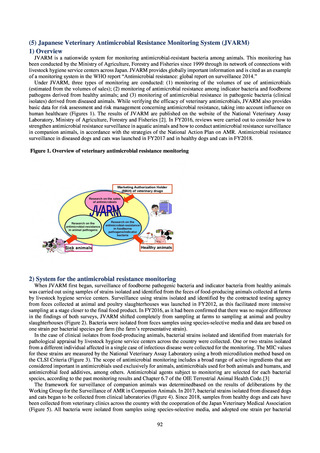
Outcome Indices for the Action Plan
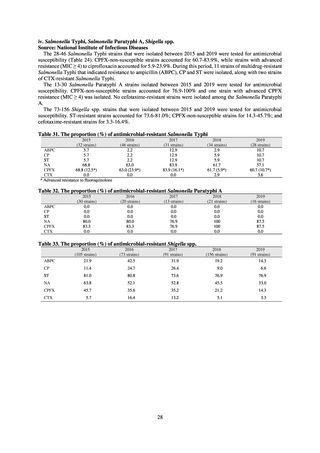
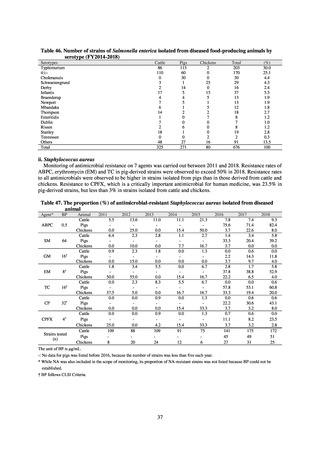
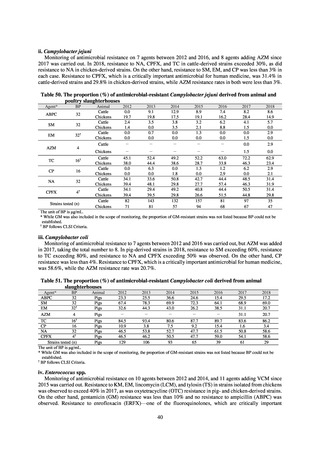
Human-related indices for the Action Plan: proportion (%)* of specified antimicrobial-resistant bacteria
2013
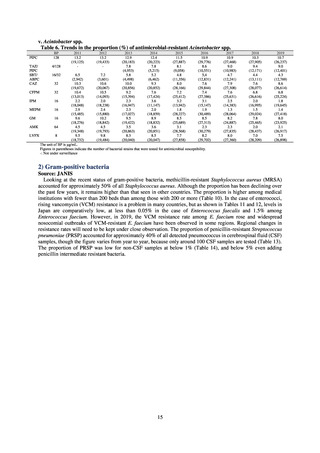
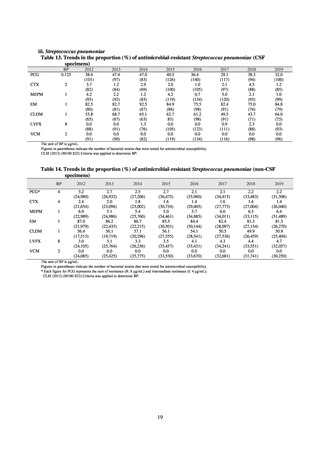
Proportion of penicillin-non-susceptible Streptococcus
pneumoniae, CSF specimens§
Proportion of penicillin-non-susceptible Streptococcus
pneumoniae, non-CSF specimens§
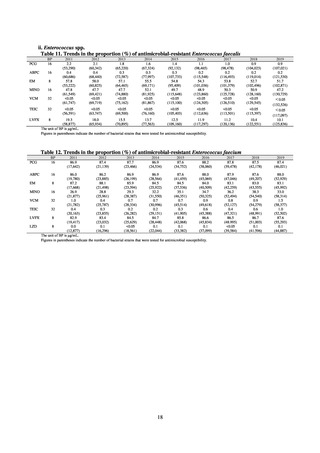
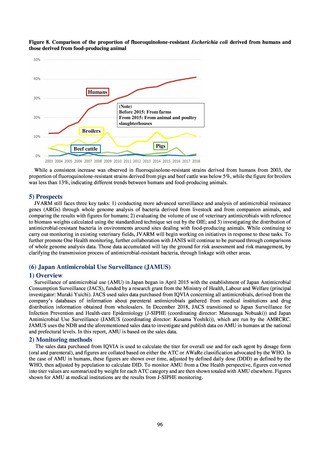
Proportion of fluoroquinolone-resistant Escherichia coli
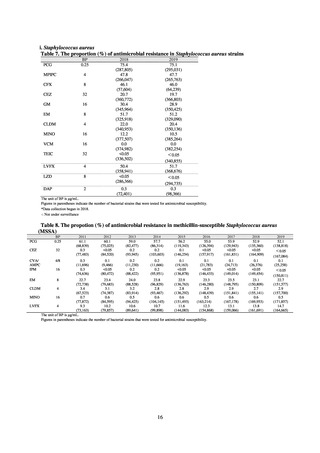
Proportion of methicillin-resistant Staphylococcus aureus
Proportion of carbapenem-resistant Pseudomonas aeruginosa
(Imipenem)
Proportion of carbapenem-resistant Pseudomonas aeruginosa
(Meropenem)
Proportion of carbapenem-resistant Escherichia coli (Imipenem)
2015
2017
2018
2020 (target value†)
2019
47.4
40.5
29.1
38.3
32.0
3.2
2.7
2.1
2.2
2.2
35.5
51.1
17.1
38.0
48.5
18.8
40.1
47.7
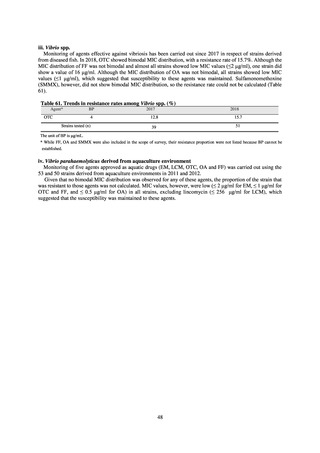
16.9
40.9
47.5
16.2
41.4
47.7
16.2
25% or lower
20% or lower
10% or lower
10.7
13.1
11.4
10.9
10.6
10% or lower
0.1
0.1
0.1
0.1
0.1
0.1
0.2
0.1
0.1
0.1
0.3
0.3
0.2
0.3
0.2
0.6
0.6
0.4
0.5
0.4
0.2% or lower (maintain at
the same level) ¶
0.2% or lower (maintain at
the same level) ¶
0.2% or lower (maintain at
the same level) ¶
0.2% or lower (maintain at
the same level) ¶
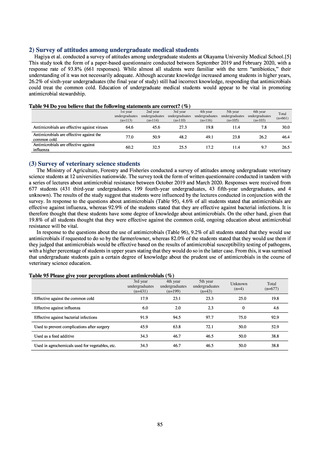
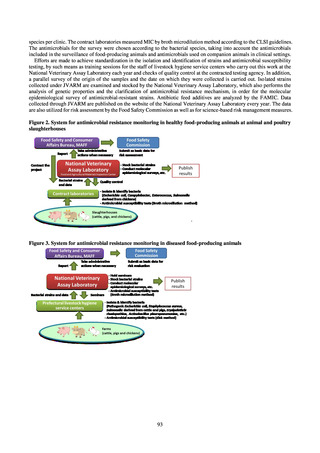
Proportion of carbapenem-resistant Escherichia coli
(Meropenem)
Proportion of carbapenem-resistant Klebsiella pneumoniae
(Imipenem)
Proportion of carbapenem-resistant Klebsiella pneumoniae
(Meropenem)
15% or lower
CSF, cerebrospinal fluid
* Prepared based on JANIS data. Data were provided every two years from 2013, but annual data have been provided since 2017.
†
§
Target values were quoted from the National Action Plan on AMR.[1]
The proportion of penicillin-non-susceptible Streptococcus pneumoniae in 2014, as indicated in the Action Plan, is based on the CLSI (2007) Criteria where
those with penicillin MIC of 0.125 μg/mL or higher are considered resistant. The CLSI Criteria were revised in 2008, applying different standards to CSF and
non-CSF specimens. Based on this revision, JANIS has divided data into CSF and non-CSF specimens since 2015.
¶
The National Action Plan on AMR [1] indicates that the respective proportion of carbapenem-resistant Escherichia coli and Klebsiella pneumoniae were at
0.1% and 0.2% in 2014, and the proportions should be maintained at the same level in 2020.
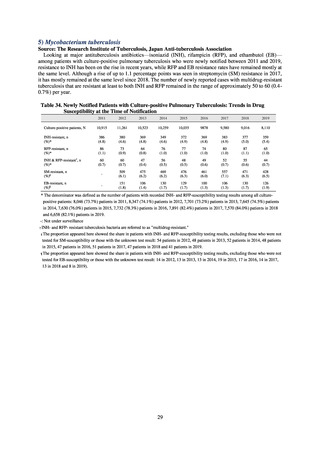
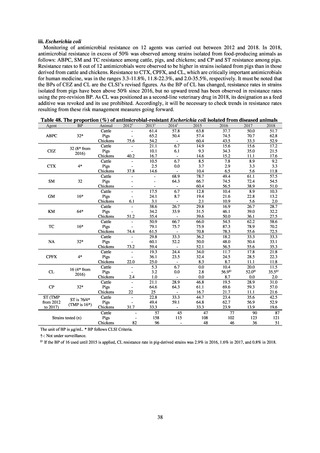
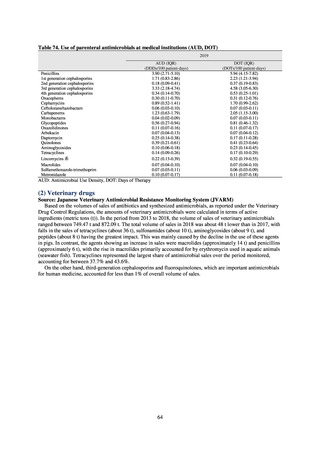
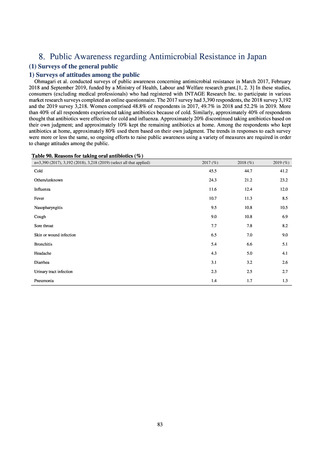
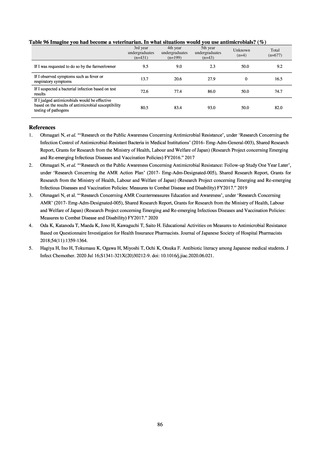
Human-related indices for the Action Plan: use of antimicrobials (DID) (based on volume of sales)
2013†
14.91
2019
13.28
Oral cephalosporins
3.91
3.02
22.7%↓
50%↓
Oral fluoroquinolones
2.83
2.32
18.1%↓
50%↓
Oral macrolides
4.83
3.84
20.6%↓
50%↓
Intravenous antimicrobials
0.96
1.09
12.7%↑
20%↓
All antimicrobials
Change from 2013
10.9%↓
2020 (target value*)
33%↓
DID: Defined daily dose per 1,000 inhabitants per day
* Target values were quoted from [1].
†
Prepared from [2].
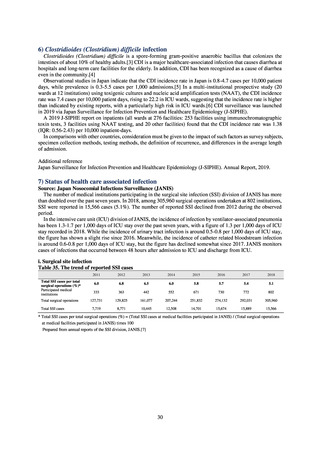
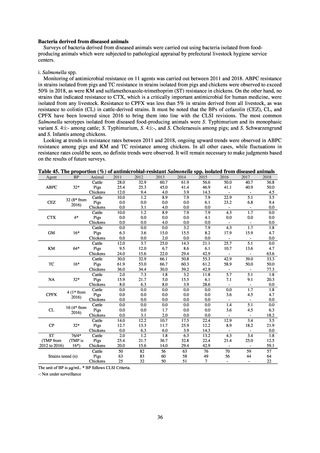
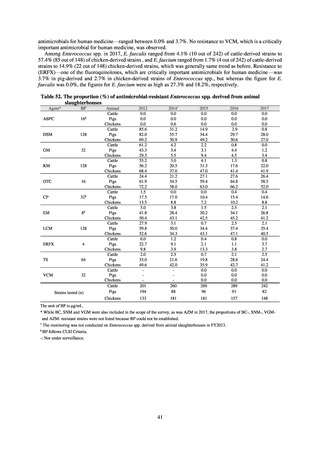
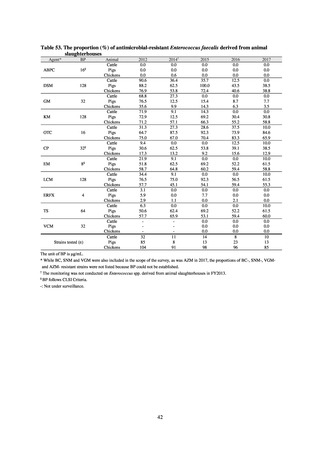
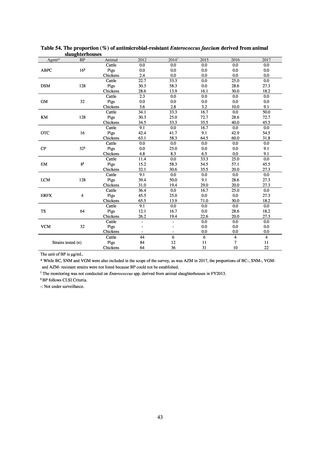
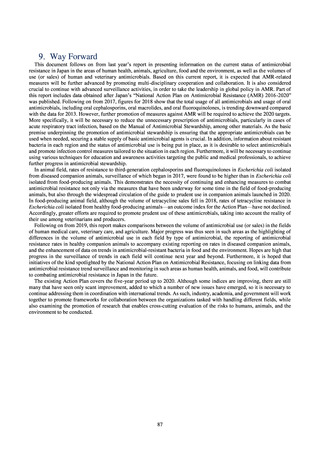
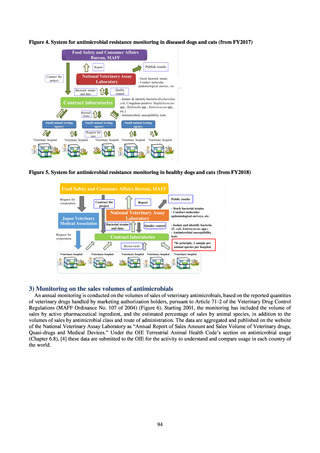
Animal-related indices for the Action Plan: proportion (%) of specified antimicrobial-resistant bacteria
Proportion of tetracycline-resistant Escherichia coli
(farms)
(Animal slaughterhouses)
2014*
45.2
2015*
39.9
39.8
Proportion of third-generation cephalosporin-resistant
Escherichia coli (farms)
(Animal slaughterhouses)
1.5
Proportion of fluoroquinolone-resistant Escherichia coli
(farms)
(Animal slaughterhouses)
4.7
2016
47.6
2017
40.8
2018
43.6
0.9
0.7
The same level as in other
G7 nations
2.4
2.1
1.1
3.8
2.7
2020 (target value**)
33% or lower
The same level as in other
G7 nations
5.0
4.0
4.7
* Prepared from [3] with partial modification.
JVARM “Results of Monitoring of Antimicrobial Resistant Bacteria Isolated from Food-producing Animals on Farms”
** Target values were quoted from [1].
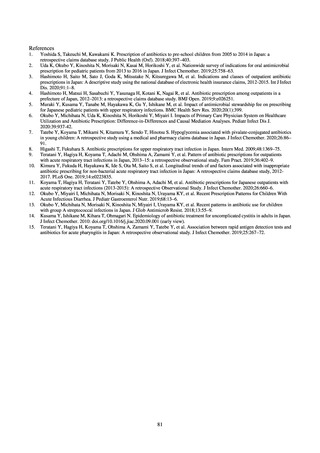
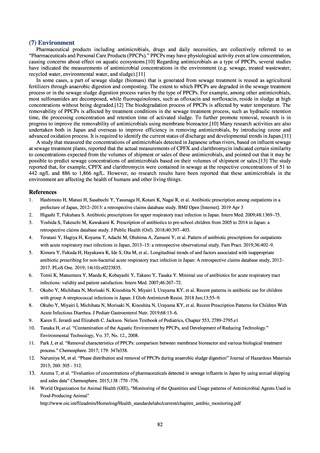
References
1.
Ministerial Conference for the Control of Globally Threatening Infectious Diseases. “The National Action Plan on
AMR 2016-2020.” 2016.
2.
Muraki Y, et al. “Japanese antimicrobial consumption surveillance: first report on oral and parenteral antimicrobial
consumption in Japan (2009–2013)” J Glob Antimicrob Resist. 2016 Aug 6;7:19-23.
3.
National Veterinary Assay Laboratory, Ministry of Agriculture, Forestry and Fisheries. “Monitoring of AMR.”
https://www.maff.go.jp/nval/yakuzai/yakuzai_p3.html
11
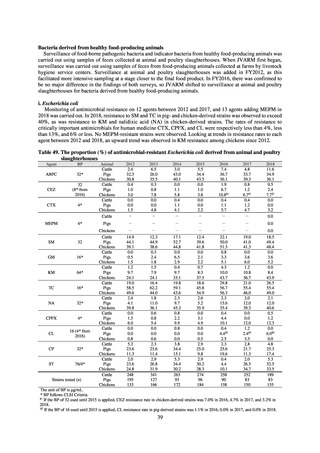
Human-related indices for the Action Plan: proportion (%)* of specified antimicrobial-resistant bacteria
2013
Proportion of penicillin-non-susceptible Streptococcus
pneumoniae, CSF specimens§
Proportion of penicillin-non-susceptible Streptococcus
pneumoniae, non-CSF specimens§
Proportion of fluoroquinolone-resistant Escherichia coli
Proportion of methicillin-resistant Staphylococcus aureus
Proportion of carbapenem-resistant Pseudomonas aeruginosa
(Imipenem)
Proportion of carbapenem-resistant Pseudomonas aeruginosa
(Meropenem)
Proportion of carbapenem-resistant Escherichia coli (Imipenem)
2015
2017
2018
2020 (target value†)
2019
47.4
40.5
29.1
38.3
32.0
3.2
2.7
2.1
2.2
2.2
35.5
51.1
17.1
38.0
48.5
18.8
40.1
47.7
16.9
40.9
47.5
16.2
41.4
47.7
16.2
25% or lower
20% or lower
10% or lower
10.7
13.1
11.4
10.9
10.6
10% or lower
0.1
0.1
0.1
0.1
0.1
0.1
0.2
0.1
0.1
0.1
0.3
0.3
0.2
0.3
0.2
0.6
0.6
0.4
0.5
0.4
0.2% or lower (maintain at
the same level) ¶
0.2% or lower (maintain at
the same level) ¶
0.2% or lower (maintain at
the same level) ¶
0.2% or lower (maintain at
the same level) ¶
Proportion of carbapenem-resistant Escherichia coli
(Meropenem)
Proportion of carbapenem-resistant Klebsiella pneumoniae
(Imipenem)
Proportion of carbapenem-resistant Klebsiella pneumoniae
(Meropenem)
15% or lower
CSF, cerebrospinal fluid
* Prepared based on JANIS data. Data were provided every two years from 2013, but annual data have been provided since 2017.
†
§
Target values were quoted from the National Action Plan on AMR.[1]
The proportion of penicillin-non-susceptible Streptococcus pneumoniae in 2014, as indicated in the Action Plan, is based on the CLSI (2007) Criteria where
those with penicillin MIC of 0.125 μg/mL or higher are considered resistant. The CLSI Criteria were revised in 2008, applying different standards to CSF and
non-CSF specimens. Based on this revision, JANIS has divided data into CSF and non-CSF specimens since 2015.
¶
The National Action Plan on AMR [1] indicates that the respective proportion of carbapenem-resistant Escherichia coli and Klebsiella pneumoniae were at
0.1% and 0.2% in 2014, and the proportions should be maintained at the same level in 2020.
Human-related indices for the Action Plan: use of antimicrobials (DID) (based on volume of sales)
2013†
14.91
2019
13.28
Oral cephalosporins
3.91
3.02
22.7%↓
50%↓
Oral fluoroquinolones
2.83
2.32
18.1%↓
50%↓
Oral macrolides
4.83
3.84
20.6%↓
50%↓
Intravenous antimicrobials
0.96
1.09
12.7%↑
20%↓
All antimicrobials
Change from 2013
10.9%↓
2020 (target value*)
33%↓
DID: Defined daily dose per 1,000 inhabitants per day
* Target values were quoted from [1].
†
Prepared from [2].
Animal-related indices for the Action Plan: proportion (%) of specified antimicrobial-resistant bacteria
Proportion of tetracycline-resistant Escherichia coli
(farms)
(Animal slaughterhouses)
2014*
45.2
2015*
39.9
39.8
Proportion of third-generation cephalosporin-resistant
Escherichia coli (farms)
(Animal slaughterhouses)
1.5
Proportion of fluoroquinolone-resistant Escherichia coli
(farms)
(Animal slaughterhouses)
4.7
2016
47.6
2017
40.8
2018
43.6
0.9
0.7
The same level as in other
G7 nations
2.4
2.1
1.1
3.8
2.7
2020 (target value**)
33% or lower
The same level as in other
G7 nations
5.0
4.0
4.7
* Prepared from [3] with partial modification.
JVARM “Results of Monitoring of Antimicrobial Resistant Bacteria Isolated from Food-producing Animals on Farms”
** Target values were quoted from [1].
References
1.
Ministerial Conference for the Control of Globally Threatening Infectious Diseases. “The National Action Plan on
AMR 2016-2020.” 2016.
2.
Muraki Y, et al. “Japanese antimicrobial consumption surveillance: first report on oral and parenteral antimicrobial
consumption in Japan (2009–2013)” J Glob Antimicrob Resist. 2016 Aug 6;7:19-23.
3.
National Veterinary Assay Laboratory, Ministry of Agriculture, Forestry and Fisheries. “Monitoring of AMR.”
https://www.maff.go.jp/nval/yakuzai/yakuzai_p3.html
11