
よむ、つかう、まなぶ。
【参考資料3】【英版R4.1.17】Nippon AMR One Health Report (NAOR) 2020 (18 ページ)
出典
| 公開元URL | https://www.mhlw.go.jp/stf/newpage_23261.html |
| 出典情報 | 国際的に脅威となる感染症対策関係閣僚会議 薬剤耐性ワンヘルス動向調査検討会(第9回 1/17)《厚生労働省》 |
ページ画像
ダウンロードした画像を利用する際は「出典情報」を明記してください。
低解像度画像をダウンロード
プレーンテキスト
資料テキストはコンピュータによる自動処理で生成されており、完全に資料と一致しない場合があります。
テキストをコピーしてご利用いただく際は資料と付け合わせてご確認ください。
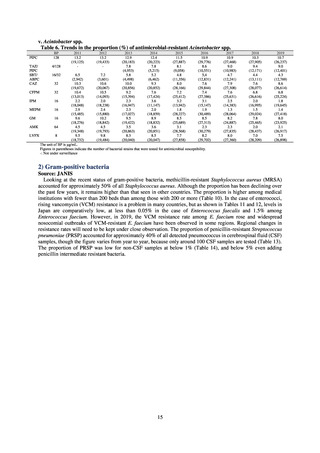
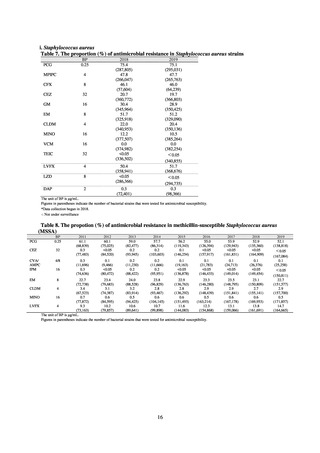
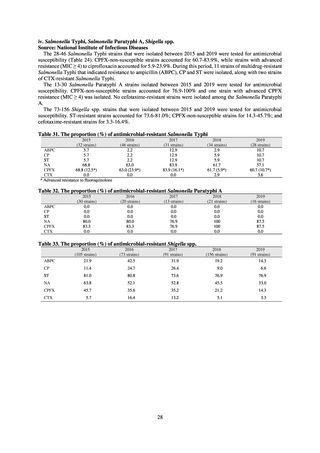
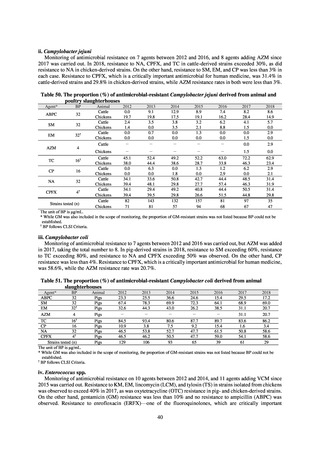
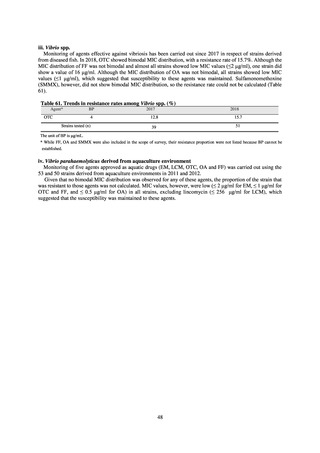
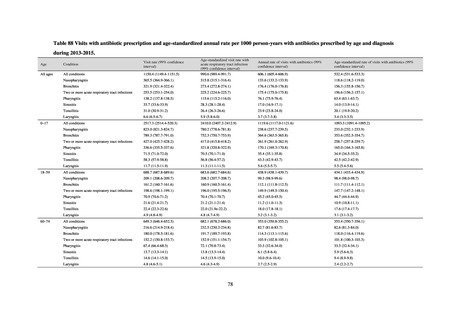
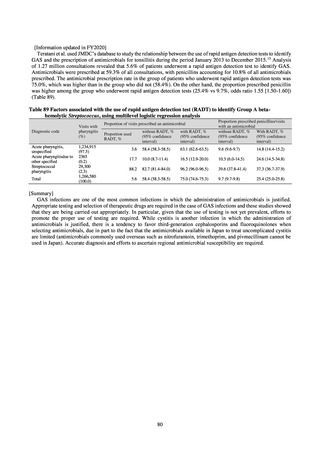
Table 9. The propotion (%) of antimicrobial resistance in methicillin-resistant Staphylococcus aureus
(MRSA)
BP
(2014-)
8
EM
CLDM
4
MINO
16
VCM
16
TEIC
32
LVFX
4
LZD*
8
DAP
2
2011
2012
2013
2014
2015
2016
2017
2018
2019
91.3
(105,936)
76.8
(102,895)
48.2
(117,325)
0.0
(115,679)
<0.05
(110,380)
90.6
(109,521)
73.5
(106,124)
43.7
(120,321)
0.0
(119,111)
<0.05
(113,887)
88.4
(108,607)
67.3
(105,503)
37.1
(120,300)
0.0
(119,441)
<0.05
(113,684)
86.0
(107,836)
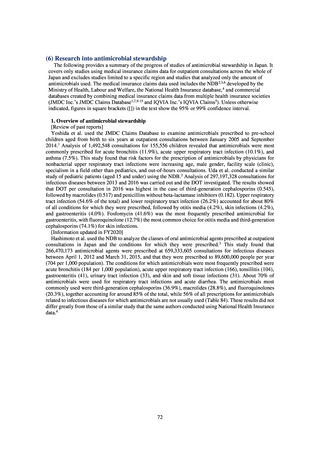
60.3
(106,910)
35.1
(121,258)
0.0
(120,535)
<0.05
(113,749)
84.1
(149,851)
56.0
(153,329)
31.7
(173,983)
0.0
(172,083)
<0.05
(158,233)
83.8
(155,587)
51.6
(160,500)
29.1
(182,306)
0.0
(181,288)
<0.05
(165,213)
82.9
(157,708)
46.3
(164,301)
27.1
(185,770)
0.0
(185,948)
<0.05
(167,342)
81.7
(159,215)
41.7
(169,049)
23.7
(189,813)
0.0
(189,853)
<0.05
(169,651)
89.0
(111,598)
0.1
(76,632)
88.3
(114,381)
<0.05
(84,550)
86.8
(114,551)
<0.05
(85,223)
85.4
(115,586)
<0.05
(88,255)
85.2
(164,734)
0.1
(127,278)
85.8
(172,494)
<0.05
(136,468)
86.5
(176,790)
<0.05
(139,785)
86.8
(179,731)
<0.05
(144,332)
-
-
-
1.1
(3,078)
0.9
(16,648)
0,8
(23,217)
0.7
(26,874)
0.5
(35,618)
80.7
(161,613)
37.9
(175,081)
20.1
(195,422)
0.0
(195,332)
<0.05
(173,090)
87.8
(186,442)
<0.05
(149,340)
0.4
(47,835)
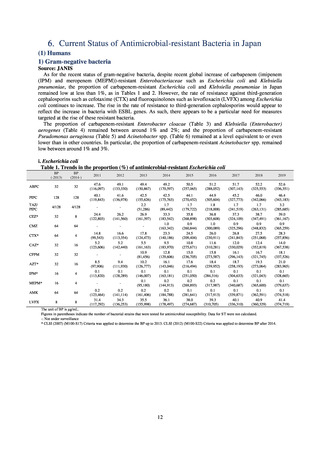
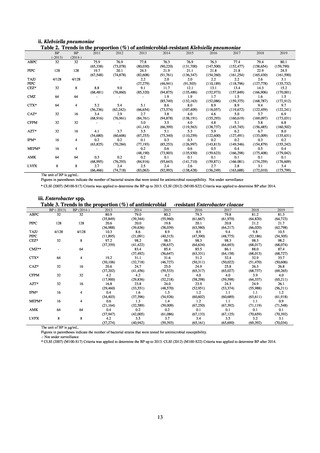
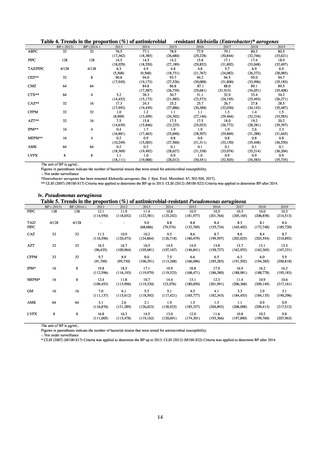
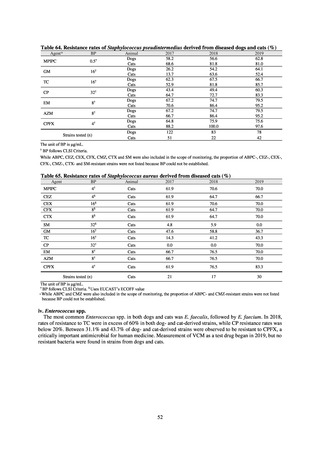
The unit of BP is μg/mL.
Figures in parentheses indicate the number of bacterial strains that were tested for antimicrobial susceptibility.
-: Not under surveillance
As of 2019, no vancomycin-resistant staphylococcus aureus strains had been reported.
* CLSI (2007) (M100-S17) Criteria was applied to determine the BP up to 2013. CLSI (2012) (M100-S22) Criteria was applied to determine BP after 2014.
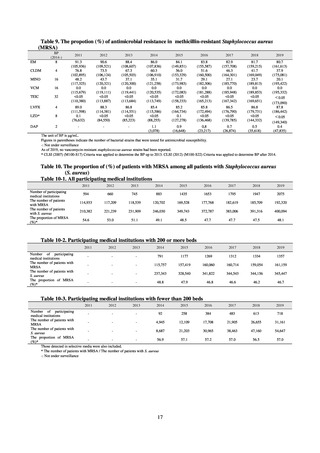
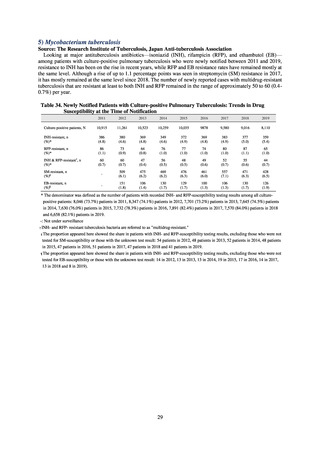
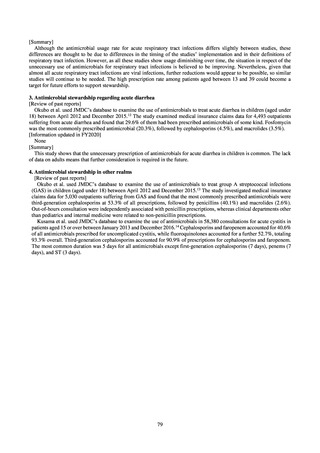
Table 10. The proportion of (%) of patients with MRSA among all patients with Staphylococcus aureus
(S. aureus)
Table 10-1. All participating medical institutions
Number of participating
medical institutions
The number of patients
with MRSA
The number of patients
with S. aureus
The proportion of MRSA
(%)*
2011
2012
2013
2014
2015
2016
2017
2018
2019
594
660
745
883
1435
1653
1795
1947
2075
114,933
117,209
118,539
120,702
169,528
177,768
182,619
185,709
192,320
210,382
221,239
231,909
246,030
349,743
372,787
383,006
391,316
400,094
54.6
53.0
51.1
49.1
48.5
47.7
47.7
47.5
48.1
Table 10-2. Participating medical institutions with 200 or more beds
Number of participating
medical institutions
The number of patients with
MRSA
The number of patients with
S. aureus
The proportion of MRSA
(%)*
2011
2012
2013
2014
2015
2016
2017
2018
2019
-
-
-
791
1177
1269
1312
1334
1357
-
-
-
115,757
157,419
160,060
160,714
159,054
161,159
-
-
-
237,343
328,540
341,822
344,543
344,156
345,447
-
-
-
48.8
47.9
46.6
46.2
46.7
46.8
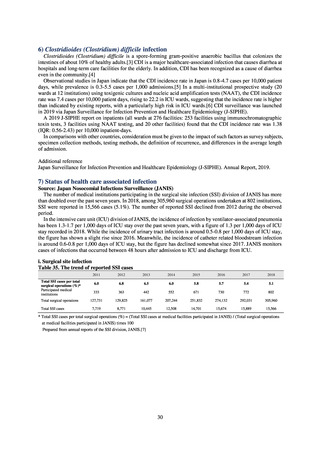
Table 10-3. Participating medical institutions with fewer than 200 beds
2011
2012
2013
2014
Number of participating
92
medical institutions
The number of patients with
4,945
MRSA
The number of patients with
8,687
S. aureus
The proportion of MRSA
56.9
(%)*
Those detected in selective media were also included.
* The number of patients with MRSA / The number of patients with S. aureus
-: Not under surveillance
17
2015
2016
2017
2018
2019
258
384
483
613
718
12,109
17,708
21,905
26,655
31,161
21,203
30,965
38,463
47,160
54,647
57.1
57.2
57.0
56.5
57.0
(MRSA)
BP
(2014-)
8
EM
CLDM
4
MINO
16
VCM
16
TEIC
32
LVFX
4
LZD*
8
DAP
2
2011
2012
2013
2014
2015
2016
2017
2018
2019
91.3
(105,936)
76.8
(102,895)
48.2
(117,325)
0.0
(115,679)
<0.05
(110,380)
90.6
(109,521)
73.5
(106,124)
43.7
(120,321)
0.0
(119,111)
<0.05
(113,887)
88.4
(108,607)
67.3
(105,503)
37.1
(120,300)
0.0
(119,441)
<0.05
(113,684)
86.0
(107,836)
60.3
(106,910)
35.1
(121,258)
0.0
(120,535)
<0.05
(113,749)
84.1
(149,851)
56.0
(153,329)
31.7
(173,983)
0.0
(172,083)
<0.05
(158,233)
83.8
(155,587)
51.6
(160,500)
29.1
(182,306)
0.0
(181,288)
<0.05
(165,213)
82.9
(157,708)
46.3
(164,301)
27.1
(185,770)
0.0
(185,948)
<0.05
(167,342)
81.7
(159,215)
41.7
(169,049)
23.7
(189,813)
0.0
(189,853)
<0.05
(169,651)
89.0
(111,598)
0.1
(76,632)
88.3
(114,381)
<0.05
(84,550)
86.8
(114,551)
<0.05
(85,223)
85.4
(115,586)
<0.05
(88,255)
85.2
(164,734)
0.1
(127,278)
85.8
(172,494)
<0.05
(136,468)
86.5
(176,790)
<0.05
(139,785)
86.8
(179,731)
<0.05
(144,332)
-
-
-
1.1
(3,078)
0.9
(16,648)
0,8
(23,217)
0.7
(26,874)
0.5
(35,618)
80.7
(161,613)
37.9
(175,081)
20.1
(195,422)
0.0
(195,332)
<0.05
(173,090)
87.8
(186,442)
<0.05
(149,340)
0.4
(47,835)
The unit of BP is μg/mL.
Figures in parentheses indicate the number of bacterial strains that were tested for antimicrobial susceptibility.
-: Not under surveillance
As of 2019, no vancomycin-resistant staphylococcus aureus strains had been reported.
* CLSI (2007) (M100-S17) Criteria was applied to determine the BP up to 2013. CLSI (2012) (M100-S22) Criteria was applied to determine BP after 2014.
Table 10. The proportion of (%) of patients with MRSA among all patients with Staphylococcus aureus
(S. aureus)
Table 10-1. All participating medical institutions
Number of participating
medical institutions
The number of patients
with MRSA
The number of patients
with S. aureus
The proportion of MRSA
(%)*
2011
2012
2013
2014
2015
2016
2017
2018
2019
594
660
745
883
1435
1653
1795
1947
2075
114,933
117,209
118,539
120,702
169,528
177,768
182,619
185,709
192,320
210,382
221,239
231,909
246,030
349,743
372,787
383,006
391,316
400,094
54.6
53.0
51.1
49.1
48.5
47.7
47.7
47.5
48.1
Table 10-2. Participating medical institutions with 200 or more beds
Number of participating
medical institutions
The number of patients with
MRSA
The number of patients with
S. aureus
The proportion of MRSA
(%)*
2011
2012
2013
2014
2015
2016
2017
2018
2019
-
-
-
791
1177
1269
1312
1334
1357
-
-
-
115,757
157,419
160,060
160,714
159,054
161,159
-
-
-
237,343
328,540
341,822
344,543
344,156
345,447
-
-
-
48.8
47.9
46.6
46.2
46.7
46.8
Table 10-3. Participating medical institutions with fewer than 200 beds
2011
2012
2013
2014
Number of participating
92
medical institutions
The number of patients with
4,945
MRSA
The number of patients with
8,687
S. aureus
The proportion of MRSA
56.9
(%)*
Those detected in selective media were also included.
* The number of patients with MRSA / The number of patients with S. aureus
-: Not under surveillance
17
2015
2016
2017
2018
2019
258
384
483
613
718
12,109
17,708
21,905
26,655
31,161
21,203
30,965
38,463
47,160
54,647
57.1
57.2
57.0
56.5
57.0