
よむ、つかう、まなぶ。
【参考資料3】【英版R4.1.17】Nippon AMR One Health Report (NAOR) 2020 (48 ページ)
出典
| 公開元URL | https://www.mhlw.go.jp/stf/newpage_23261.html |
| 出典情報 | 国際的に脅威となる感染症対策関係閣僚会議 薬剤耐性ワンヘルス動向調査検討会(第9回 1/17)《厚生労働省》 |
ページ画像
ダウンロードした画像を利用する際は「出典情報」を明記してください。
低解像度画像をダウンロード
プレーンテキスト
資料テキストはコンピュータによる自動処理で生成されており、完全に資料と一致しない場合があります。
テキストをコピーしてご利用いただく際は資料と付け合わせてご確認ください。
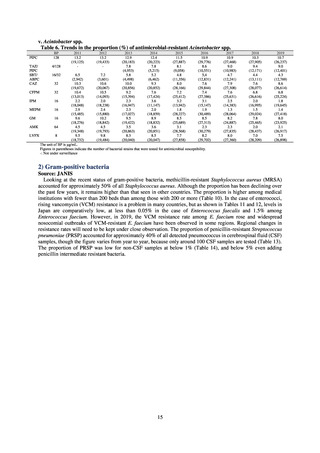
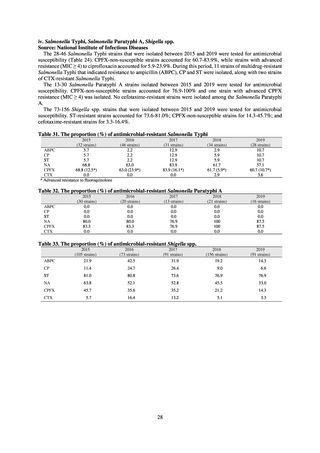
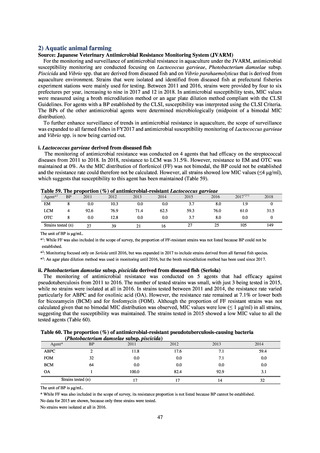
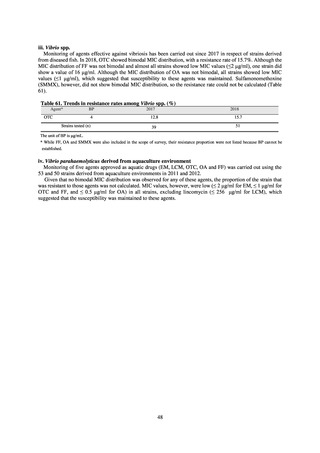
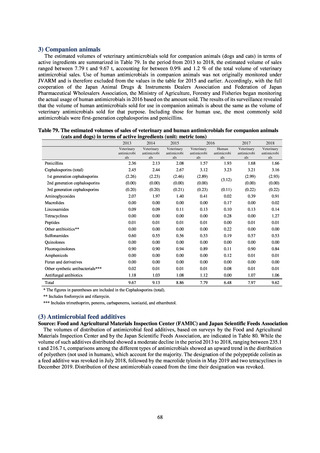
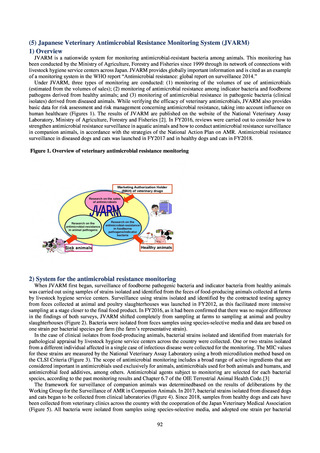
2) Aquatic animal farming
Source: Japanese Veterinary Antimicrobial Resistance Monitoring System (JVARM)
For the monitoring and surveillance of antimicrobial resistance in aquaculture under the JVARM, antimicrobial
susceptibility monitoring are conducted focusing on Lactococcus garvieae, Photobacterium damselae subsp.
Piscicida and Vibrio spp. that are derived from diseased fish and on Vibrio parahaemolyticus that is derived from
aquaculture environment. Strains that were isolated and identified from diseased fish at prefectural fisheries
experiment stations were mainly used for testing. Between 2011 and 2016, strains were provided by four to six
prefectures per year, increasing to nine in 2017 and 12 in 2018. In antimicrobial susceptibility tests, MIC values
were measured using a broth microdilution method or an agar plate dilution method compliant with the CLSI
Guidelines. For agents with a BP established by the CLSI, susceptibility was interpreted using the CLSI Criteria.
The BPs of the other antimicrobial agents were determined microbiologically (midpoint of a bimodal MIC
distribution).
To further enhance surveillance of trends in antimicrobial resistance in aquaculture, the scope of surveillance
was expanded to all farmed fishes in FY2017 and antimicrobial susceptibility monitoring of Lactococcus garvieae
and Vibrio spp. is now being carried out.
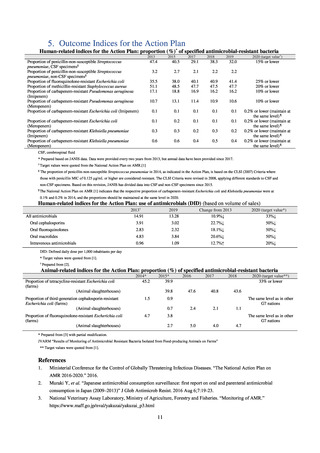
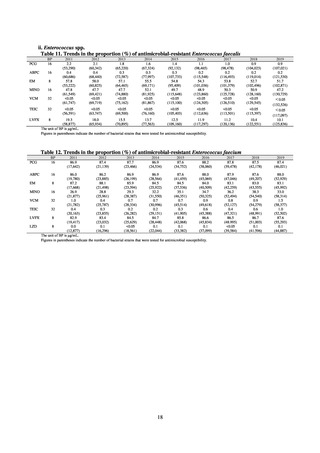
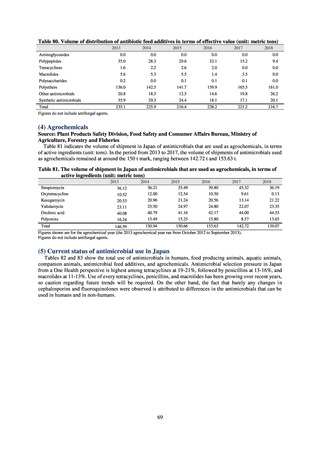
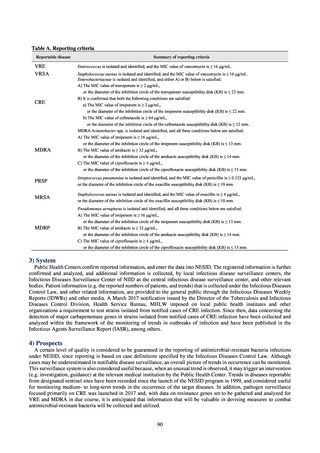
i. Lactococcus garvieae derived from diseased fish
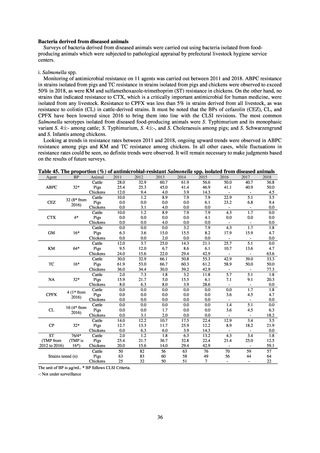
The monitoring of antimicrobial resistance was conducted on 4 agents that had efficacy on the streptococcal
diseases from 2011 to 2018. In 2018, resistance to LCM was 31.5%. However, resistance to EM and OTC was
maintained at 0%. As the MIC distribution of florfenicol (FF) was not bimodal, the BP could not be established
and the resistance rate could therefore not be calculated. However, all strains showed low MIC values (≤4 μg/ml),
which suggests that susceptibility to this agent has been maintained (Table 59).
Table 59. The proportion (%) of antimicrobial-resistant Lactococcus garvieae
Agent*1
BP
2011
2012
2013
2014
2015
2016
2017*2*3
2018
EM
8
0.0
10.3
0.0
0.0
3.7
8.0
1.9
0
LCM
4
92.6
76.9
71.4
62.5
59.3
76.0
61.0
31.5
OTC
8
0.0
12.8
0.0
0.0
3.7
8.0
0.0
0
27
39
21
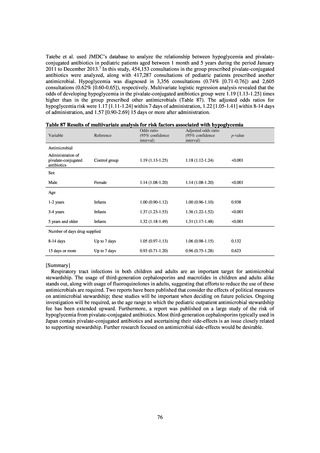
16
27
25
105
149
Strains tested (n)
The unit of BP is μg/mL.
*1: While FF was also included in the scope of survey, the proportion of FF-resistant strains was not listed because BP could not be
established.
*2: Monitoring focused only on Seriola until 2016, but was expanded in 2017 to include strains derived from all farmed fish species.
*3: An agar plate dilution method was used in monitoring until 2016, but the broth microdilution method has been used since 2017.
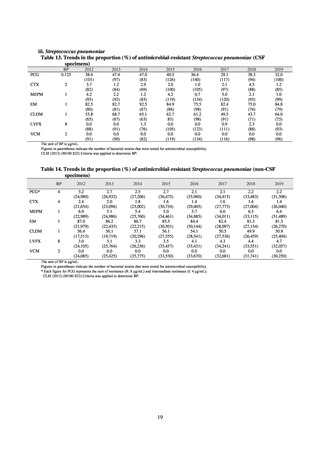
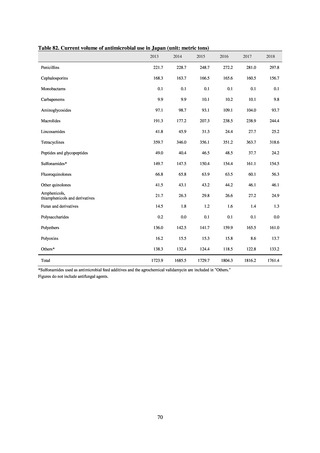
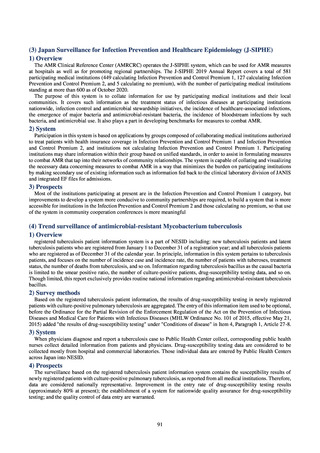
ii. Photobacterium damselae subsp. piscicida derived from diseased fish (Seriola)
The monitoring of antimicrobial resistance was conducted on 5 agents that had efficacy against
pseudotuberculosis from 2011 to 2016. The number of tested strains was small, with just 3 being tested in 2015,
while no strains were isolated at all in 2016. In strains tested between 2011 and 2014, the resistance rate varied
particularly for ABPC and for oxolinic acid (OA). However, the resistance rate remained at 7.1% or lower both
for bicozamycin (BCM) and for fosfomycin (FOM). Although the proportion of FF resistant strains was not
calculated given that no bimodal MIC distribution was observed, MIC values were low (≤ 1 μg/ml) in all strains,
suggesting that the susceptibility was maintained. The strains tested in 2015 showed a low MIC value to all the
tested agents (Table 60).
Table 60. The proportion (%) of antimicrobial-resistant pseudotuberculosis-causing bacteria
(Photobacterium damselae subsp. piscicida)
Agent*
BP
2011
2012
2013
2014
ABPC
2
11.8
17.6
7.1
59.4
FOM
32
0.0
0.0
7.1
0.0
BCM
64
0.0
0.0
0.0
0.0
OA
1
100.0
82.4
92.9
3.1
17
17
14
32
Strains tested (n)
The unit of BP is μg/mL.
* While FF was also included in the scope of survey, its resistance proportion is not listed because BP cannot be established.
No data for 2015 are shown, because only three strains were tested.
No strains were isolated at all in 2016.
47
Source: Japanese Veterinary Antimicrobial Resistance Monitoring System (JVARM)
For the monitoring and surveillance of antimicrobial resistance in aquaculture under the JVARM, antimicrobial
susceptibility monitoring are conducted focusing on Lactococcus garvieae, Photobacterium damselae subsp.
Piscicida and Vibrio spp. that are derived from diseased fish and on Vibrio parahaemolyticus that is derived from
aquaculture environment. Strains that were isolated and identified from diseased fish at prefectural fisheries
experiment stations were mainly used for testing. Between 2011 and 2016, strains were provided by four to six
prefectures per year, increasing to nine in 2017 and 12 in 2018. In antimicrobial susceptibility tests, MIC values
were measured using a broth microdilution method or an agar plate dilution method compliant with the CLSI
Guidelines. For agents with a BP established by the CLSI, susceptibility was interpreted using the CLSI Criteria.
The BPs of the other antimicrobial agents were determined microbiologically (midpoint of a bimodal MIC
distribution).
To further enhance surveillance of trends in antimicrobial resistance in aquaculture, the scope of surveillance
was expanded to all farmed fishes in FY2017 and antimicrobial susceptibility monitoring of Lactococcus garvieae
and Vibrio spp. is now being carried out.
i. Lactococcus garvieae derived from diseased fish
The monitoring of antimicrobial resistance was conducted on 4 agents that had efficacy on the streptococcal
diseases from 2011 to 2018. In 2018, resistance to LCM was 31.5%. However, resistance to EM and OTC was
maintained at 0%. As the MIC distribution of florfenicol (FF) was not bimodal, the BP could not be established
and the resistance rate could therefore not be calculated. However, all strains showed low MIC values (≤4 μg/ml),
which suggests that susceptibility to this agent has been maintained (Table 59).
Table 59. The proportion (%) of antimicrobial-resistant Lactococcus garvieae
Agent*1
BP
2011
2012
2013
2014
2015
2016
2017*2*3
2018
EM
8
0.0
10.3
0.0
0.0
3.7
8.0
1.9
0
LCM
4
92.6
76.9
71.4
62.5
59.3
76.0
61.0
31.5
OTC
8
0.0
12.8
0.0
0.0
3.7
8.0
0.0
0
27
39
21
16
27
25
105
149
Strains tested (n)
The unit of BP is μg/mL.
*1: While FF was also included in the scope of survey, the proportion of FF-resistant strains was not listed because BP could not be
established.
*2: Monitoring focused only on Seriola until 2016, but was expanded in 2017 to include strains derived from all farmed fish species.
*3: An agar plate dilution method was used in monitoring until 2016, but the broth microdilution method has been used since 2017.
ii. Photobacterium damselae subsp. piscicida derived from diseased fish (Seriola)
The monitoring of antimicrobial resistance was conducted on 5 agents that had efficacy against
pseudotuberculosis from 2011 to 2016. The number of tested strains was small, with just 3 being tested in 2015,
while no strains were isolated at all in 2016. In strains tested between 2011 and 2014, the resistance rate varied
particularly for ABPC and for oxolinic acid (OA). However, the resistance rate remained at 7.1% or lower both
for bicozamycin (BCM) and for fosfomycin (FOM). Although the proportion of FF resistant strains was not
calculated given that no bimodal MIC distribution was observed, MIC values were low (≤ 1 μg/ml) in all strains,
suggesting that the susceptibility was maintained. The strains tested in 2015 showed a low MIC value to all the
tested agents (Table 60).
Table 60. The proportion (%) of antimicrobial-resistant pseudotuberculosis-causing bacteria
(Photobacterium damselae subsp. piscicida)
Agent*
BP
2011
2012
2013
2014
ABPC
2
11.8
17.6
7.1
59.4
FOM
32
0.0
0.0
7.1
0.0
BCM
64
0.0
0.0
0.0
0.0
OA
1
100.0
82.4
92.9
3.1
17
17
14
32
Strains tested (n)
The unit of BP is μg/mL.
* While FF was also included in the scope of survey, its resistance proportion is not listed because BP cannot be established.
No data for 2015 are shown, because only three strains were tested.
No strains were isolated at all in 2016.
47