
よむ、つかう、まなぶ。
【参考資料3】【英版R4.1.17】Nippon AMR One Health Report (NAOR) 2020 (40 ページ)
出典
| 公開元URL | https://www.mhlw.go.jp/stf/newpage_23261.html |
| 出典情報 | 国際的に脅威となる感染症対策関係閣僚会議 薬剤耐性ワンヘルス動向調査検討会(第9回 1/17)《厚生労働省》 |
ページ画像
ダウンロードした画像を利用する際は「出典情報」を明記してください。
低解像度画像をダウンロード
プレーンテキスト
資料テキストはコンピュータによる自動処理で生成されており、完全に資料と一致しない場合があります。
テキストをコピーしてご利用いただく際は資料と付け合わせてご確認ください。
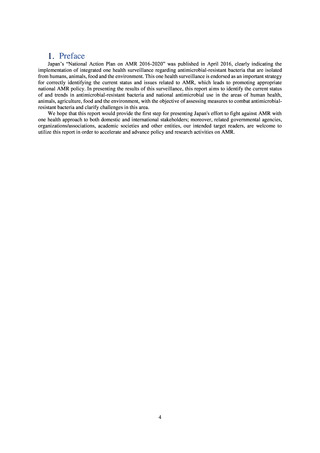
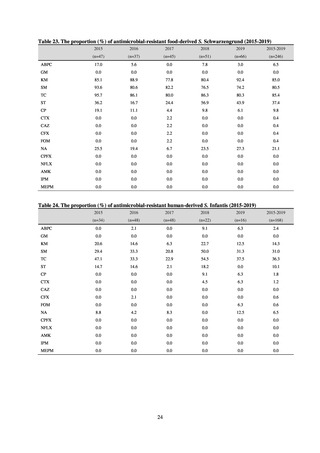
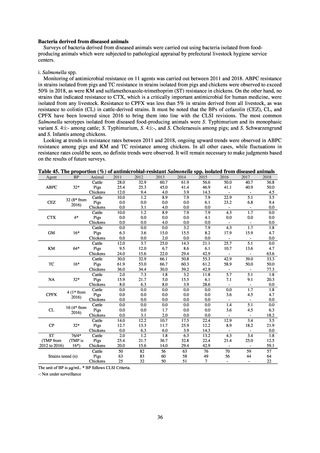
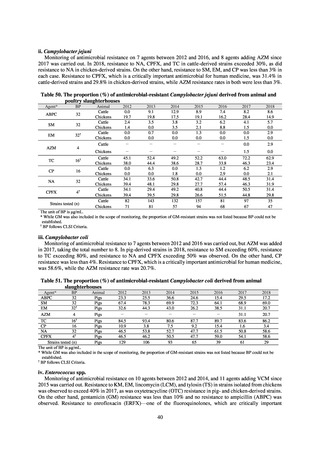
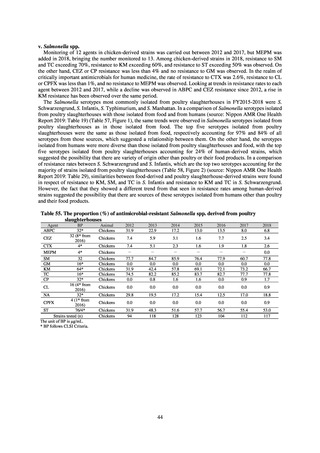
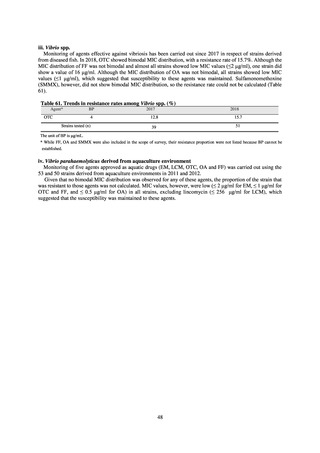
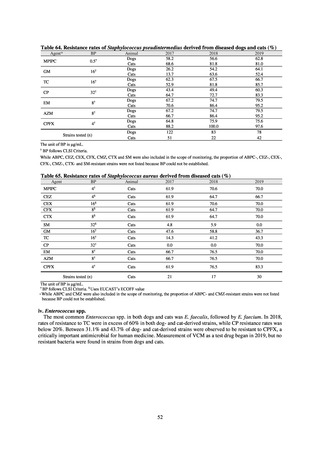
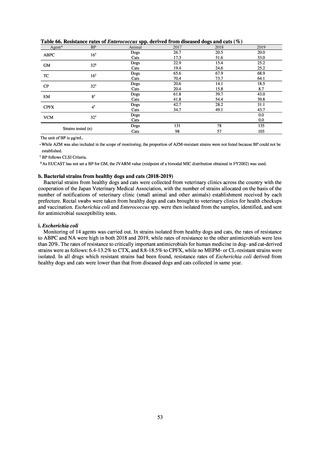
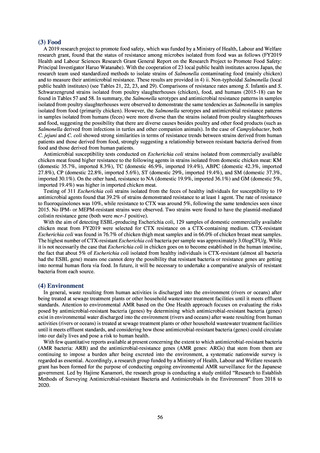
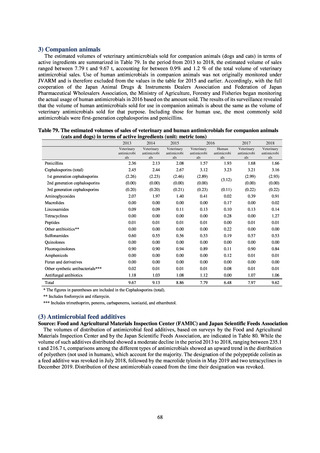
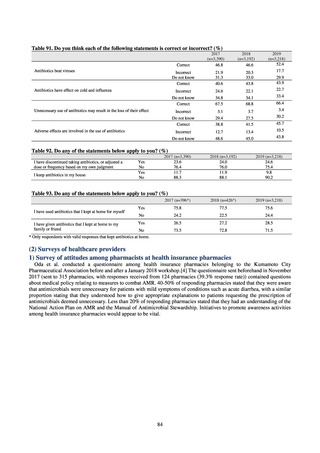
Bacteria derived from healthy food-producing animals
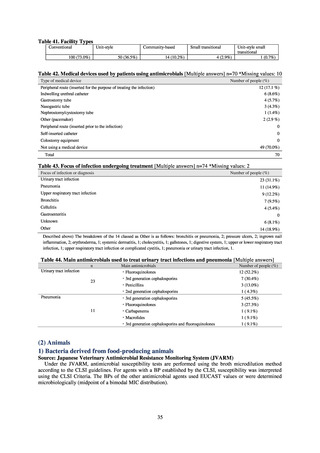
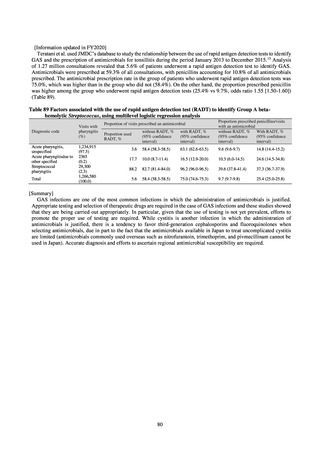
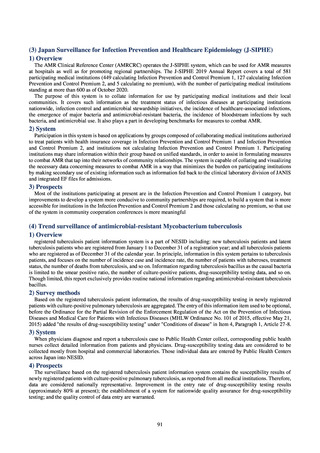
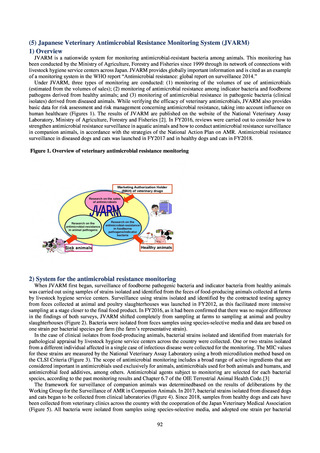
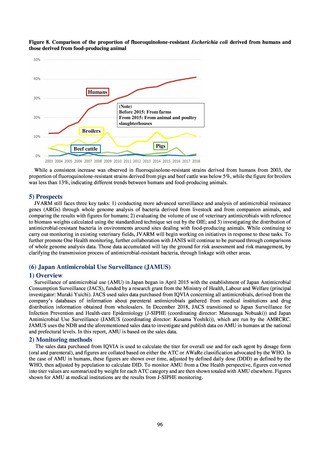
Surveillance of food-borne pathogenic bacteria and indicator bacteria from healthy food-producing animals was
carried out using samples of feces collected at animal and poultry slaughterhouses. When JVARM first began,
surveillance was carried out using samples of feces from food-producing animals collected at farms by livestock
hygiene service centers. Surveillance at animal and poultry slaughterhouses was added in FY2012, as this
facilitated more intensive sampling at a stage closer to the final food product. In FY2016, there was confirmed to
be no major difference in the findings of both surveys, so JVARM shifted to surveillance at animal and poultry
slaughterhouses for bacteria derived from healthy food-producing animals.
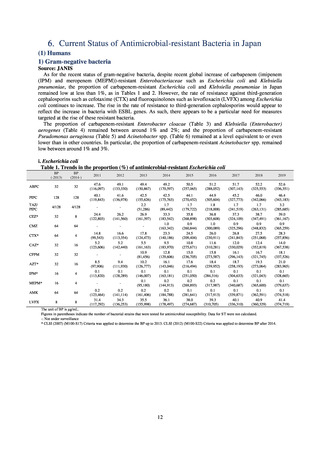
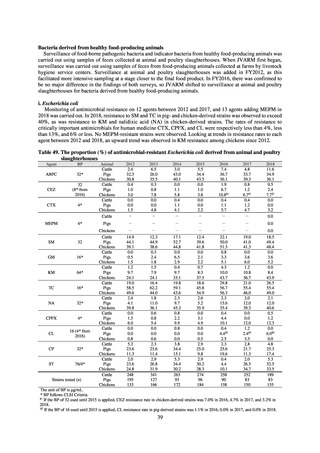
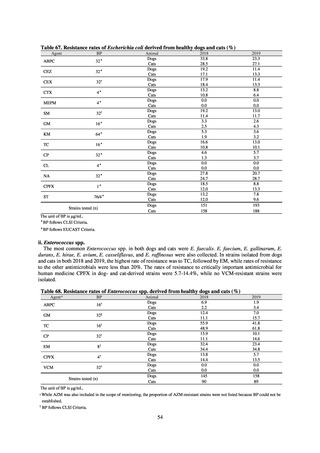
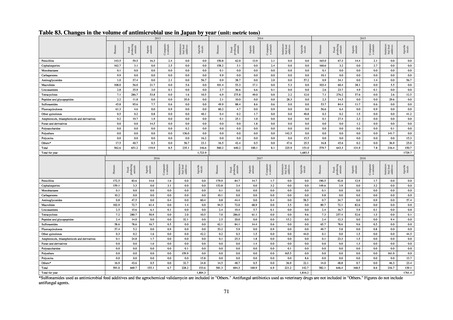
ⅰ. Escherichia coli
Monitoring of antimicrobial resistance on 12 agents between 2012 and 2017, and 13 agents adding MEPM in
2018 was carried out. In 2018, resistance to SM and TC in pig- and chicken-derived strains was observed to exceed
40%, as was resistance to KM and nalidixic acid (NA) in chicken-derived strains. The rates of resistance to
critically important antimicrobials for human medicine CTX, CPFX, and CL were respectively less than 4%, less
than 13%, and 6% or less. No MEPM-resistant strains were observed. Looking at trends in resistance rates to each
agent between 2012 and 2018, an upward trend was observed in KM resistance among chickens since 2012.
Table 49. The proportion (%) of antimicrobial-resistant Escherichia coli derived from animal and poultry
slaughterhouses
Agent
BP
ABPC
32*
CEZ
32
(8* from
2016)
CTX
4*
MEPM
4*
SM
32
GM
16*
KM
64*
TC
16*
NA
32*
CPFX
4*
CL
16 (4* from
2016)
CP
32*
ST
76/4*
Strains tested (n)
Animal
Cattle
Pigs
Chickens
Cattle
Pigs
Chickens
Cattle
Pigs
Chickens
Cattle
2012
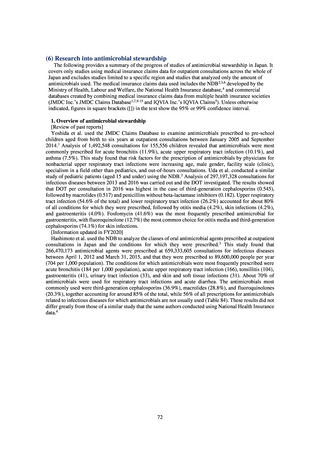
2.4
32.3
30.8
0.4
1.0
3.0
0.0
0.0
1.5
-
2013
6.5
26.0
35.5
0.3
0.8
7.8
0.0
0.0
4.8
-
2014
3.0
43.0
40.1
0.0
1.1
5.8
0.4
1.1
4.1
-
2015
5.5
34.4
43.5
0.0
1.0
3.8
0.0
0.0
2.2
-
2016
7.4
36.7
36.1
1.9
6.7
10.8§1
0.4
1.1
5.7
-
2017
4.8
33.7
39.3
0.8
1.2
6.7§1
0.4
1.2
4.7
-
2018
11.6
34.9
36.1
0.5
2.4
7.7§1
0.0
0.0
3.2
0.0
Pigs
-
-
-
-
-
-
0.0
Chickens
Cattle
Pigs
Chickens
Cattle
Pigs
Chickens
Cattle
Pigs
Chickens
Cattle
Pigs
Chickens
Cattle
Pigs
Chickens
Cattle
Pigs
Chickens
Cattle
Pigs
Chickens
Cattle
Pigs
Chickens
Cattle
Pigs
Chickens
Cattle
Pigs
Chickens
-
14.9
44.1
39.1
0.0
0.5
1.5
1.2
9.7
24.1
19.0
58.5
49.6
2.4
4.1
39.8
0.0
1.5
6.0
0.0
0.0
0.8
5.2
23.6
11.3
2.0
23.6
24.8
248
195
133
-
12.3
44.9
38.6
0.3
2.4
1.8
1.5
7.9
24.1
16.4
62.2
44.0
1.8
11.0
36.1
0.6
0.8
5.4
0.0
0.0
0.6
2.3
23.6
11.4
2.9
26.8
31.9
341
127
166
-
17.1
52.7
44.8
0.0
6.5
2.9
0.4
9.7
33.1
19.8
59.1
43.6
2.3
9.7
45.3
0.8
2.2
9.9
0.8
0.0
0.0
3.8
34.4
15.1
5.3
34.4
30.2
263
93
172
-
12.4
39.6
41.8
0.0
2.1
2.2
0.7
8.3
37.5
18.6
45.8
54.9
2.6
5.2
35.9
0.0
3.1
4.9
0.0
0.0
0.5
2.9
25.0
9.8
2.9
30.2
28.3
274
96
184
-
22.1
50.0
51.3
0.8
3.3
5.1
4.3
10.0
43.7
29.8
56.7
56.3
2.3
15.6
35.4
0.4
4.4
10.1
0.4
4.4§2
2.5
2.3
25.6
19.6
0.4
4.4
10.1
258
90
158
-
19.0
41.0
41.3
0.0
3.6
6.0
1.2
10.8
36.7
21.0
55.4
46.0
2.0
12.0
39.3
0.0
0.0
12.0
1.2
2.4§2
3.3
2.8
21.7
11.3
2.0
26.5
34.7
252
83
150
0.0
18.5
49.4
48.4
0.0
3.6
5.2
0.0
8.4
43.9
26.5
55.4
49.0
2.1
12.0
40.6
0.5
1.2
12.3
0.0
6.0§2
0.0
4.8
25.3
17.4
5.3
32.5
33.5
189
83
155
The unit of BP is μg/mL.
* BP follows CLSI Criteria.
§1
If the BP of 32 used until 2015 is applied, CEZ resistance rate in chicken-derived strains was 7.0% in 2016, 4.7% in 2017, and 3.2% in
2018.
§2
If the BP of 16 used until 2015 is applied, CL resistance rate in pig-derived strains was 1.1% in 2016, 0.0% in 2017, and 0.0% in 2018.
39
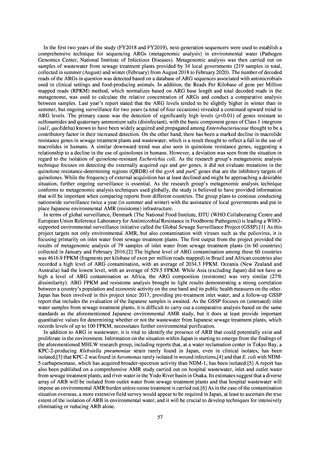
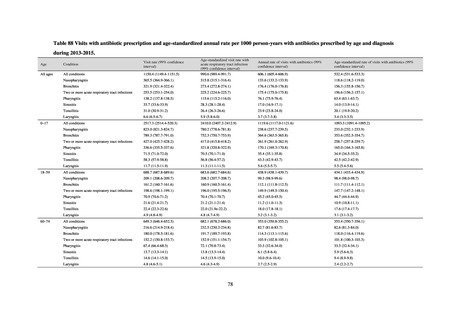
Surveillance of food-borne pathogenic bacteria and indicator bacteria from healthy food-producing animals was
carried out using samples of feces collected at animal and poultry slaughterhouses. When JVARM first began,
surveillance was carried out using samples of feces from food-producing animals collected at farms by livestock
hygiene service centers. Surveillance at animal and poultry slaughterhouses was added in FY2012, as this
facilitated more intensive sampling at a stage closer to the final food product. In FY2016, there was confirmed to
be no major difference in the findings of both surveys, so JVARM shifted to surveillance at animal and poultry
slaughterhouses for bacteria derived from healthy food-producing animals.
ⅰ. Escherichia coli
Monitoring of antimicrobial resistance on 12 agents between 2012 and 2017, and 13 agents adding MEPM in
2018 was carried out. In 2018, resistance to SM and TC in pig- and chicken-derived strains was observed to exceed
40%, as was resistance to KM and nalidixic acid (NA) in chicken-derived strains. The rates of resistance to
critically important antimicrobials for human medicine CTX, CPFX, and CL were respectively less than 4%, less
than 13%, and 6% or less. No MEPM-resistant strains were observed. Looking at trends in resistance rates to each
agent between 2012 and 2018, an upward trend was observed in KM resistance among chickens since 2012.
Table 49. The proportion (%) of antimicrobial-resistant Escherichia coli derived from animal and poultry
slaughterhouses
Agent
BP
ABPC
32*
CEZ
32
(8* from
2016)
CTX
4*
MEPM
4*
SM
32
GM
16*
KM
64*
TC
16*
NA
32*
CPFX
4*
CL
16 (4* from
2016)
CP
32*
ST
76/4*
Strains tested (n)
Animal
Cattle
Pigs
Chickens
Cattle
Pigs
Chickens
Cattle
Pigs
Chickens
Cattle
2012
2.4
32.3
30.8
0.4
1.0
3.0
0.0
0.0
1.5
-
2013
6.5
26.0
35.5
0.3
0.8
7.8
0.0
0.0
4.8
-
2014
3.0
43.0
40.1
0.0
1.1
5.8
0.4
1.1
4.1
-
2015
5.5
34.4
43.5
0.0
1.0
3.8
0.0
0.0
2.2
-
2016
7.4
36.7
36.1
1.9
6.7
10.8§1
0.4
1.1
5.7
-
2017
4.8
33.7
39.3
0.8
1.2
6.7§1
0.4
1.2
4.7
-
2018
11.6
34.9
36.1
0.5
2.4
7.7§1
0.0
0.0
3.2
0.0
Pigs
-
-
-
-
-
-
0.0
Chickens
Cattle
Pigs
Chickens
Cattle
Pigs
Chickens
Cattle
Pigs
Chickens
Cattle
Pigs
Chickens
Cattle
Pigs
Chickens
Cattle
Pigs
Chickens
Cattle
Pigs
Chickens
Cattle
Pigs
Chickens
Cattle
Pigs
Chickens
Cattle
Pigs
Chickens
-
14.9
44.1
39.1
0.0
0.5
1.5
1.2
9.7
24.1
19.0
58.5
49.6
2.4
4.1
39.8
0.0
1.5
6.0
0.0
0.0
0.8
5.2
23.6
11.3
2.0
23.6
24.8
248
195
133
-
12.3
44.9
38.6
0.3
2.4
1.8
1.5
7.9
24.1
16.4
62.2
44.0
1.8
11.0
36.1
0.6
0.8
5.4
0.0
0.0
0.6
2.3
23.6
11.4
2.9
26.8
31.9
341
127
166
-
17.1
52.7
44.8
0.0
6.5
2.9
0.4
9.7
33.1
19.8
59.1
43.6
2.3
9.7
45.3
0.8
2.2
9.9
0.8
0.0
0.0
3.8
34.4
15.1
5.3
34.4
30.2
263
93
172
-
12.4
39.6
41.8
0.0
2.1
2.2
0.7
8.3
37.5
18.6
45.8
54.9
2.6
5.2
35.9
0.0
3.1
4.9
0.0
0.0
0.5
2.9
25.0
9.8
2.9
30.2
28.3
274
96
184
-
22.1
50.0
51.3
0.8
3.3
5.1
4.3
10.0
43.7
29.8
56.7
56.3
2.3
15.6
35.4
0.4
4.4
10.1
0.4
4.4§2
2.5
2.3
25.6
19.6
0.4
4.4
10.1
258
90
158
-
19.0
41.0
41.3
0.0
3.6
6.0
1.2
10.8
36.7
21.0
55.4
46.0
2.0
12.0
39.3
0.0
0.0
12.0
1.2
2.4§2
3.3
2.8
21.7
11.3
2.0
26.5
34.7
252
83
150
0.0
18.5
49.4
48.4
0.0
3.6
5.2
0.0
8.4
43.9
26.5
55.4
49.0
2.1
12.0
40.6
0.5
1.2
12.3
0.0
6.0§2
0.0
4.8
25.3
17.4
5.3
32.5
33.5
189
83
155
The unit of BP is μg/mL.
* BP follows CLSI Criteria.
§1
If the BP of 32 used until 2015 is applied, CEZ resistance rate in chicken-derived strains was 7.0% in 2016, 4.7% in 2017, and 3.2% in
2018.
§2
If the BP of 16 used until 2015 is applied, CL resistance rate in pig-derived strains was 1.1% in 2016, 0.0% in 2017, and 0.0% in 2018.
39