
よむ、つかう、まなぶ。
【参考資料3】【英版R4.1.17】Nippon AMR One Health Report (NAOR) 2020 (66 ページ)
出典
| 公開元URL | https://www.mhlw.go.jp/stf/newpage_23261.html |
| 出典情報 | 国際的に脅威となる感染症対策関係閣僚会議 薬剤耐性ワンヘルス動向調査検討会(第9回 1/17)《厚生労働省》 |
ページ画像
ダウンロードした画像を利用する際は「出典情報」を明記してください。
低解像度画像をダウンロード
プレーンテキスト
資料テキストはコンピュータによる自動処理で生成されており、完全に資料と一致しない場合があります。
テキストをコピーしてご利用いただく際は資料と付け合わせてご確認ください。
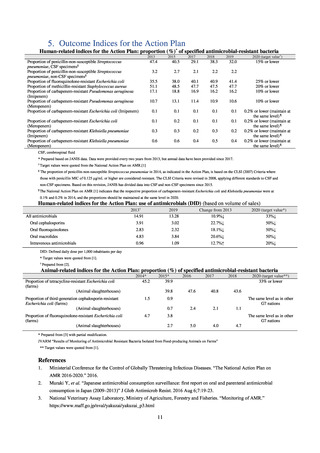
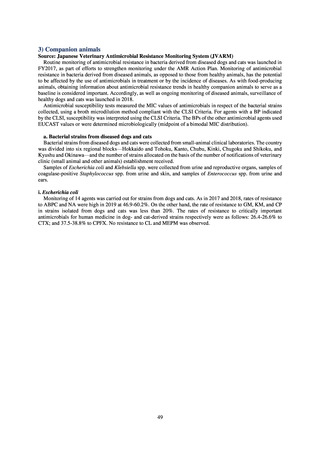
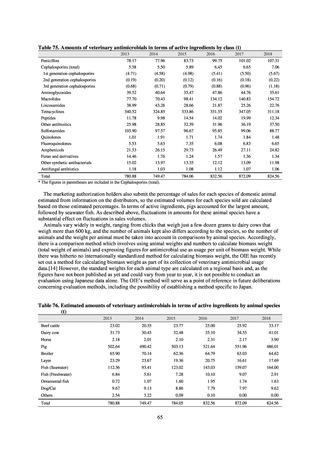
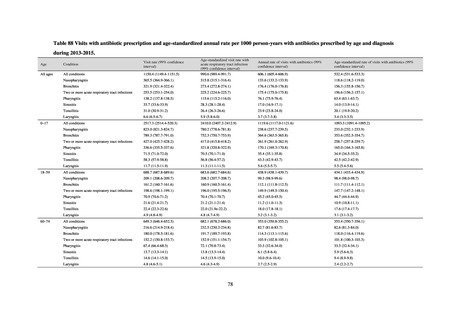
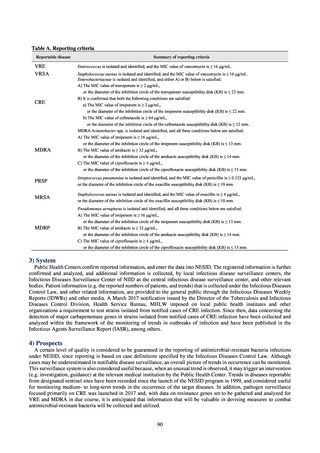
Table 75. Amounts of veterinary antimicrobials in terms of active ingredients by class (t)
2013
Penicillins
Cephalosporins (total)
1st generation cephalosporins
2nd generation cephalosporins
3rd generation cephalosporins
Aminoglycosides
Macrolides
Lincosamides
Tetracyclines
Peptides
Other antibioitics
Sulfonamides
Quinolones
Fluoroquinolones
Amphenicols
Furan and derivatives
Other synthetic antibacterials
Antifungal antibiotics
2014
78.17
5.58
(4.71)
(0.19)
(0.68)
39.52
77.70
38.99
340.52
11.78
25.98
103.90
1.01
5.53
21.53
14.46
15.02
1.18
2015
2016
2017
2018
77.96
5.50
(4.58)
(0.20)
(0.71)
40.64
70.43
43.26
324.85
9.98
28.85
97.57
1.91
5.63
26.15
1.76
13.97
1.03
83.73
5.89
(4.98)
(0.12)
(0.79)
35.47
98.41
28.66
333.86
14.54
32.39
96.67
1.71
7.35
29.73
1.24
13.35
1.08
99.75
6.45
(5.41)
(0.16)
(0.88)
47.86
134.12
21.87
331.55
14.02
31.96
95.85
1.74
6.08
26.49
1.57
12.12
1.12
101.02
6.65
(5.50)
(0.18)
(0.96)
44.76
140.83
25.26
347.05
19.99
36.19
99.06
1.84
6.83
27.11
1.36
13.09
1.07
107.31
7.06
(5.67)
(0.22)
(1.18)
35.61
154.72
22.76
311.18
12.34
37.50
88.77
1.48
6.65
24.82
1.34
11.98
1.06
Total
780.88
749.47
* The figures in parentheses are included in the Cephalosporins (total).
784.06
832.56
872.09
824.56
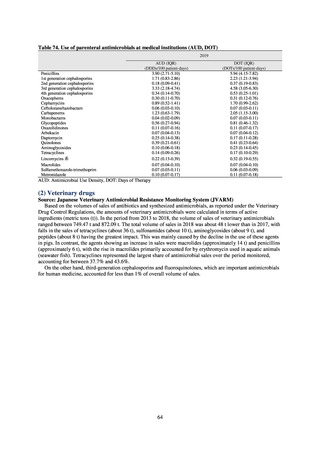
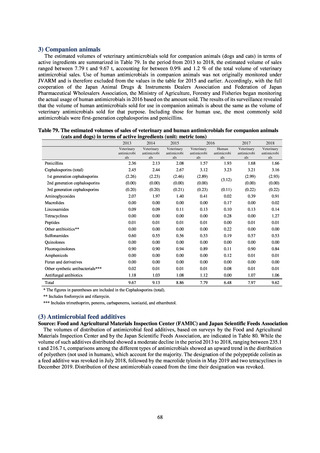
The marketing authorization holders also submit the percentage of sales for each species of domestic animal
estimated from information on the distributors, so the estimated volumes for each species sold are calculated
based on those estimated percentages. In terms of active ingredients, pigs accounted for the largest amount,
followed by seawater fish. As described above, fluctuations in amounts for these animal species have a
substantial effect on fluctuations in sales volumes.
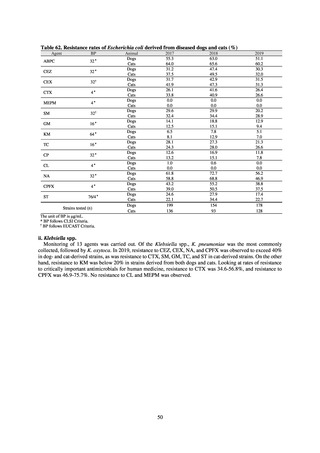
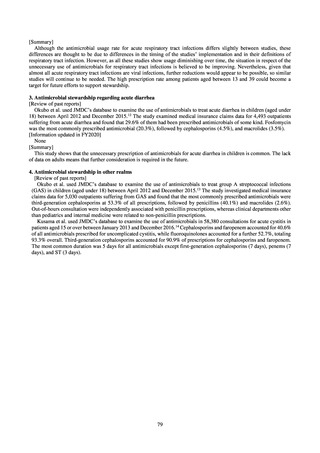
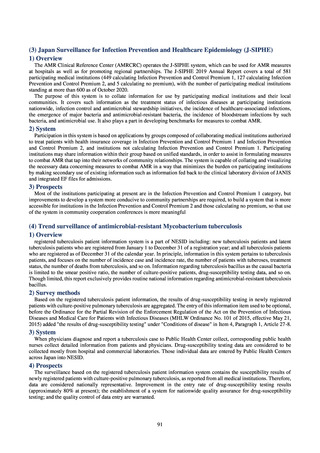
Animals vary widely in weight, ranging from chicks that weigh just a few dozen grams to dairy cows that
weigh more than 600 kg, and the number of animals kept also differs according to the species, so the number of
animals and the weight per animal must be taken into account in comparisons by animal species. Accordingly,
there is a comparison method which involves using animal weights and numbers to calculate biomass weight
(total weight of animals) and expressing figures for antimicrobial use as usage per unit of biomass weight. While
there was hitherto no internationally standardized method for calculating biomass weight, the OIE has recently
set out a method for calculating biomass weight as part of its collection of veterinary antimicrobial usage
data.[14] However, the standard weights for each animal type are calculated on a regional basis and, as the
figures have not been published as yet and could vary from year to year, it is not possible to conduct an
evaluation using Japanese data alone. The OIE’s method will serve as a point of reference in future deliberations
concerning evaluation methods, including the possibility of establishing a method specific to Japan.
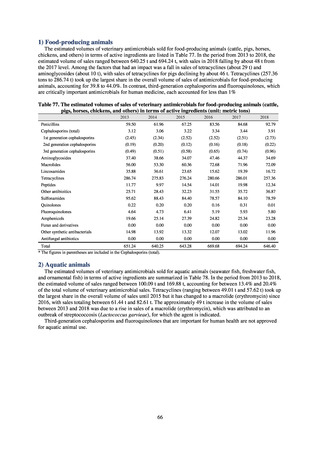
Table 76. Estimated amounts of veterinary antimicrobials in terms of active ingredients by animal species
(t)
2013
2014
2015
2016
2017
2018
Beef cattle
23.02
20.35
23.77
25.00
25.92
33.17
Dairy cow
31.73
30.45
32.48
35.10
34.55
41.01
2.18
2.01
2.10
2.31
2.17
3.90
502.64
490.42
503.13
521.64
551.96
486.01
65.90
70.14
62.36
64.79
63.03
64.62
Horse
Pig
Broiler
Layer
23.29
23.67
19.36
20.75
16.61
17.69
112.36
93.41
123.02
143.03
159.07
164.00
Fish (Freshwater)
6.84
5.61
7.28
10.10
9.07
2.91
Ornamental fish
0.72
1.07
1.60
1.95
1.74
1.63
Dog/Cat
9.67
9.13
8.86
7.79
7.97
9.62
Others
2.54
3.22
0.09
0.10
0.00
0.00
780.88
749.47
784.05
832.56
872.09
824.56
Fish (Seawater)
Total
65
2013
Penicillins
Cephalosporins (total)
1st generation cephalosporins
2nd generation cephalosporins
3rd generation cephalosporins
Aminoglycosides
Macrolides
Lincosamides
Tetracyclines
Peptides
Other antibioitics
Sulfonamides
Quinolones
Fluoroquinolones
Amphenicols
Furan and derivatives
Other synthetic antibacterials
Antifungal antibiotics
2014
78.17
5.58
(4.71)
(0.19)
(0.68)
39.52
77.70
38.99
340.52
11.78
25.98
103.90
1.01
5.53
21.53
14.46
15.02
1.18
2015
2016
2017
2018
77.96
5.50
(4.58)
(0.20)
(0.71)
40.64
70.43
43.26
324.85
9.98
28.85
97.57
1.91
5.63
26.15
1.76
13.97
1.03
83.73
5.89
(4.98)
(0.12)
(0.79)
35.47
98.41
28.66
333.86
14.54
32.39
96.67
1.71
7.35
29.73
1.24
13.35
1.08
99.75
6.45
(5.41)
(0.16)
(0.88)
47.86
134.12
21.87
331.55
14.02
31.96
95.85
1.74
6.08
26.49
1.57
12.12
1.12
101.02
6.65
(5.50)
(0.18)
(0.96)
44.76
140.83
25.26
347.05
19.99
36.19
99.06
1.84
6.83
27.11
1.36
13.09
1.07
107.31
7.06
(5.67)
(0.22)
(1.18)
35.61
154.72
22.76
311.18
12.34
37.50
88.77
1.48
6.65
24.82
1.34
11.98
1.06
Total
780.88
749.47
* The figures in parentheses are included in the Cephalosporins (total).
784.06
832.56
872.09
824.56
The marketing authorization holders also submit the percentage of sales for each species of domestic animal
estimated from information on the distributors, so the estimated volumes for each species sold are calculated
based on those estimated percentages. In terms of active ingredients, pigs accounted for the largest amount,
followed by seawater fish. As described above, fluctuations in amounts for these animal species have a
substantial effect on fluctuations in sales volumes.
Animals vary widely in weight, ranging from chicks that weigh just a few dozen grams to dairy cows that
weigh more than 600 kg, and the number of animals kept also differs according to the species, so the number of
animals and the weight per animal must be taken into account in comparisons by animal species. Accordingly,
there is a comparison method which involves using animal weights and numbers to calculate biomass weight
(total weight of animals) and expressing figures for antimicrobial use as usage per unit of biomass weight. While
there was hitherto no internationally standardized method for calculating biomass weight, the OIE has recently
set out a method for calculating biomass weight as part of its collection of veterinary antimicrobial usage
data.[14] However, the standard weights for each animal type are calculated on a regional basis and, as the
figures have not been published as yet and could vary from year to year, it is not possible to conduct an
evaluation using Japanese data alone. The OIE’s method will serve as a point of reference in future deliberations
concerning evaluation methods, including the possibility of establishing a method specific to Japan.
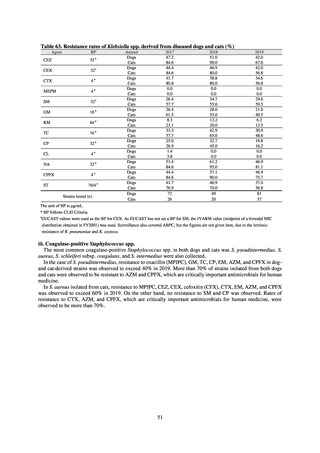
Table 76. Estimated amounts of veterinary antimicrobials in terms of active ingredients by animal species
(t)
2013
2014
2015
2016
2017
2018
Beef cattle
23.02
20.35
23.77
25.00
25.92
33.17
Dairy cow
31.73
30.45
32.48
35.10
34.55
41.01
2.18
2.01
2.10
2.31
2.17
3.90
502.64
490.42
503.13
521.64
551.96
486.01
65.90
70.14
62.36
64.79
63.03
64.62
Horse
Pig
Broiler
Layer
23.29
23.67
19.36
20.75
16.61
17.69
112.36
93.41
123.02
143.03
159.07
164.00
Fish (Freshwater)
6.84
5.61
7.28
10.10
9.07
2.91
Ornamental fish
0.72
1.07
1.60
1.95
1.74
1.63
Dog/Cat
9.67
9.13
8.86
7.79
7.97
9.62
Others
2.54
3.22
0.09
0.10
0.00
0.00
780.88
749.47
784.05
832.56
872.09
824.56
Fish (Seawater)
Total
65