よむ、つかう、まなぶ。
【参考資料3】【英版R4.1.17】Nippon AMR One Health Report (NAOR) 2020 (61 ページ)
出典
| 公開元URL | https://www.mhlw.go.jp/stf/newpage_23261.html |
| 出典情報 | 国際的に脅威となる感染症対策関係閣僚会議 薬剤耐性ワンヘルス動向調査検討会(第9回 1/17)《厚生労働省》 |
ページ画像
ダウンロードした画像を利用する際は「出典情報」を明記してください。
低解像度画像をダウンロード
プレーンテキスト
資料テキストはコンピュータによる自動処理で生成されており、完全に資料と一致しない場合があります。
テキストをコピーしてご利用いただく際は資料と付け合わせてご確認ください。
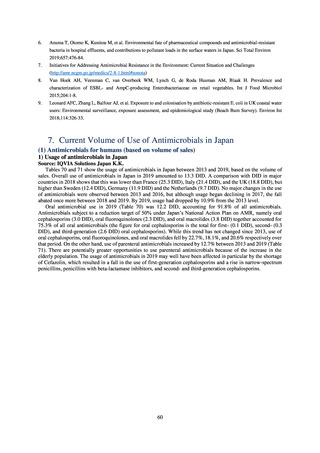
6.
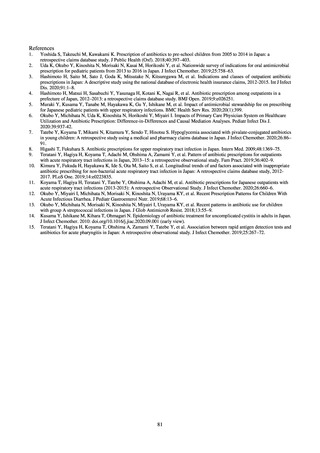
Azuma T, Otomo K, Kunitou M, et al. Environmental fate of pharmaceutical compounds and antimicrobial-resistant
bacteria in hospital effluents, and contributions to pollutant loads in the surface waters in Japan. Sci Total Environ
2019;657:476-84.
7.
Initiatives for Addressing Antimicrobial Resistance in the Environment: Current Situation and Challenges
(http://amr.ncgm.go.jp/medics/2-8-1.html#sonota)
8.
Van Hoek AH, Veenman C, van Overbeek WM, Lynch G, de Roda Husman AM, Blaak H. Prevalence and
characterization of ESBL- and AmpC-producing Enterobacteriaceae on retail vegetables. Int J Food Microbiol
2015;204:1-8.
9.
Leonard AFC, Zhang L, Balfour AJ, et al. Exposure to and colonisation by antibiotic-resistant E. coli in UK coastal water
users: Environmental surveillance, exposure assessment, and epidemiological study (Beach Bum Survey). Environ Int
2018;114:326-33.
Current Volume of Use of Antimicrobials in Japan
(1) Antimicrobials for humans (based on volume of sales)
1) Usage of antimicrobials in Japan
Source: IQVIA Solutions Japan K.K.
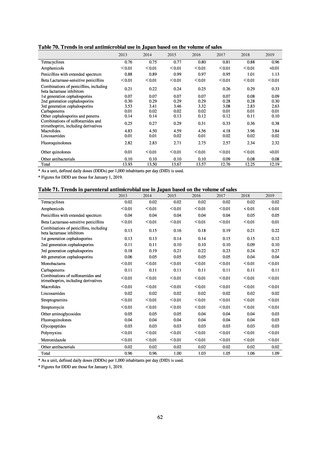
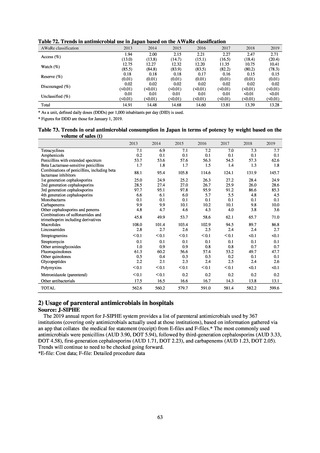
Tables 70 and 71 show the usage of antimicrobials in Japan between 2013 and 2019, based on the volume of
sales. Overall use of antimicrobials in Japan in 2019 amounted to 13.3 DID. A comparison with DID in major
countries in 2018 shows that this was lower than France (25.3 DID), Italy (21.4 DID), and the UK (18.8 DID), but
higher than Sweden (12.4 DID), Germany (11.9 DID) and the Netherlands (9.7 DID). No major changes in the use
of antimicrobials were observed between 2013 and 2016, but although usage began declining in 2017, the fall
abated once more between 2018 and 2019. By 2019, usage had dropped by 10.9% from the 2013 level.
Oral antimicrobial use in 2019 (Table 70) was 12.2 DID, accounting for 91.8% of all antimicrobials.
Antimicrobials subject to a reduction target of 50% under Japan’s National Action Plan on AMR, namely oral
cephalosporins (3.0 DID), oral fluoroquinolones (2.3 DID), and oral macrolides (3.8 DID) together accounted for
75.3% of all oral antimicrobials (the figure for oral cephalosporins is the total for first- (0.1 DID), second- (0.3
DID), and third-generation (2.6 DID) oral cephalosporins). While this trend has not changed since 2013, use of
oral cephalosporins, oral fluoroquinolones, and oral macrolides fell by 22.7%, 18.1%, and 20.6% respectively over
that period. On the other hand, use of parenteral antimicrobials increased by 12.7% between 2013 and 2019 (Table
71). There are potentially greater opportunities to use parenteral antimicrobials because of the increase in the
elderly population. The usage of antimicrobials in 2019 may well have been affected in particular by the shortage
of Cefazolin, which resulted in a fall in the use of first-generation cephalosporins and a rise in narrow-spectrum
penicillins, penicillins with beta-lactamase inhibitors, and second- and third-generation cephalosporins.
60


