
よむ、つかう、まなぶ。
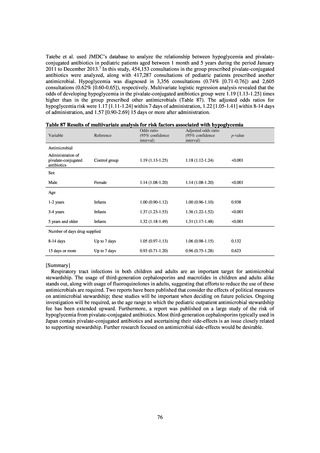
【参考資料3】【英版R4.1.17】Nippon AMR One Health Report (NAOR) 2020 (70 ページ)
出典
| 公開元URL | https://www.mhlw.go.jp/stf/newpage_23261.html |
| 出典情報 | 国際的に脅威となる感染症対策関係閣僚会議 薬剤耐性ワンヘルス動向調査検討会(第9回 1/17)《厚生労働省》 |
ページ画像
ダウンロードした画像を利用する際は「出典情報」を明記してください。
低解像度画像をダウンロード
プレーンテキスト
資料テキストはコンピュータによる自動処理で生成されており、完全に資料と一致しない場合があります。
テキストをコピーしてご利用いただく際は資料と付け合わせてご確認ください。
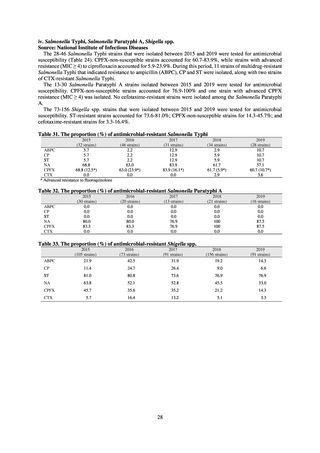
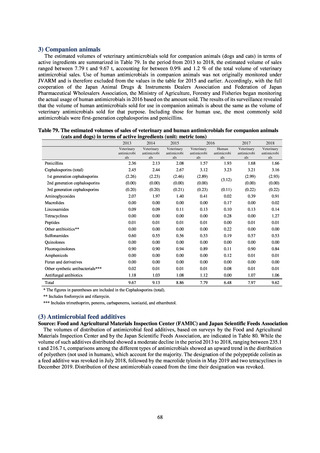
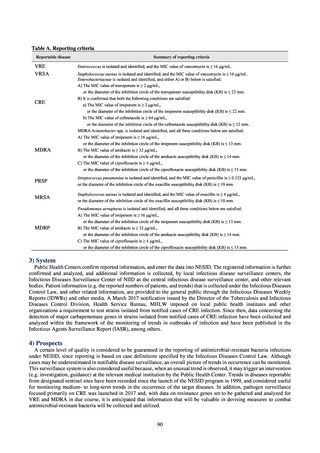
Table 80. Volume of distribution of antibiotic feed additives in terms of effective value (unit: metric tons)
2013
Aminoglycosides
Polypeptides
2014
2015
2016
2017
2018
0.0
35.0
0.0
28.3
0.0
29.6
0.0
32.1
0.0
15.2
0.0
9.4
Tetracyclines
1.6
2.2
2.6
2.0
0.0
0.0
Macrolides
5.6
5.3
5.5
1.4
3.5
0.0
Polysaccharides
0.2
0.0
0.1
0.1
0.1
0.0
136.0
142.5
141.7
159.9
165.5
161.0
20.8
35.9
18.3
29.3
12.5
24.4
14.6
18.1
19.8
17.1
26.2
20.1
235.1
225.9
216.4
228.2
221.2
216.7
Polyethers
Other antimicrobials
Synthetic antimicrobials
Total
Figures do not include antifungal agents.
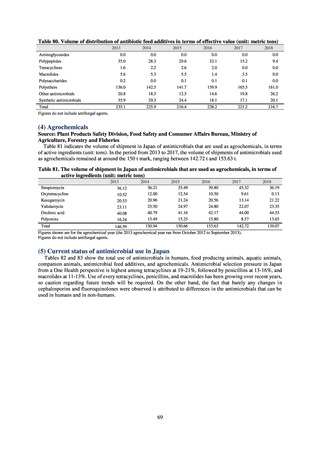
(4) Agrochemicals
Source: Plant Products Safety Division, Food Safety and Consumer Affairs Bureau, Ministry of
Agriculture, Forestry and Fisheries
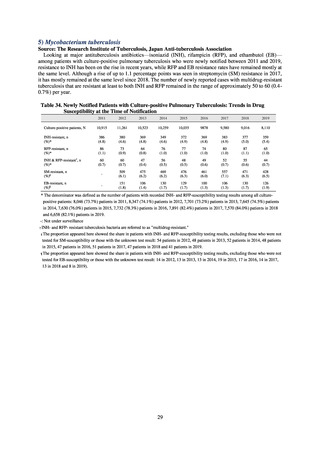
Table 81 indicates the volume of shipment in Japan of antimicrobials that are used as agrochemicals, in terms
of active ingredients (unit: tons). In the period from 2013 to 2017, the volume of shipments of antimicrobials used
as agrochemicals remained at around the 150 t mark, ranging between 142.72 t and 153.63 t.
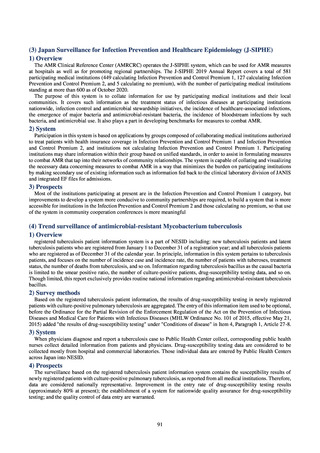
Table 81. The volume of shipment in Japan of antimicrobials that are used as agrochemicals, in terms of
active ingredients (unit: metric tons)
2013
2017
45.32
9.61
13.14
22.07
44.00
8.57
2018
36.19
0.13
21.22
23.35
44.53
13.65
Total
150.94
150.66
153.63
142.72
146.59
Figures shown are for the agrochemical year (the 2013 agrochemical year ran from October 2012 to September 2013).
Figures do not include antifungal agents.
139.07
Streptomycin
Oxytetracycline
Kasugamycin
Validamycin
Oxolinic acid
Polyoxins
36.12
10.52
20.53
23.11
40.08
16.24
2014
36.21
12.00
20.96
25.50
40.79
15.49
2015
35.49
12.54
21.24
24.97
41.16
15.25
2016
39.80
10.50
20.56
24.80
42.17
15.80
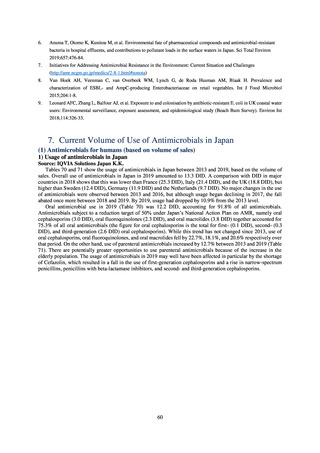
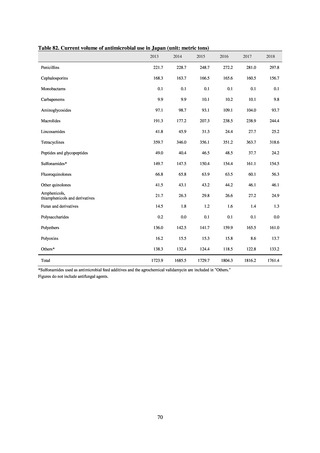
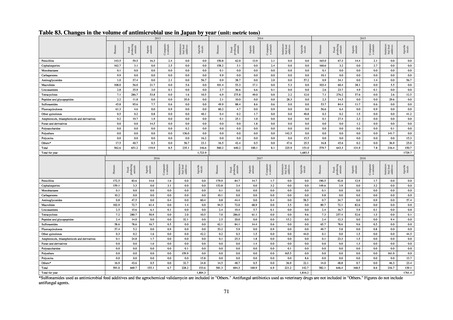
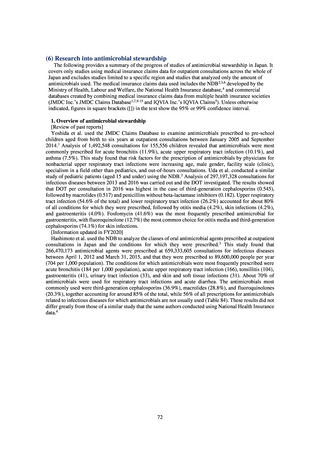
(5) Current status of antimicrobial use in Japan
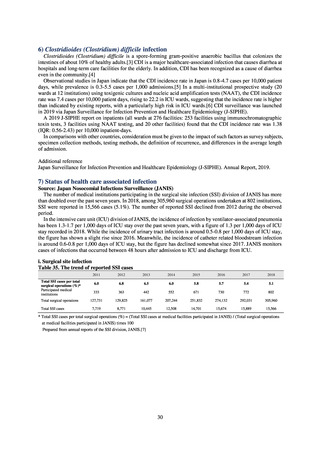
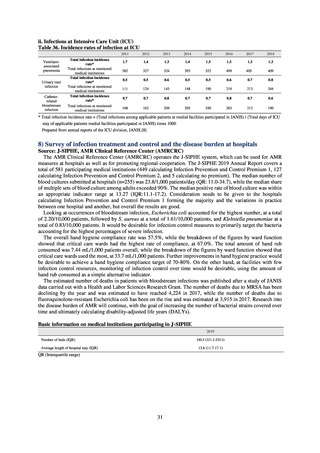
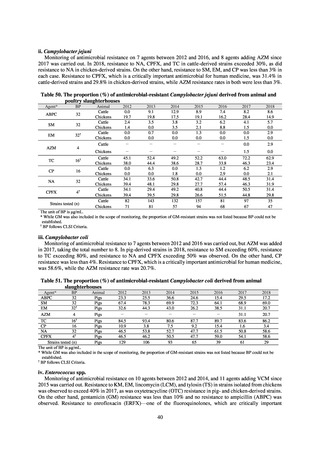
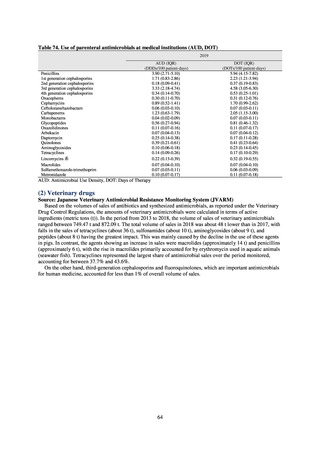
Tables 82 and 83 show the total use of antimicrobials in humans, food producing animals, aquatic animals,
companion animals, antimicrobial feed additives, and agrochemicals. Antimicrobial selection pressure in Japan
from a One Health perspective is highest among tetracyclines at 19-21%, followed by penicillins at 13-16%, and
macrolides at 11-13%. Use of every tetracyclines, penicillins, and macrolides has been growing over recent years,
so caution regarding future trends will be required. On the other hand, the fact that barely any changes in
cephalosporins and fluoroquinolones were observed is attributed to differences in the antimicrobials that can be
used in humans and in non-humans.
69
2013
Aminoglycosides
Polypeptides
2014
2015
2016
2017
2018
0.0
35.0
0.0
28.3
0.0
29.6
0.0
32.1
0.0
15.2
0.0
9.4
Tetracyclines
1.6
2.2
2.6
2.0
0.0
0.0
Macrolides
5.6
5.3
5.5
1.4
3.5
0.0
Polysaccharides
0.2
0.0
0.1
0.1
0.1
0.0
136.0
142.5
141.7
159.9
165.5
161.0
20.8
35.9
18.3
29.3
12.5
24.4
14.6
18.1
19.8
17.1
26.2
20.1
235.1
225.9
216.4
228.2
221.2
216.7
Polyethers
Other antimicrobials
Synthetic antimicrobials
Total
Figures do not include antifungal agents.
(4) Agrochemicals
Source: Plant Products Safety Division, Food Safety and Consumer Affairs Bureau, Ministry of
Agriculture, Forestry and Fisheries
Table 81 indicates the volume of shipment in Japan of antimicrobials that are used as agrochemicals, in terms
of active ingredients (unit: tons). In the period from 2013 to 2017, the volume of shipments of antimicrobials used
as agrochemicals remained at around the 150 t mark, ranging between 142.72 t and 153.63 t.
Table 81. The volume of shipment in Japan of antimicrobials that are used as agrochemicals, in terms of
active ingredients (unit: metric tons)
2013
2017
45.32
9.61
13.14
22.07
44.00
8.57
2018
36.19
0.13
21.22
23.35
44.53
13.65
Total
150.94
150.66
153.63
142.72
146.59
Figures shown are for the agrochemical year (the 2013 agrochemical year ran from October 2012 to September 2013).
Figures do not include antifungal agents.
139.07
Streptomycin
Oxytetracycline
Kasugamycin
Validamycin
Oxolinic acid
Polyoxins
36.12
10.52
20.53
23.11
40.08
16.24
2014
36.21
12.00
20.96
25.50
40.79
15.49
2015
35.49
12.54
21.24
24.97
41.16
15.25
2016
39.80
10.50
20.56
24.80
42.17
15.80
(5) Current status of antimicrobial use in Japan
Tables 82 and 83 show the total use of antimicrobials in humans, food producing animals, aquatic animals,
companion animals, antimicrobial feed additives, and agrochemicals. Antimicrobial selection pressure in Japan
from a One Health perspective is highest among tetracyclines at 19-21%, followed by penicillins at 13-16%, and
macrolides at 11-13%. Use of every tetracyclines, penicillins, and macrolides has been growing over recent years,
so caution regarding future trends will be required. On the other hand, the fact that barely any changes in
cephalosporins and fluoroquinolones were observed is attributed to differences in the antimicrobials that can be
used in humans and in non-humans.
69