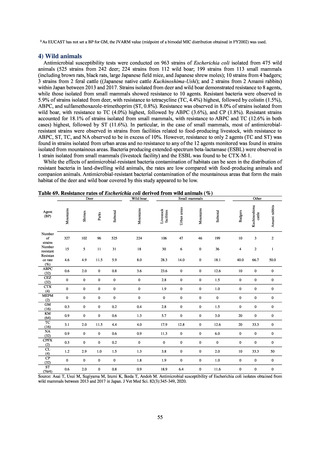

よむ、つかう、まなぶ。
【参考資料3】【英版R4.1.17】Nippon AMR One Health Report (NAOR) 2020 (19 ページ)
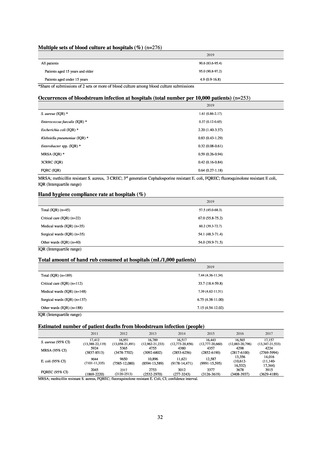
出典
| 公開元URL | https://www.mhlw.go.jp/stf/newpage_23261.html |
| 出典情報 | 国際的に脅威となる感染症対策関係閣僚会議 薬剤耐性ワンヘルス動向調査検討会(第9回 1/17)《厚生労働省》 |
ページ画像
ダウンロードした画像を利用する際は「出典情報」を明記してください。
低解像度画像をダウンロード
プレーンテキスト
資料テキストはコンピュータによる自動処理で生成されており、完全に資料と一致しない場合があります。
テキストをコピーしてご利用いただく際は資料と付け合わせてご確認ください。
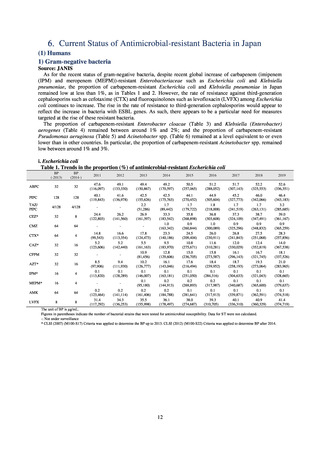
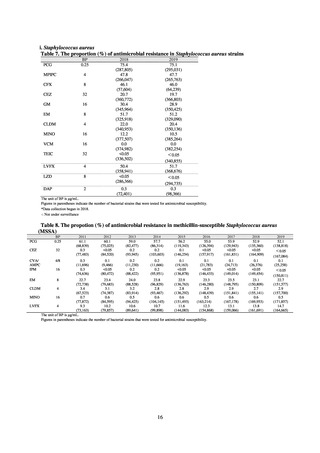
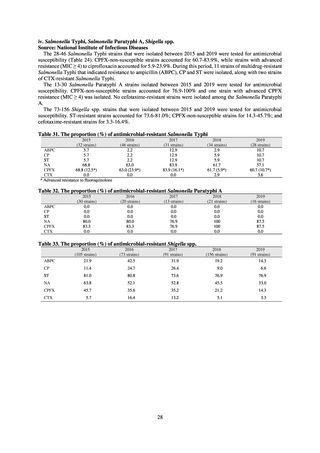
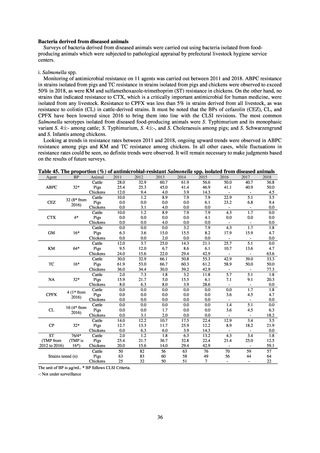
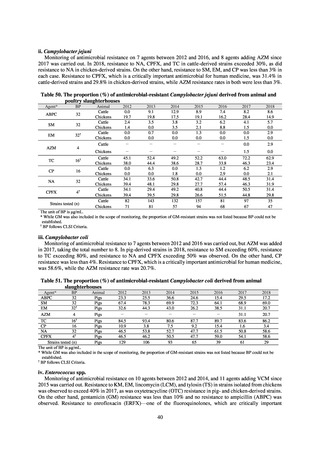
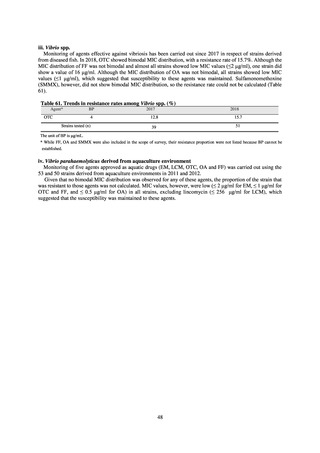
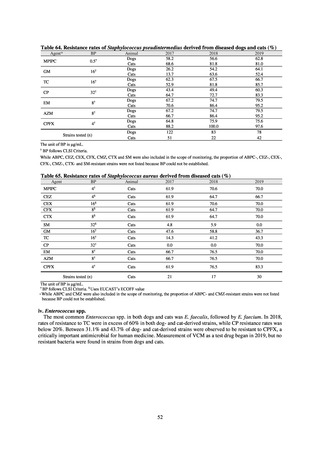
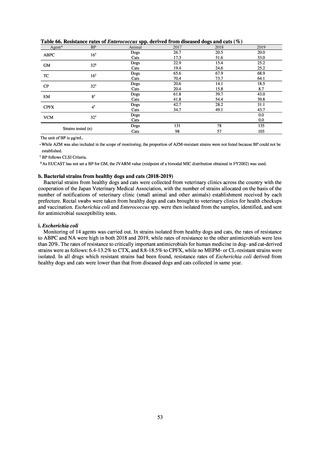
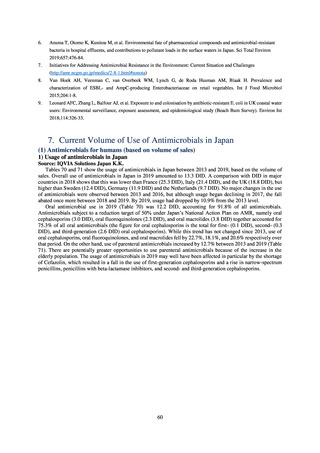
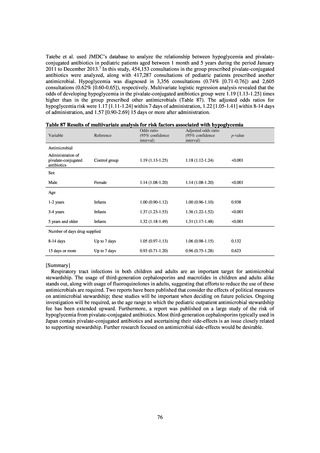
ⅱ. Enterococcus spp.
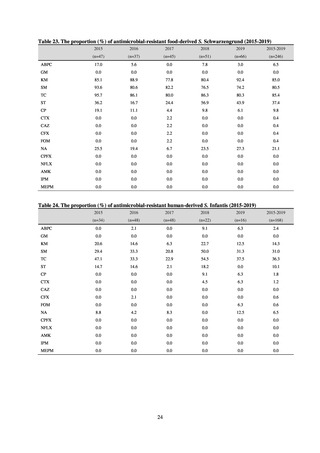
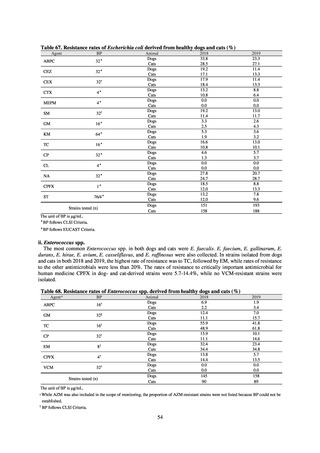
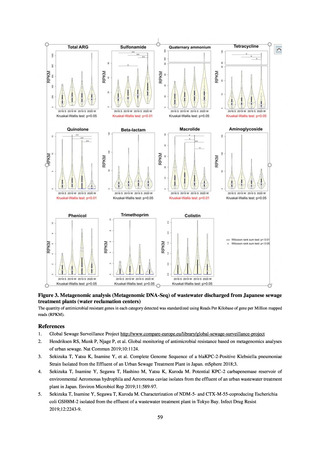
Table 11. Trends in the proportion (%) of antimicrobial-resistant Enterococcus faecalis
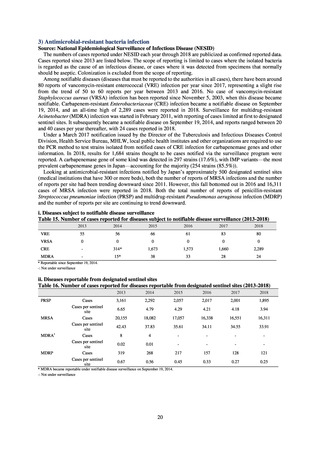
PCG
BP
16
2011
2.2
(53,290)
0.4
(60,686)
57.8
(53,222)
47.8
(61,549)
<0.05
(61,747)
2012
2.1
(60,342)
0.4
(68,440)
58.0
(60,825)
47.7
(69,421)
<0.05
(69,719)
2013
1.8
(65,220)
0.3
(72,587)
57.1
(64,465)
47.7
(74,880)
<0.05
(75,162)
2014
1.6
(67,324)
0.3
(77,997)
55.5
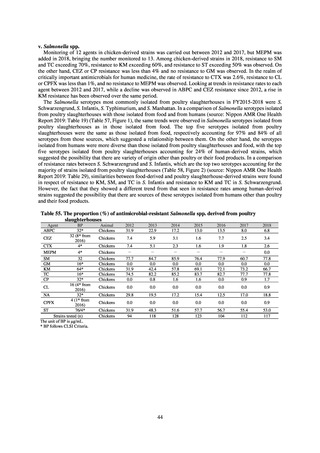
(69,171)
52.1
(81,925)
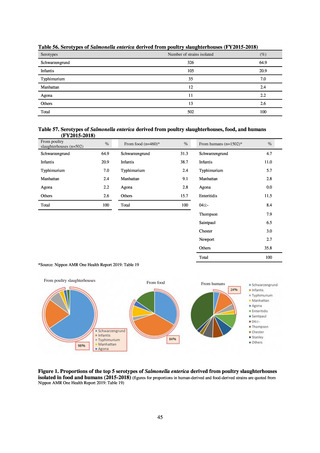
<0.05
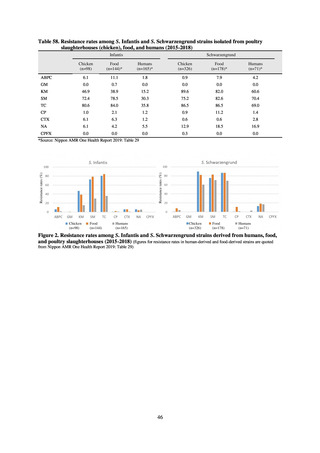
(81,867)
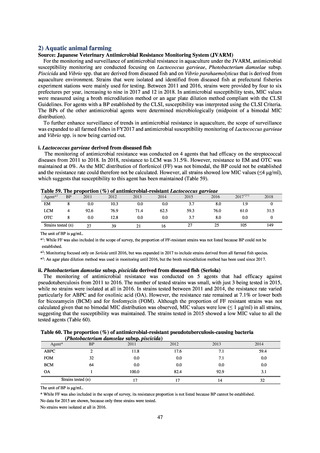
2015
1.4
(92,132)
0.3
(107,733)
54.8
(95,409)
49.7
(115,648)
<0.05
(115,100)
2016
1.1
(98,465)
0.2
(115,548)
54.3
(101,036)
48.9
(123,860)
<0.05
(124,305)
2017
1.0
(98,478)
0.2
(116,493)
53.8
(101,379)
50.3
(125,728)
<0.05
(126,510)
2018
0.9
(104,023)
0.2
(119,014)
52.7
(102,496)
50.9
(128,160)
<0.05
(129,545)
<0.05
(56,591)
<0.05
(63,747)
<0.05
(69,500)
<0.05
(76,160)
<0.05
(105,403)
<0.05
(112,636)
<0.05
(113,501)
<0.05
(115,397)
19.3
18.0
15.5
13.7
12.5
11.9
(58,877)
(65,934)
(70,895)
(77,563)
(109,160)
(117,297)
The unit of BP is μg/mL.
Figures in parentheses indicate the number of bacterial strains that were tested for antimicrobial susceptibility.
11.2
(120,136)
10.4
(122,551)
2019
0.9
(107,021)
0.2
(121,530)
51.7
(102,871)
47.2
(130,729)
<0.05
(132,526)
<0.05
(117,097)
10.1
(125,836)
ABPC
16
EM
8
MINO
16
VCM
32
TEIC
32
LVFX
8
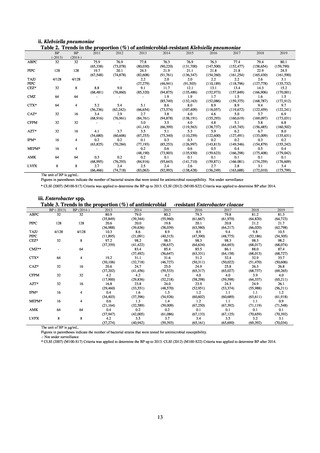
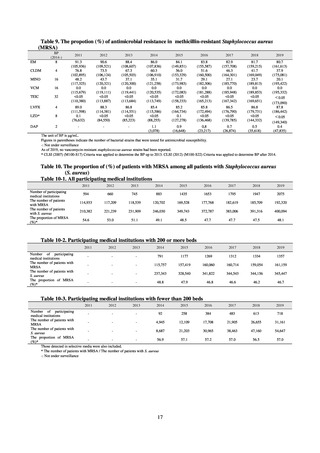
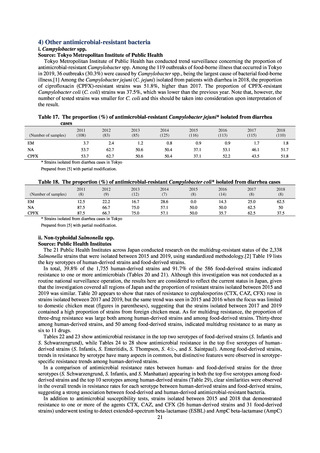
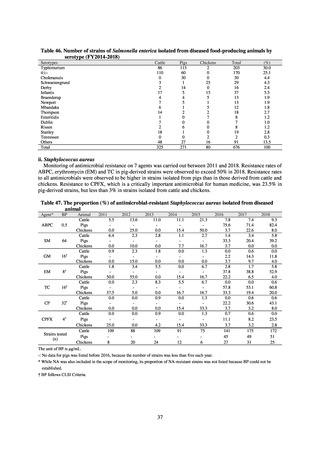
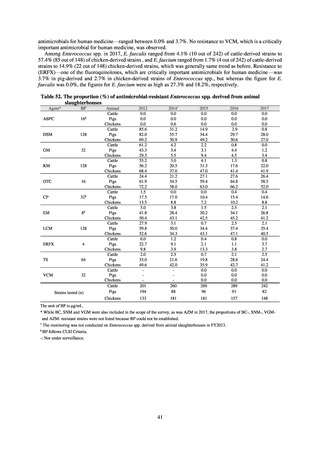
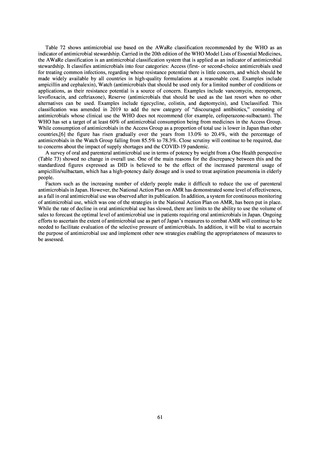
Table 12. Trends in the proportion (%) of antimicrobial-resistant Enterococcus faecium
PCG
BP
16
ABPC
16
EM
MINO
VCM
TEIC
LVFX
LZD
2011
86.9
(17,642)
2012
87.4
(21,139)
2013
87.7
(23,466)
2014
86.9
(24,534)
2016
88.2
(38,060)
2017
87.8
(39,478)
2018
87.5
(42,178)
2019
87.4
(46,021)
86.0
86.2
86.9
86.9
87.6
88.0
(19,780)
(23,885)
(26,199)
(28,564)
(41,459)
(45,069)
8
87.2
88.1
85.9
84.5
84.5
84.0
(17,668)
(21,498)
(23,594)
(25,922)
(37,536)
(40,509)
16
26.9
28.8
29.3
32.2
35.1
34.7
(21,877)
(25,961)
(28,387)
(31,550)
(46,351)
(50,325)
32
1.0
0.4
0.7
0.7
0.7
0.9
(21,782)
(25,787)
(28,334)
(30,996)
(45,514)
(49,618)
32
0.4
0.3
0.2
0.2
0.3
0.6
(20,163)
(23,855)
(26,282)
(29,151)
(41,905)
(45,388)
8
82.9
83.4
84.5
84.7
85.8
86.6
(19,417)
(23,032)
(25,629)
(28,448)
(42,068)
(45,834)
8
0.0
0.1
<0.05
0.1
0.1
0.1
(12,877)
(16,296)
(18,561)
(22,044)
(33,382)
(37,099)
The unit of BP is μg/mL.
Figures in parentheses indicate the number of bacterial strains that were tested for antimicrobial susceptibility.
87.9
(47,046)
83.1
(42,259)
36.2
(52,494)
0.8
(52,127)
0.4
(47,321)
86.5
(48.995)
<0.05
(39,584)
87.6
(49,207)
83.0
(43,555)
38.3
(54,540)
0.9
(54,279)
0.6
(48,991)
86.7
(51,003)
0.1
(41.596)
88.0
(52,929)
83.1
(45,992)
33.0
(58,314)
1.5
(58,377)
1.0
(52,502)
87.6
(55,293)
0.1
(44,887)
18
2015
87.6
(34,752)
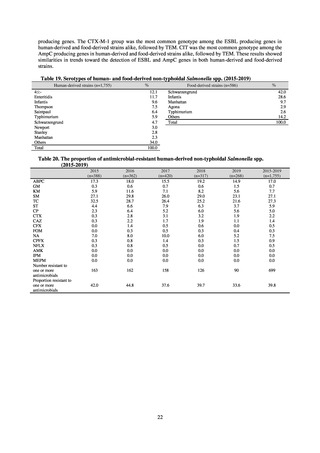
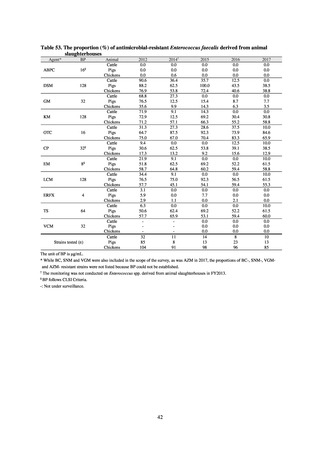
Table 11. Trends in the proportion (%) of antimicrobial-resistant Enterococcus faecalis
PCG
BP
16
2011
2.2
(53,290)
0.4
(60,686)
57.8
(53,222)
47.8
(61,549)
<0.05
(61,747)
2012
2.1
(60,342)
0.4
(68,440)
58.0
(60,825)
47.7
(69,421)
<0.05
(69,719)
2013
1.8
(65,220)
0.3
(72,587)
57.1
(64,465)
47.7
(74,880)
<0.05
(75,162)
2014
1.6
(67,324)
0.3
(77,997)
55.5
(69,171)
52.1
(81,925)
<0.05
(81,867)
2015
1.4
(92,132)
0.3
(107,733)
54.8
(95,409)
49.7
(115,648)
<0.05
(115,100)
2016
1.1
(98,465)
0.2
(115,548)
54.3
(101,036)
48.9
(123,860)
<0.05
(124,305)
2017
1.0
(98,478)
0.2
(116,493)
53.8
(101,379)
50.3
(125,728)
<0.05
(126,510)
2018
0.9
(104,023)
0.2
(119,014)
52.7
(102,496)
50.9
(128,160)
<0.05
(129,545)
<0.05
(56,591)
<0.05
(63,747)
<0.05
(69,500)
<0.05
(76,160)
<0.05
(105,403)
<0.05
(112,636)
<0.05
(113,501)
<0.05
(115,397)
19.3
18.0
15.5
13.7
12.5
11.9
(58,877)
(65,934)
(70,895)
(77,563)
(109,160)
(117,297)
The unit of BP is μg/mL.
Figures in parentheses indicate the number of bacterial strains that were tested for antimicrobial susceptibility.
11.2
(120,136)
10.4
(122,551)
2019
0.9
(107,021)
0.2
(121,530)
51.7
(102,871)
47.2
(130,729)
<0.05
(132,526)
<0.05
(117,097)
10.1
(125,836)
ABPC
16
EM
8
MINO
16
VCM
32
TEIC
32
LVFX
8
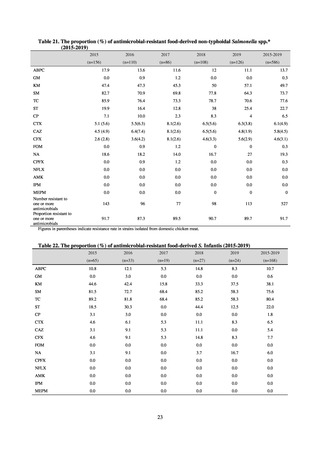
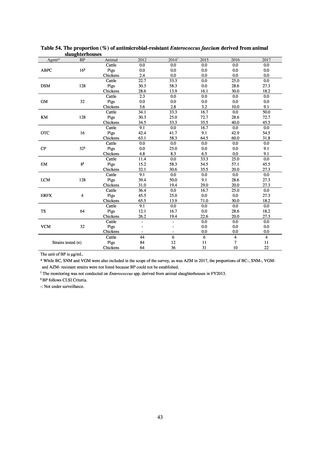
Table 12. Trends in the proportion (%) of antimicrobial-resistant Enterococcus faecium
PCG
BP
16
ABPC
16
EM
MINO
VCM
TEIC
LVFX
LZD
2011
86.9
(17,642)
2012
87.4
(21,139)
2013
87.7
(23,466)
2014
86.9
(24,534)
2016
88.2
(38,060)
2017
87.8
(39,478)
2018
87.5
(42,178)
2019
87.4
(46,021)
86.0
86.2
86.9
86.9
87.6
88.0
(19,780)
(23,885)
(26,199)
(28,564)
(41,459)
(45,069)
8
87.2
88.1
85.9
84.5
84.5
84.0
(17,668)
(21,498)
(23,594)
(25,922)
(37,536)
(40,509)
16
26.9
28.8
29.3
32.2
35.1
34.7
(21,877)
(25,961)
(28,387)
(31,550)
(46,351)
(50,325)
32
1.0
0.4
0.7
0.7
0.7
0.9
(21,782)
(25,787)
(28,334)
(30,996)
(45,514)
(49,618)
32
0.4
0.3
0.2
0.2
0.3
0.6
(20,163)
(23,855)
(26,282)
(29,151)
(41,905)
(45,388)
8
82.9
83.4
84.5
84.7
85.8
86.6
(19,417)
(23,032)
(25,629)
(28,448)
(42,068)
(45,834)
8
0.0
0.1
<0.05
0.1
0.1
0.1
(12,877)
(16,296)
(18,561)
(22,044)
(33,382)
(37,099)
The unit of BP is μg/mL.
Figures in parentheses indicate the number of bacterial strains that were tested for antimicrobial susceptibility.
87.9
(47,046)
83.1
(42,259)
36.2
(52,494)
0.8
(52,127)
0.4
(47,321)
86.5
(48.995)
<0.05
(39,584)
87.6
(49,207)
83.0
(43,555)
38.3
(54,540)
0.9
(54,279)
0.6
(48,991)
86.7
(51,003)
0.1
(41.596)
88.0
(52,929)
83.1
(45,992)
33.0
(58,314)
1.5
(58,377)
1.0
(52,502)
87.6
(55,293)
0.1
(44,887)
18
2015
87.6
(34,752)