
よむ、つかう、まなぶ。
【参考資料3】【英版R4.1.17】Nippon AMR One Health Report (NAOR) 2020 (65 ページ)
出典
| 公開元URL | https://www.mhlw.go.jp/stf/newpage_23261.html |
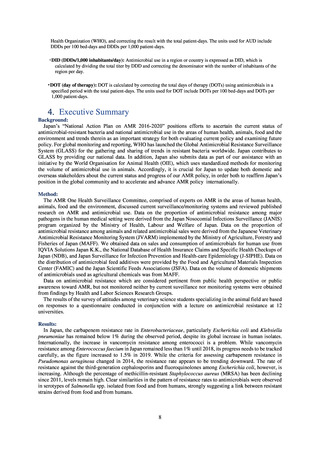
| 出典情報 | 国際的に脅威となる感染症対策関係閣僚会議 薬剤耐性ワンヘルス動向調査検討会(第9回 1/17)《厚生労働省》 |
ページ画像
ダウンロードした画像を利用する際は「出典情報」を明記してください。
低解像度画像をダウンロード
プレーンテキスト
資料テキストはコンピュータによる自動処理で生成されており、完全に資料と一致しない場合があります。
テキストをコピーしてご利用いただく際は資料と付け合わせてご確認ください。
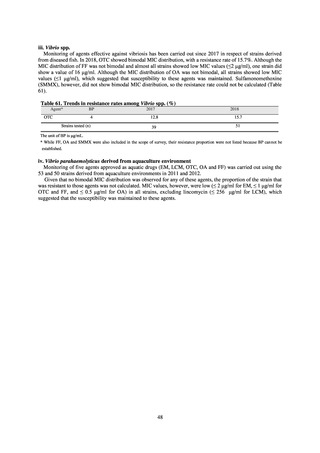
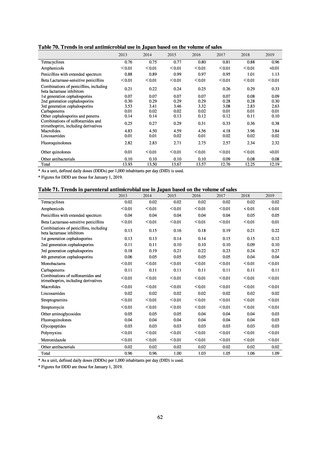
Table 74. Use of parenteral antimicrobials at medical institutions (AUD, DOT)
2019
Penicillins
1st generation cephalosporins
2nd generation cephalosporins
3rd generation cephalosporins
4th generation cephalosporins
Oxacephems
Cephamycins
Ceftolozane/tazobactam
Carbapenems
Monobactams
Glycopeptides
Oxazolidinones
Arbekacin
Daptomycin
Quinolones
Aminoglycosides
Tetracyclines
Lincomycins 系
Macrolides
Sulfamethoxazole-trimethoprim
Metronidazole
AUD (IQR)
(DDDs/100 patient-days)
3.90 (2.71-5.10)
1.71 (0.83-2.86)
0.18 (0.09-0.41)
3.33 (2.18-4.74)
0.34 (0.14-0.70)
0.30 (0.11-0.70)
0.89 (0.52-1.41)
0.06 (0.03-0.10)
1.23 (0.63-1.79)
0.04 (0.02-0.09)
0.56 (0.27-0.94)
0.11 (0.07-0.16)
0.07 (0.04-0.13)
0.25 (0.14-0.38)
0.39 (0.21-0.61)
0.10 (0.06-0.18)
0.14 (0.09-0.26)
0.22 (0.13-0.39)
0.07 (0.04-0.10)
0.07 (0.03-0.11)
0.10 (0.07-0.17)
DOT (IQR)
(DOTs/100 patient-days)
5.94 (4.15-7.82)
2.23 (1.21-3.94)
0.37 (0.19-0.83)
4.58 (3.05-6.30)
0.53 (0.25-1.01)
0.31 (0.12-0.76)
1.70 (0.99-2.62)
0.07 (0.03-0.11)
2.05 (1.15-3.00)
0.07 (0.03-0.11)
0.81 (0.46-1.32)
0.11 (0.07-0.17)
0.07 (0.04-0.12)
0.17 (0.11-0.28)
0.41 (0.23-0.64)
0.23 (0.14-0.45)
0.17 (0.10-0.29)
0.32 (0.19-0.55)
0.07 (0.04-0.10)
0.06 (0.03-0.09)
0.11 (0.07-0.18)
AUD: Antimicrobial Use Density, DOT: Days of Therapy
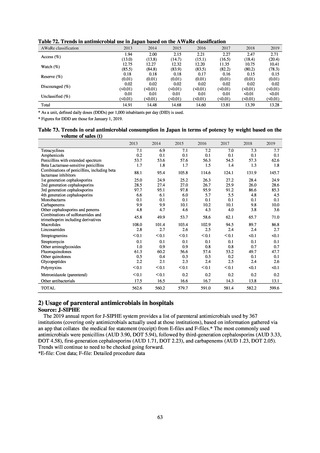
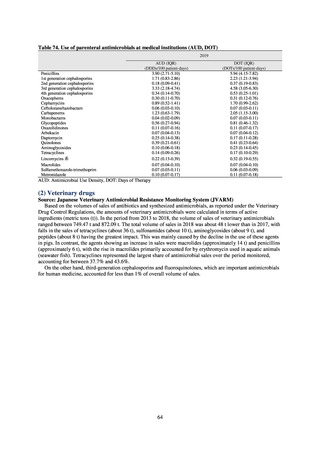
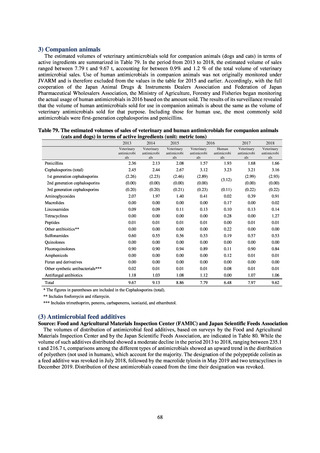
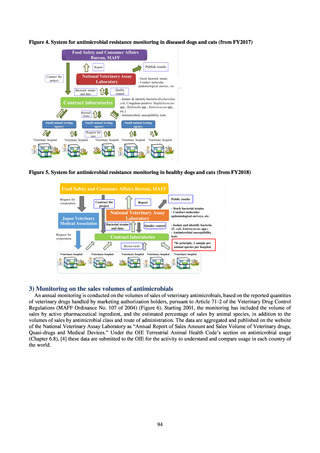
(2) Veterinary drugs
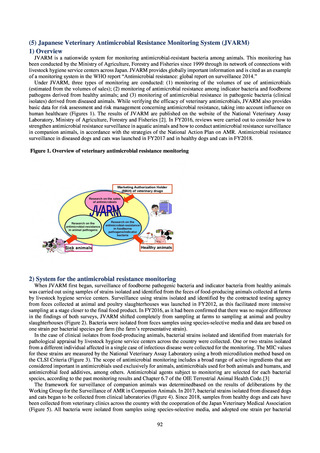
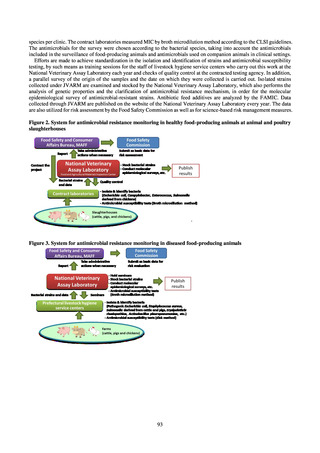
Source: Japanese Veterinary Antimicrobial Resistance Monitoring System (JVARM)
Based on the volumes of sales of antibiotics and synthesized antimicrobials, as reported under the Veterinary
Drug Control Regulations, the amounts of veterinary antimicrobials were calculated in terms of active
ingredients (metric tons (t)). In the period from 2013 to 2018, the volume of sales of veterinary antimicrobials
ranged between 749.47 t and 872.09 t. The total volume of sales in 2018 was about 48 t lower than in 2017, with
falls in the sales of tetracyclines (about 36 t), sulfonamides (about 10 t), aminoglycosides (about 9 t), and
peptides (about 8 t) having the greatest impact. This was mainly caused by the decline in the use of these agents
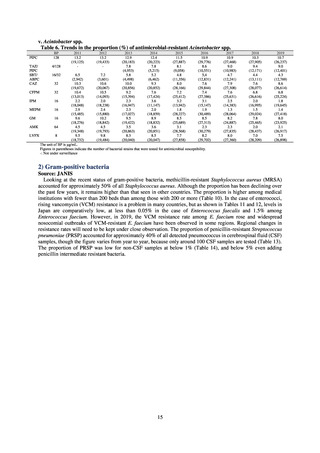
in pigs. In contrast, the agents showing an increase in sales were macrolides (approximately 14 t) and penicillins
(approximately 6 t), with the rise in macrolides primarily accounted for by erythromycin used in aquatic animals
(seawater fish). Tetracyclines represented the largest share of antimicrobial sales over the period monitored,
accounting for between 37.7% and 43.6%.
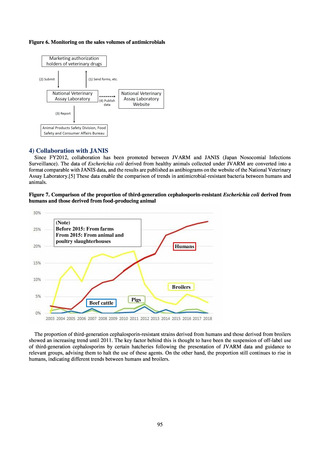
On the other hand, third-generation cephalosporins and fluoroquinolones, which are important antimicrobials
for human medicine, accounted for less than 1% of overall volume of sales.
64
2019
Penicillins
1st generation cephalosporins
2nd generation cephalosporins
3rd generation cephalosporins
4th generation cephalosporins
Oxacephems
Cephamycins
Ceftolozane/tazobactam
Carbapenems
Monobactams
Glycopeptides
Oxazolidinones
Arbekacin
Daptomycin
Quinolones
Aminoglycosides
Tetracyclines
Lincomycins 系
Macrolides
Sulfamethoxazole-trimethoprim
Metronidazole
AUD (IQR)
(DDDs/100 patient-days)
3.90 (2.71-5.10)
1.71 (0.83-2.86)
0.18 (0.09-0.41)
3.33 (2.18-4.74)
0.34 (0.14-0.70)
0.30 (0.11-0.70)
0.89 (0.52-1.41)
0.06 (0.03-0.10)
1.23 (0.63-1.79)
0.04 (0.02-0.09)
0.56 (0.27-0.94)
0.11 (0.07-0.16)
0.07 (0.04-0.13)
0.25 (0.14-0.38)
0.39 (0.21-0.61)
0.10 (0.06-0.18)
0.14 (0.09-0.26)
0.22 (0.13-0.39)
0.07 (0.04-0.10)
0.07 (0.03-0.11)
0.10 (0.07-0.17)
DOT (IQR)
(DOTs/100 patient-days)
5.94 (4.15-7.82)
2.23 (1.21-3.94)
0.37 (0.19-0.83)
4.58 (3.05-6.30)
0.53 (0.25-1.01)
0.31 (0.12-0.76)
1.70 (0.99-2.62)
0.07 (0.03-0.11)
2.05 (1.15-3.00)
0.07 (0.03-0.11)
0.81 (0.46-1.32)
0.11 (0.07-0.17)
0.07 (0.04-0.12)
0.17 (0.11-0.28)
0.41 (0.23-0.64)
0.23 (0.14-0.45)
0.17 (0.10-0.29)
0.32 (0.19-0.55)
0.07 (0.04-0.10)
0.06 (0.03-0.09)
0.11 (0.07-0.18)
AUD: Antimicrobial Use Density, DOT: Days of Therapy
(2) Veterinary drugs
Source: Japanese Veterinary Antimicrobial Resistance Monitoring System (JVARM)
Based on the volumes of sales of antibiotics and synthesized antimicrobials, as reported under the Veterinary
Drug Control Regulations, the amounts of veterinary antimicrobials were calculated in terms of active
ingredients (metric tons (t)). In the period from 2013 to 2018, the volume of sales of veterinary antimicrobials
ranged between 749.47 t and 872.09 t. The total volume of sales in 2018 was about 48 t lower than in 2017, with
falls in the sales of tetracyclines (about 36 t), sulfonamides (about 10 t), aminoglycosides (about 9 t), and
peptides (about 8 t) having the greatest impact. This was mainly caused by the decline in the use of these agents
in pigs. In contrast, the agents showing an increase in sales were macrolides (approximately 14 t) and penicillins
(approximately 6 t), with the rise in macrolides primarily accounted for by erythromycin used in aquatic animals
(seawater fish). Tetracyclines represented the largest share of antimicrobial sales over the period monitored,
accounting for between 37.7% and 43.6%.
On the other hand, third-generation cephalosporins and fluoroquinolones, which are important antimicrobials
for human medicine, accounted for less than 1% of overall volume of sales.
64