
よむ、つかう、まなぶ。
【参考資料3】【英版R4.1.17】Nippon AMR One Health Report (NAOR) 2020 (37 ページ)
出典
| 公開元URL | https://www.mhlw.go.jp/stf/newpage_23261.html |
| 出典情報 | 国際的に脅威となる感染症対策関係閣僚会議 薬剤耐性ワンヘルス動向調査検討会(第9回 1/17)《厚生労働省》 |
ページ画像
ダウンロードした画像を利用する際は「出典情報」を明記してください。
低解像度画像をダウンロード
プレーンテキスト
資料テキストはコンピュータによる自動処理で生成されており、完全に資料と一致しない場合があります。
テキストをコピーしてご利用いただく際は資料と付け合わせてご確認ください。
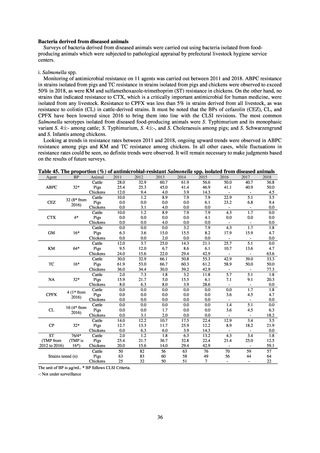
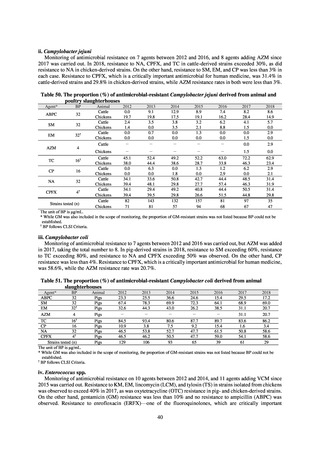
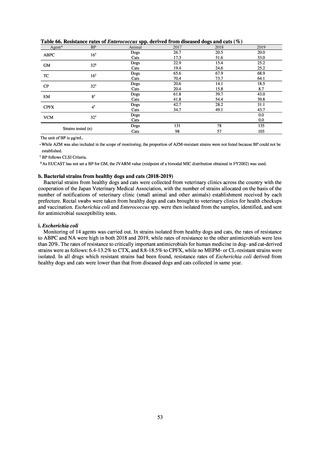
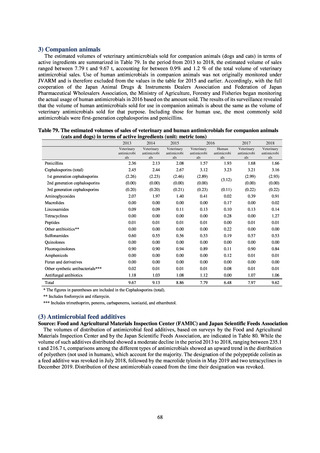
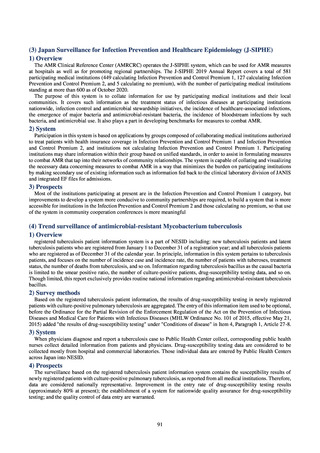
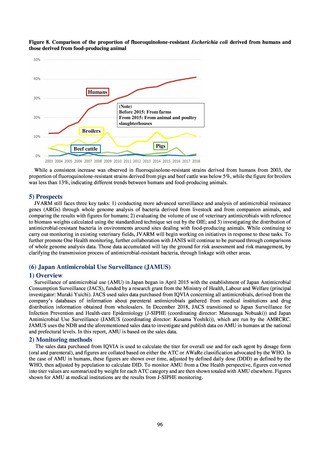
Bacteria derived from diseased animals
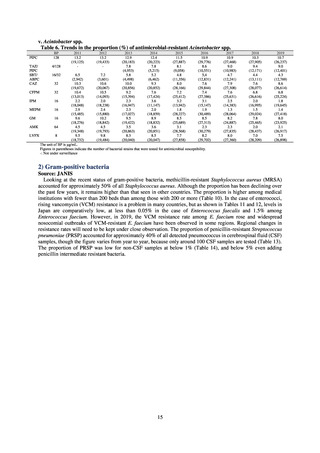
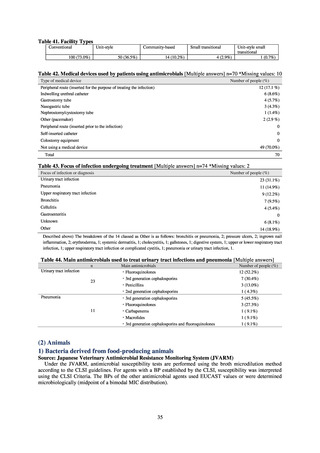
Surveys of bacteria derived from diseased animals were carried out using bacteria isolated from foodproducing animals which were subjected to pathological appraisal by prefectural livestock hygiene service
centers.
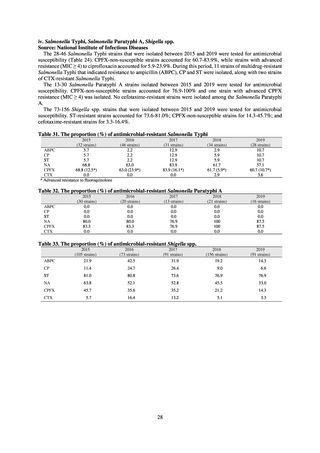
i. Salmonella spp.
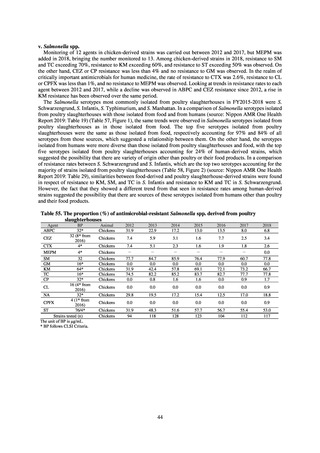
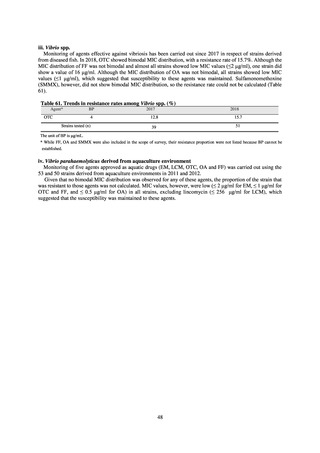
Monitoring of antimicrobial resistance on 11 agents was carried out between 2011 and 2018. ABPC resistance
in strains isolated from pigs and TC resistance in strains isolated from pigs and chickens were observed to exceed
50% in 2018, as were KM and sulfamethoxazole-trimethoprim (ST) resistance in chickens. On the other hand, no
strains that indicated resistance to CTX, which is a critically important antimicrobial for human medicine, were
isolated from any livestock. Resistance to CPFX was less than 5% in strains derived from all livestock, as was
resistance to colistin (CL) in cattle-derived strains. It must be noted that the BPs of cefazolin (CEZ), CL, and
CPFX have been lowered since 2016 to bring them into line with the CLSI revisions. The most common
Salmonella serotypes isolated from diseased food-producing animals were S. Typhimurium and its monophasic
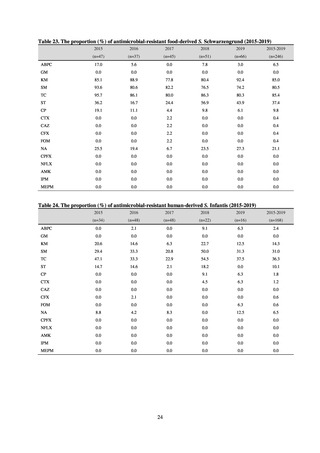
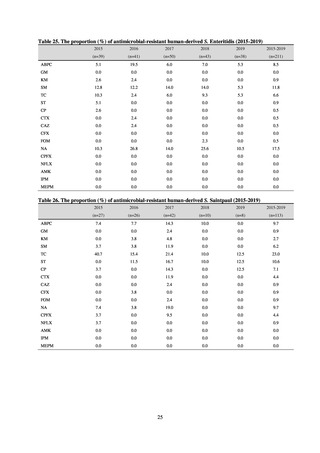
variant S. 4:i:- among cattle; S. Typhimurium, S. 4:i:-, and S. Choleraesuis among pigs; and S. Schwarzengrund
and S. Infantis among chickens.
Looking at trends in resistance rates between 2011 and 2018, ongoing upward trends were observed in ABPC
resistance among pigs and KM and TC resistance among chickens. In all other cases, while fluctuations in
resistance rates could be seen, no definite trends were observed. It will remain necessary to make judgments based
on the results of future surveys.
Table 45. The proportion (%) of antimicrobial-resistant Salmonella spp. isolated from diseased animals
Agent
BP
Animal
2011
2012
Cattle
28.0
32.9
ABPC
32*
Pigs
25.4
25.3
Chickens
12.0
9.4
Cattle
10.0
1.2
32 (8* from
CEZ
Pigs
0.0
0.0
2016)
Chickens
0.0
3.1
Cattle
10.0
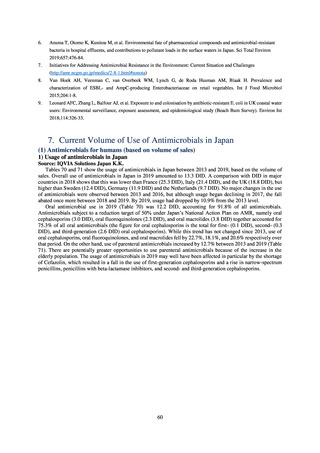
1.2
CTX
4*
Pigs
0.0
0.0
Chickens
0.0
0.0
Cattle
0.0
0.0
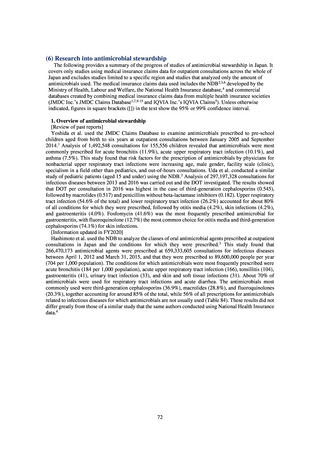
GM
16*
Pigs
6.3
3.6
Chickens
0.0
0.0
Cattle
12.0
3.7
KM
64*
Pigs
9.5
12.0
Chickens
24.0
15.6
Cattle
30.0
32.9
TC
16*
Pigs
61.9
53.0
Chickens
36.0
34.4
Cattle
2.0
7.3
NA
32*
Pigs
15.9
21.7
Chickens
8.0
6.3
Cattle
0.0
0.0
4 (1* from
CPFX
Pigs
0.0
0.0
2016)
Chickens
0.0
0.0
Cattle
0.0
0.0
16 (4* from
CL
Pigs
0.0
0.0
2016)
Chickens
0.0
3.1
Cattle
14.0
12.2
CP
32*
Pigs
12.7
13.3
Chickens
0.0
6.3
ST
76/4*
Cattle
2.0
1.2
(TMP from
(TMP is
Pigs
25.4
21.7
2012 to 2016)
16*)
Chickens
20.0
15.6
Cattle
50
82
Strains tested (n)
Pigs
63
83
Chickens
25
32
The unit of BP is μg/mL. * BP follows CLSI Criteria.
-: Not under surveillance
2013
60.7
45.0
4.0
8.9
0.0
4.0
8.9
0.0
4.0
0.0
15.0
2.0
25.0
6.7
22.0
66.1
66.7
30.0
1.8
5.0
8.0
0.0
0.0
0.0
0.0
1.7
2.0
10.7
11.7
6.0
1.8
36.7
14.0
56
60
50
36
2014
61.9
41.4
3.9
7.9
0.0
0.0
7.9
0.0
0.0
3.2
15.5
0.0
14.3
8.6
29.4
50.8
60.3
39.2
3.2
15.5
3.9
0.0
0.0
0.0
0.0
0.0
0.0
17.5
25.9
3.9
6.3
32.8
29.4
63
58
51
2015
56.6
46.9
14.3
7.9
6.1
0.0
7.9
4.1
0.0
7.9
8.2
0.0
21.1
6.1
42.9
55.3
61.2
42.9
11.8
6.1
28.6
0.0
0.0
0.0
0.0
0.0
0.0
22.4
12.2
14.3
13.2
22.4
42.9
76
49
7
2016
50.0
41.1
22.9
23.2
4.3
0.0
4.3
17.9
25.7
10.7
42.9
58.9
5.7
7.1
0.0
3.6
1.4
3.6
12.9
8.9
4.3
21.4
70
56
-
2017
40.7
40.9
5.1
6.8
1.7
0.0
1.7
15.9
5.1
13.6
39.0
50.0
5.1
9.1
1.7
4.5
5.1
4.5
3.4
18.2
3.4
25.0
59
44
-
2018
36.8
50.0
4.5
3.5
9.4
0.0
0.0
0.0
0.0
1.8
4.7
0.0
0.0
4.7
63.6
33.3
50.0
77.3
1.8
20.3
0.0
1.8
4.7
0.0
0.0
6.3
18.2
3.5
21.9
0.0
1.8
12.5
59.1
57
64
22
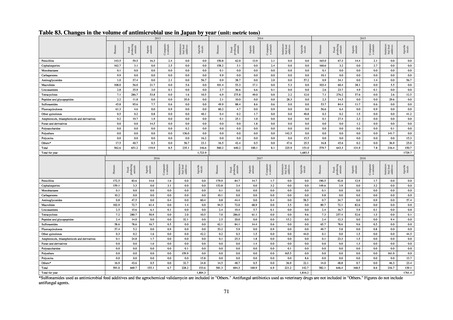
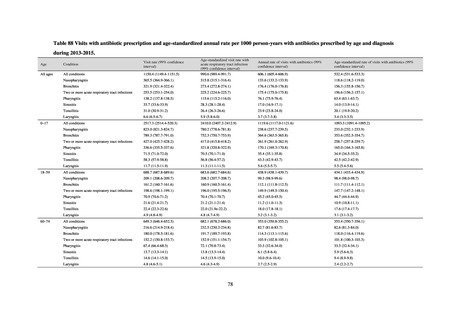
Surveys of bacteria derived from diseased animals were carried out using bacteria isolated from foodproducing animals which were subjected to pathological appraisal by prefectural livestock hygiene service
centers.
i. Salmonella spp.
Monitoring of antimicrobial resistance on 11 agents was carried out between 2011 and 2018. ABPC resistance
in strains isolated from pigs and TC resistance in strains isolated from pigs and chickens were observed to exceed
50% in 2018, as were KM and sulfamethoxazole-trimethoprim (ST) resistance in chickens. On the other hand, no
strains that indicated resistance to CTX, which is a critically important antimicrobial for human medicine, were
isolated from any livestock. Resistance to CPFX was less than 5% in strains derived from all livestock, as was
resistance to colistin (CL) in cattle-derived strains. It must be noted that the BPs of cefazolin (CEZ), CL, and
CPFX have been lowered since 2016 to bring them into line with the CLSI revisions. The most common
Salmonella serotypes isolated from diseased food-producing animals were S. Typhimurium and its monophasic
variant S. 4:i:- among cattle; S. Typhimurium, S. 4:i:-, and S. Choleraesuis among pigs; and S. Schwarzengrund
and S. Infantis among chickens.
Looking at trends in resistance rates between 2011 and 2018, ongoing upward trends were observed in ABPC
resistance among pigs and KM and TC resistance among chickens. In all other cases, while fluctuations in
resistance rates could be seen, no definite trends were observed. It will remain necessary to make judgments based
on the results of future surveys.
Table 45. The proportion (%) of antimicrobial-resistant Salmonella spp. isolated from diseased animals
Agent
BP
Animal
2011
2012
Cattle
28.0
32.9
ABPC
32*
Pigs
25.4
25.3
Chickens
12.0
9.4
Cattle
10.0
1.2
32 (8* from
CEZ
Pigs
0.0
0.0
2016)
Chickens
0.0
3.1
Cattle
10.0
1.2
CTX
4*
Pigs
0.0
0.0
Chickens
0.0
0.0
Cattle
0.0
0.0
GM
16*
Pigs
6.3
3.6
Chickens
0.0
0.0
Cattle
12.0
3.7
KM
64*
Pigs
9.5
12.0
Chickens
24.0
15.6
Cattle
30.0
32.9
TC
16*
Pigs
61.9
53.0
Chickens
36.0
34.4
Cattle
2.0
7.3
NA
32*
Pigs
15.9
21.7
Chickens
8.0
6.3
Cattle
0.0
0.0
4 (1* from
CPFX
Pigs
0.0
0.0
2016)
Chickens
0.0
0.0
Cattle
0.0
0.0
16 (4* from
CL
Pigs
0.0
0.0
2016)
Chickens
0.0
3.1
Cattle
14.0
12.2
CP
32*
Pigs
12.7
13.3
Chickens
0.0
6.3
ST
76/4*
Cattle
2.0
1.2
(TMP from
(TMP is
Pigs
25.4
21.7
2012 to 2016)
16*)
Chickens
20.0
15.6
Cattle
50
82
Strains tested (n)
Pigs
63
83
Chickens
25
32
The unit of BP is μg/mL. * BP follows CLSI Criteria.
-: Not under surveillance
2013
60.7
45.0
4.0
8.9
0.0
4.0
8.9
0.0
4.0
0.0
15.0
2.0
25.0
6.7
22.0
66.1
66.7
30.0
1.8
5.0
8.0
0.0
0.0
0.0
0.0
1.7
2.0
10.7
11.7
6.0
1.8
36.7
14.0
56
60
50
36
2014
61.9
41.4
3.9
7.9
0.0
0.0
7.9
0.0
0.0
3.2
15.5
0.0
14.3
8.6
29.4
50.8
60.3
39.2
3.2
15.5
3.9
0.0
0.0
0.0
0.0
0.0
0.0
17.5
25.9
3.9
6.3
32.8
29.4
63
58
51
2015
56.6
46.9
14.3
7.9
6.1
0.0
7.9
4.1
0.0
7.9
8.2
0.0
21.1
6.1
42.9
55.3
61.2
42.9
11.8
6.1
28.6
0.0
0.0
0.0
0.0
0.0
0.0
22.4
12.2
14.3
13.2
22.4
42.9
76
49
7
2016
50.0
41.1
22.9
23.2
4.3
0.0
4.3
17.9
25.7
10.7
42.9
58.9
5.7
7.1
0.0
3.6
1.4
3.6
12.9
8.9
4.3
21.4
70
56
-
2017
40.7
40.9
5.1
6.8
1.7
0.0
1.7
15.9
5.1
13.6
39.0
50.0
5.1
9.1
1.7
4.5
5.1
4.5
3.4
18.2
3.4
25.0
59
44
-
2018
36.8
50.0
4.5
3.5
9.4
0.0
0.0
0.0
0.0
1.8
4.7
0.0
0.0
4.7
63.6
33.3
50.0
77.3
1.8
20.3
0.0
1.8
4.7
0.0
0.0
6.3
18.2
3.5
21.9
0.0
1.8
12.5
59.1
57
64
22