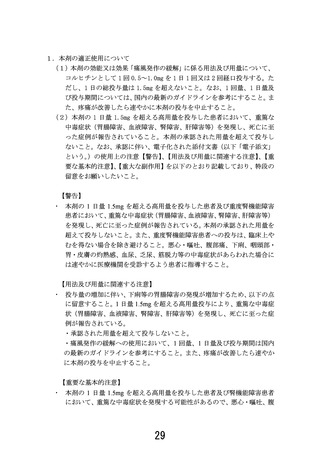
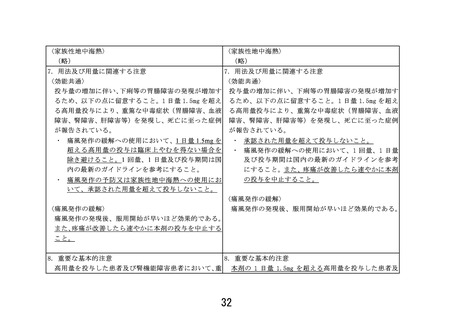
よむ、つかう、まなぶ。
資料3-6 コルヒチンの安全対策のための製造販売承認事項一部変更承認について[1.7MB] (17 ページ)
出典
| 公開元URL | https://www.mhlw.go.jp/stf/newpage_73884.html |
| 出典情報 | 薬事審議会 医薬品等安全対策部会(令和8年度第1回 6/18)《厚生労働省》 |
ページ画像
ダウンロードした画像を利用する際は「出典情報」を明記してください。
低解像度画像をダウンロード
プレーンテキスト
資料テキストはコンピュータによる自動処理で生成されており、完全に資料と一致しない場合があります。
テキストをコピーしてご利用いただく際は資料と付け合わせてご確認ください。
COLCHICINE FOR EARLY ACUTE GOUT FLARE
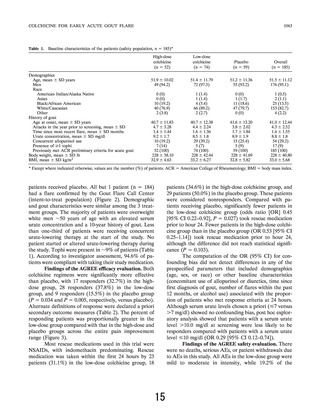
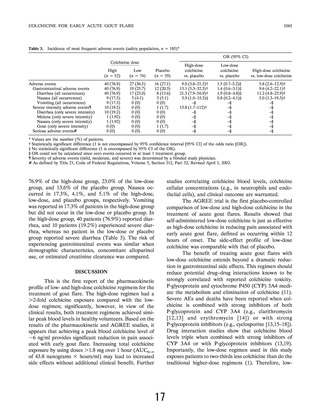
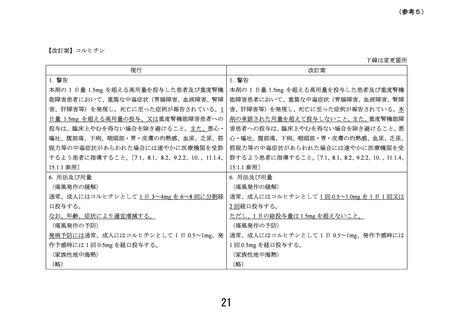
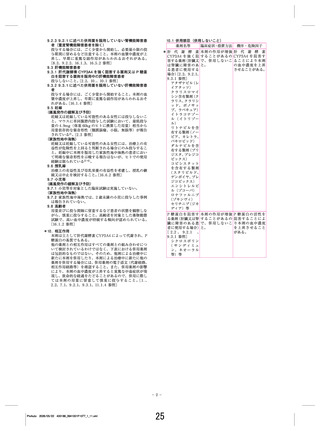
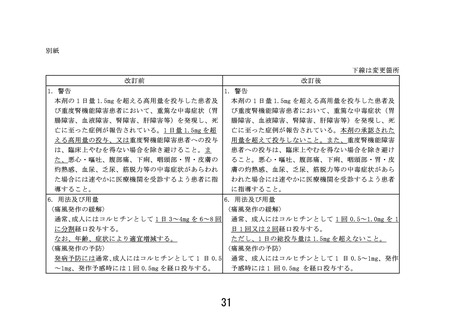
Table 3.
1065
Incidence of most frequent adverse events (safety population, n ⫽ 185)*
OR (95% CI)
Colchicine dose
Adverse events
Gastrointestinal adverse events
Diarrhea (all occurrences)
Nausea (all occurrences)
Vomiting (all occurrences)
Severe intensity adverse events¶
Diarrhea (only severe intensity)
Melena (only severe intensity)
Nausea (only severe intensity)
Gout (only severe intensity)
Serious adverse events#
High
(n ⫽ 52)
Low
(n ⫽ 74)
Placebo
(n ⫽ 59)
High-dose
colchicine
vs. placebo
Low-dose
colchicine
vs. placebo
High-dose colchicine
vs. low-dose colchicine
40 (76.9)
40 (76.9)
40 (76.9)
9 (17.3)
9 (17.3)
10 (19.2)
10 (19.2)
1 (1.92)
1 (1.92)
0 (0)
0 (0)
27 (36.5)
19 (25.7)
17 (23.0)
3 (4.1)
0 (0)
0 (0)
0 (0)
0 (0)
0 (0)
0 (0)
0 (0)
16 (27.1)
12 (20.3)
8 (13.6)
3 (5.1)
0 (0)
1 (1.7)
0 (0)
0 (0)
0 (0)
1 (1.7)
0 (0)
9.0 (3.8–21.2)†
13.1 (5.3–32.3)†
21.3 (7.9–56.9)†
3.9 (1.0–15.3)‡
–§
13.8 (1.7–112)†
–§
–§
–§
–§
–§
1.5 (0.7–3.2)‡
1.4 (0.6–3.1)‡
1.9 (0.8–4.8)‡
0.8 (0.2–4.1)‡
–§
–§
–§
–§
–§
–§
–§
5.8 (2.6–12.9)†
9.6 (4.2–22.1)†
11.2 (4.8–25.9)†
5.0 (1.3–19.3)†
–§
–§
–§
–§
–§
–§
–§
* Values are the number (%) of patients.
† Statistically significant difference (1 is not encompassed by 95% confidence interval [95% CI] of the odds ratio [OR]).
‡ No statistically significant difference (1 is encompassed by 95% CI of the OR).
§ OR could not be calculated since zero events occurred in at least 1 treatment group.
¶ Severity of adverse events (mild, moderate, and severe) was determined by a blinded study physician.
# As defined by Title 21, Code of Federal Regulations, Volume 5, Section 312, Part 32; Revised April 1, 2002.
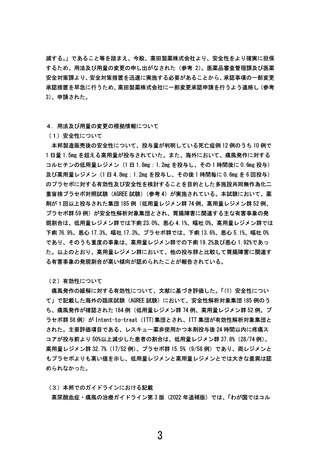
76.9% of the high-dose group, 23.0% of the low-dose
group, and 13.6% of the placebo group. Nausea occurred in 17.3%, 4.1%, and 5.1% of the high-dose,
low-dose, and placebo groups, respectively. Vomiting
was reported in 17.3% of patients in the high-dose group
but did not occur in the low-dose or placebo group. In
the high-dose group, 40 patients (76.9%) reported diarrhea, and 10 patients (19.2%) experienced severe diarrhea, whereas no patient in the low-dose or placebo
group reported severe diarrhea (Table 3). The risk of
experiencing gastrointestinal events was similar when
demographic characteristics, concomitant allopurinol
use, or estimated creatinine clearance was compared.
studies correlating colchicine blood levels, colchicine
cellular concentrations (e.g., in neutrophils and endothelial cells), and clinical outcome are warranted.
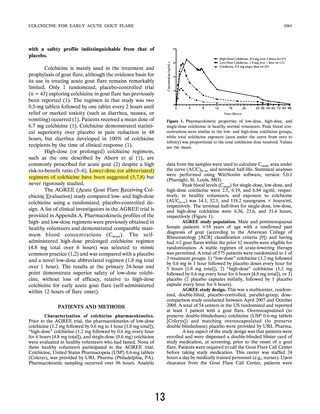
The AGREE trial is the first placebo-controlled
comparison of low-dose and high-dose colchicine in the
treatment of acute gout flares. Results showed that
self-administered low-dose colchicine is just as effective
as high-dose colchicine in reducing pain associated with
early acute gout flare, defined as occurring within 12
hours of onset. The side-effect profile of low-dose
colchicine was comparable with that of placebo.
The benefit of treating acute gout flares with
low-dose colchicine extends beyond a dramatic reduction in gastrointestinal side effects. This regimen should
reduce potential drug–drug interactions known to be
strongly correlated with reported colchicine toxicity.
P-glycoprotein and cytochrome P450 (CYP) 3A4 mediate the metabolism and elimination of colchicine (11).
Severe AEs and deaths have been reported when colchicine is combined with strong inhibitors of both
P-glycoprotein and CYP 3A4 (e.g., clarithromycin
[12,13] and erythromycin [14]) or with strong
P-glycoprotein inhibitors (e.g., cyclosporine [13,15–18]).
Drug interaction studies show that colchicine blood
levels triple when combined with strong inhibitors of
CYP 3A4 or with P-glycoprotein inhibitors (13,19).
Importantly, the low-dose regimen used in this study
exposes patients to two-thirds less colchicine than do the
traditional higher-dose regimens (1). Therefore, low-
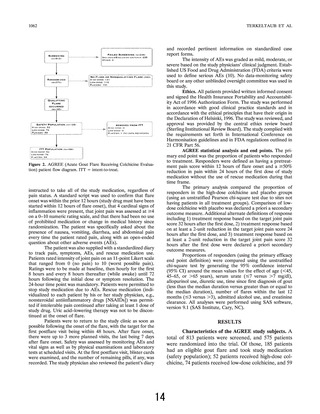
DISCUSSION
This is the first report of the pharmacokinetic
profile of low- and high-dose colchicine regimens for the
treatment of gout flare. The high-dose regimen had a
⬎2-fold colchicine exposure compared with the lowdose regimen; significantly, however, in view of the
clinical results, both treatment regimens achieved similar peak blood levels in healthy volunteers. Based on the
results of the pharmacokinetic and AGREE studies, it
appears that achieving a peak blood colchicine level of
⬃6 ng/ml provides significant reduction in pain associated with early gout flare. Increasing total colchicine
exposure by using doses ⬎1.8 mg over 1 hour (AUC0–⬁
of 43.8 nanograms ⫻ hours/ml) may lead to increased
side effects without additional clinical benefit. Further
17
Table 3.
1065
Incidence of most frequent adverse events (safety population, n ⫽ 185)*
OR (95% CI)
Colchicine dose
Adverse events
Gastrointestinal adverse events
Diarrhea (all occurrences)
Nausea (all occurrences)
Vomiting (all occurrences)
Severe intensity adverse events¶
Diarrhea (only severe intensity)
Melena (only severe intensity)
Nausea (only severe intensity)
Gout (only severe intensity)
Serious adverse events#
High
(n ⫽ 52)
Low
(n ⫽ 74)
Placebo
(n ⫽ 59)
High-dose
colchicine
vs. placebo
Low-dose
colchicine
vs. placebo
High-dose colchicine
vs. low-dose colchicine
40 (76.9)
40 (76.9)
40 (76.9)
9 (17.3)
9 (17.3)
10 (19.2)
10 (19.2)
1 (1.92)
1 (1.92)
0 (0)
0 (0)
27 (36.5)
19 (25.7)
17 (23.0)
3 (4.1)
0 (0)
0 (0)
0 (0)
0 (0)
0 (0)
0 (0)
0 (0)
16 (27.1)
12 (20.3)
8 (13.6)
3 (5.1)
0 (0)
1 (1.7)
0 (0)
0 (0)
0 (0)
1 (1.7)
0 (0)
9.0 (3.8–21.2)†
13.1 (5.3–32.3)†
21.3 (7.9–56.9)†
3.9 (1.0–15.3)‡
–§
13.8 (1.7–112)†
–§
–§
–§
–§
–§
1.5 (0.7–3.2)‡
1.4 (0.6–3.1)‡
1.9 (0.8–4.8)‡
0.8 (0.2–4.1)‡
–§
–§
–§
–§
–§
–§
–§
5.8 (2.6–12.9)†
9.6 (4.2–22.1)†
11.2 (4.8–25.9)†
5.0 (1.3–19.3)†
–§
–§
–§
–§
–§
–§
–§
* Values are the number (%) of patients.
† Statistically significant difference (1 is not encompassed by 95% confidence interval [95% CI] of the odds ratio [OR]).
‡ No statistically significant difference (1 is encompassed by 95% CI of the OR).
§ OR could not be calculated since zero events occurred in at least 1 treatment group.
¶ Severity of adverse events (mild, moderate, and severe) was determined by a blinded study physician.
# As defined by Title 21, Code of Federal Regulations, Volume 5, Section 312, Part 32; Revised April 1, 2002.
76.9% of the high-dose group, 23.0% of the low-dose
group, and 13.6% of the placebo group. Nausea occurred in 17.3%, 4.1%, and 5.1% of the high-dose,
low-dose, and placebo groups, respectively. Vomiting
was reported in 17.3% of patients in the high-dose group
but did not occur in the low-dose or placebo group. In
the high-dose group, 40 patients (76.9%) reported diarrhea, and 10 patients (19.2%) experienced severe diarrhea, whereas no patient in the low-dose or placebo
group reported severe diarrhea (Table 3). The risk of
experiencing gastrointestinal events was similar when
demographic characteristics, concomitant allopurinol
use, or estimated creatinine clearance was compared.
studies correlating colchicine blood levels, colchicine
cellular concentrations (e.g., in neutrophils and endothelial cells), and clinical outcome are warranted.
The AGREE trial is the first placebo-controlled
comparison of low-dose and high-dose colchicine in the
treatment of acute gout flares. Results showed that
self-administered low-dose colchicine is just as effective
as high-dose colchicine in reducing pain associated with
early acute gout flare, defined as occurring within 12
hours of onset. The side-effect profile of low-dose
colchicine was comparable with that of placebo.
The benefit of treating acute gout flares with
low-dose colchicine extends beyond a dramatic reduction in gastrointestinal side effects. This regimen should
reduce potential drug–drug interactions known to be
strongly correlated with reported colchicine toxicity.
P-glycoprotein and cytochrome P450 (CYP) 3A4 mediate the metabolism and elimination of colchicine (11).
Severe AEs and deaths have been reported when colchicine is combined with strong inhibitors of both
P-glycoprotein and CYP 3A4 (e.g., clarithromycin
[12,13] and erythromycin [14]) or with strong
P-glycoprotein inhibitors (e.g., cyclosporine [13,15–18]).
Drug interaction studies show that colchicine blood
levels triple when combined with strong inhibitors of
CYP 3A4 or with P-glycoprotein inhibitors (13,19).
Importantly, the low-dose regimen used in this study
exposes patients to two-thirds less colchicine than do the
traditional higher-dose regimens (1). Therefore, low-
DISCUSSION
This is the first report of the pharmacokinetic
profile of low- and high-dose colchicine regimens for the
treatment of gout flare. The high-dose regimen had a
⬎2-fold colchicine exposure compared with the lowdose regimen; significantly, however, in view of the
clinical results, both treatment regimens achieved similar peak blood levels in healthy volunteers. Based on the
results of the pharmacokinetic and AGREE studies, it
appears that achieving a peak blood colchicine level of
⬃6 ng/ml provides significant reduction in pain associated with early gout flare. Increasing total colchicine
exposure by using doses ⬎1.8 mg over 1 hour (AUC0–⬁
of 43.8 nanograms ⫻ hours/ml) may lead to increased
side effects without additional clinical benefit. Further
17