

よむ、つかう、まなぶ。
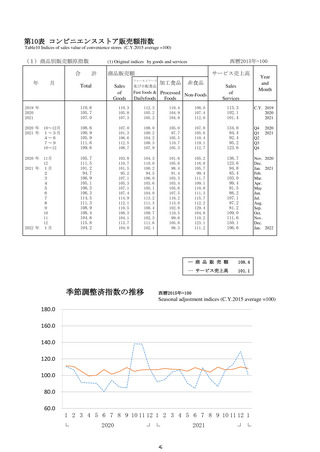
商業動態統計速報 (59 ページ)
出典
| 公開元URL | https://www.meti.go.jp/statistics/tyo/syoudou/result/sokuho_2.html |
| 出典情報 | 商業動態統計速報 2022年1月分(2/28)《経済産業省》 |
ページ画像
ダウンロードした画像を利用する際は「出典情報」を明記してください。
低解像度画像をダウンロード
プレーンテキスト
資料テキストはコンピュータによる自動処理で生成されており、完全に資料と一致しない場合があります。
テキストをコピーしてご利用いただく際は資料と付け合わせてご確認ください。
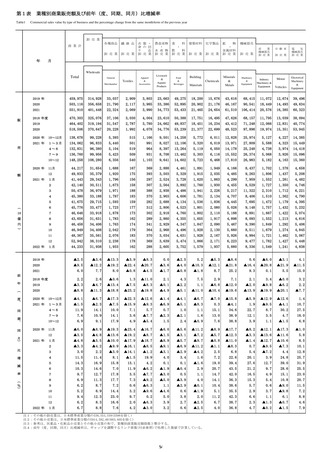
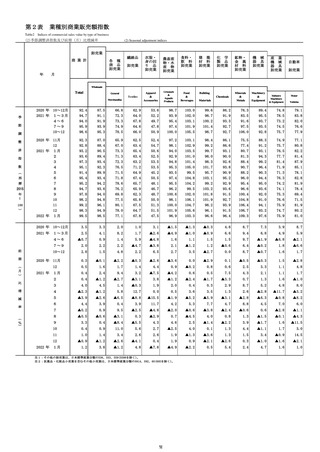
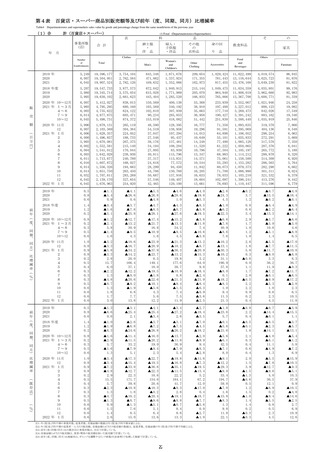
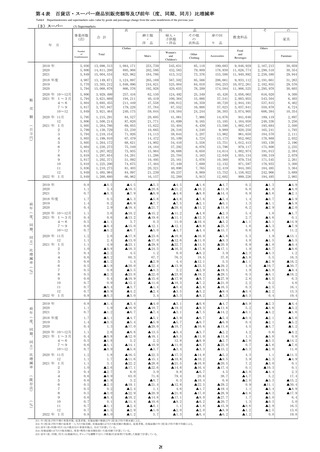
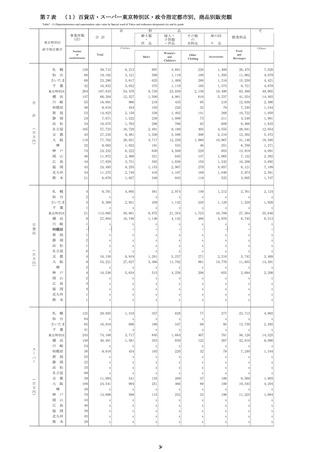
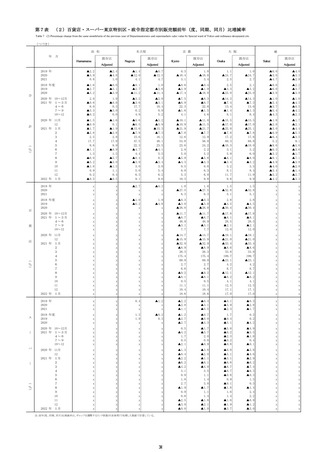
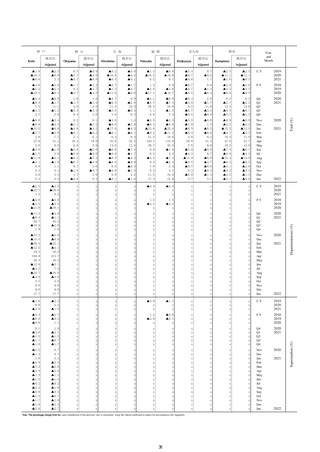
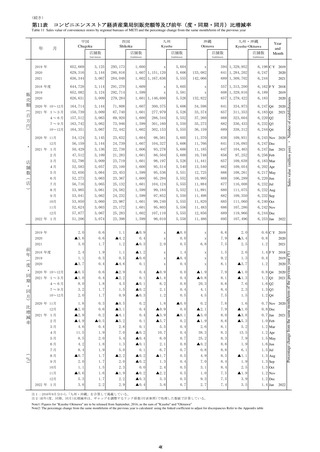
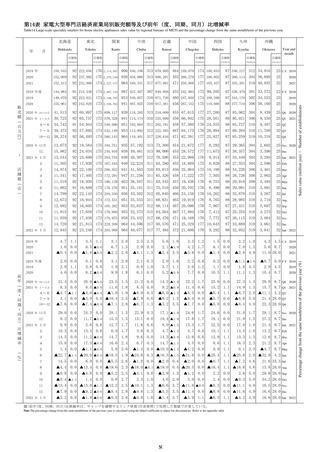
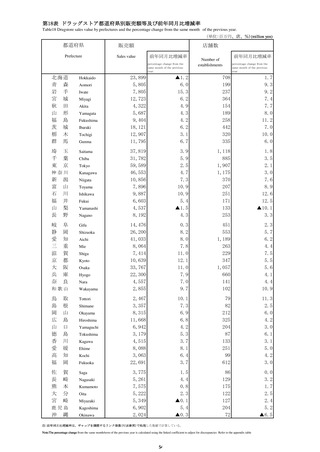
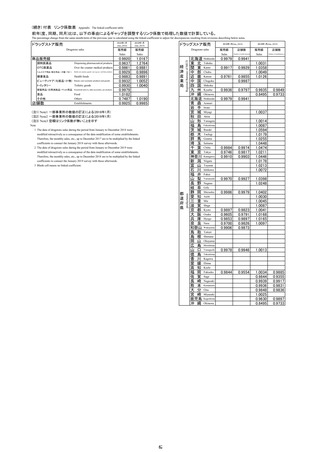
付表 リンク係数表
Appendix The linked coefficient table
前年(度、同期、同月)比は、以下の事由によるギャップを調整するリンク係数で処理した数値で計算している。
The percentage change from the same month/term of the previous year is calculated using the linked coefficient to adjust for discrepancies resulting from revisions describing below notes.
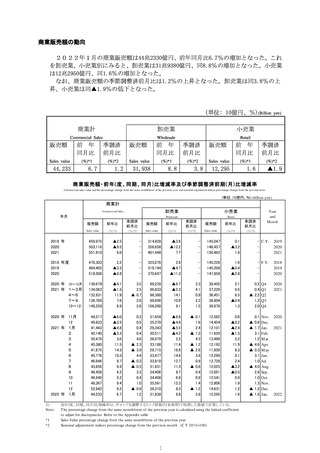
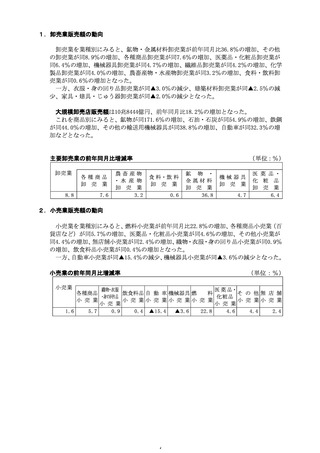
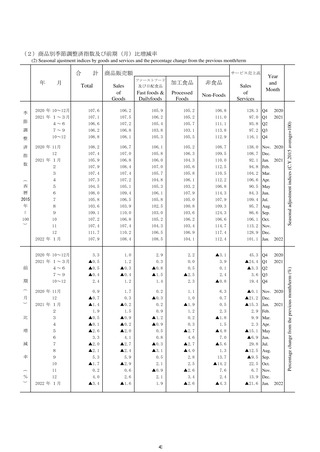
商業計
卸売業
各種商品卸売業
繊維品卸売業
衣服・身の回り品卸売業
農畜産物・水産物卸売業
食料・飲料卸売業
建築材料卸売業
化学製品卸売業
鉱物・金属材料卸売業
機械器具卸売業
産業機械器具卸売業
自動車卸売業
電気機械器具卸売業
その他の機械器具卸売業
家具・建具・じゅう器卸売業
医薬品・化粧品卸売業
その他の卸売業
小売業
各種商品小売業
織物・衣服・身の回り品小売業
飲食料品小売業
自動車小売業
機械器具小売業
燃料小売業
医薬品・化粧品小売業
その他小売業
無店舗小売業
参考
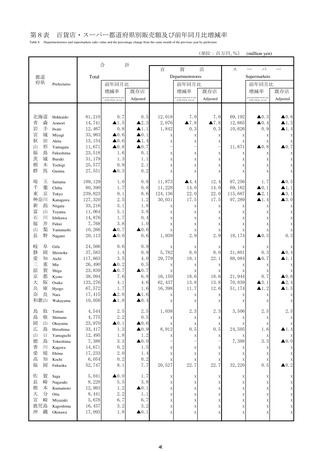
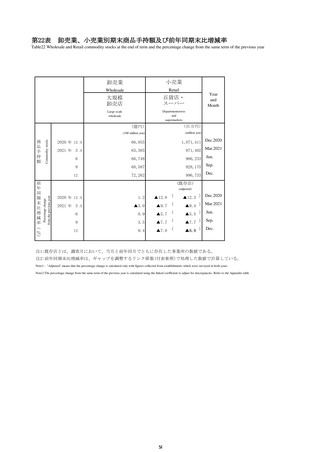
百貨店・スーパー販売
2020年3月
Commercial sales value by type of business
Total
Wholesale
General Merchandise
Textiles
Apparel & Accessories
Livestock & Aquatic Products
Food & Beverages
Building Materials
Chemicals
Minerals & Metals
Machinery & Equipment
Industry Machinery & Equ pment
Motor Vehicles
Elec orical Machinery & Equipment
Others
Furniture & House Furnishings
Medicine & Toiletries
Others
Retail
General Merchandise
Fabrics Apparel & Accessories
Food & Beverages
Motor Vehicles
Machinery & Equipment
Fuel
Medicine & Toiletry stores
Others
Nonstore retailers
Reference
Department stores and supermarkets sales
Mar.,2020
1.2501
1.3482
0.7748
0.9250
1.3855
1.5510
1.1391
1.3390
1.6468
1.4398
1.7027
2.3435
1.5703
1.5005
2.2440
2.3084
1.2017
1.2025
1.0521
1.0302
0.9329
0.9789
0.9987
1.5525
1.0229
1.4002
0.8953
1.4152
1.0663
Regional Bureaus of METI
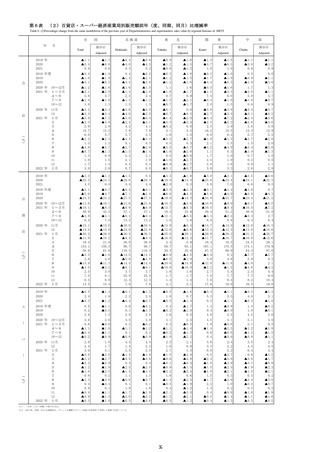
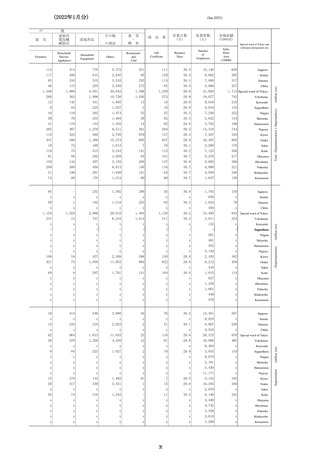
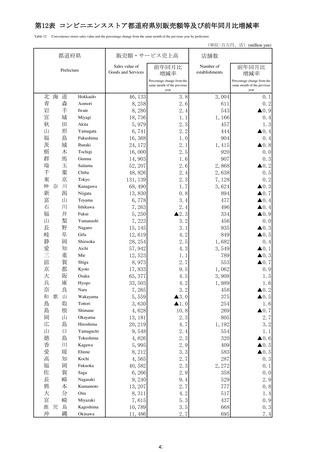
業種別商業販売
経
済
産
業
局
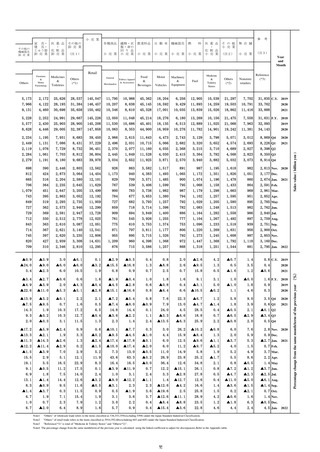
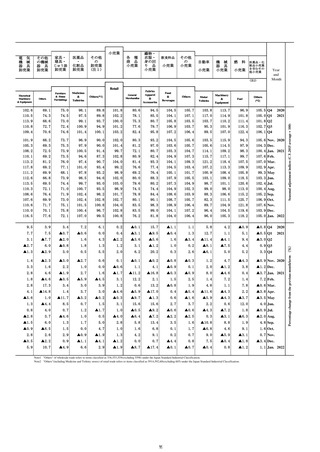
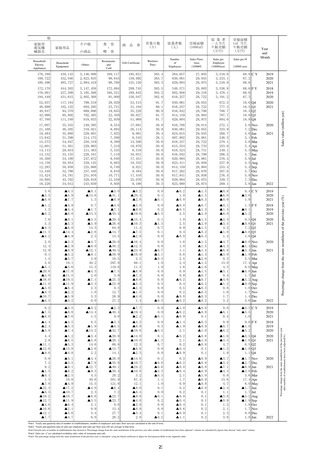
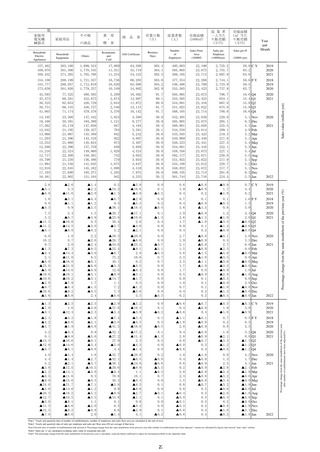
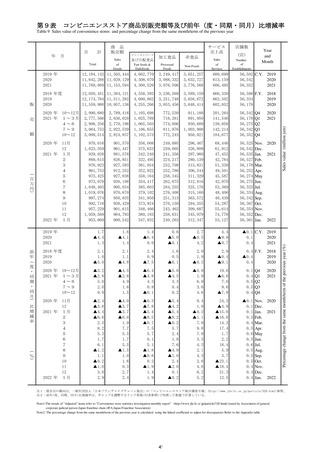
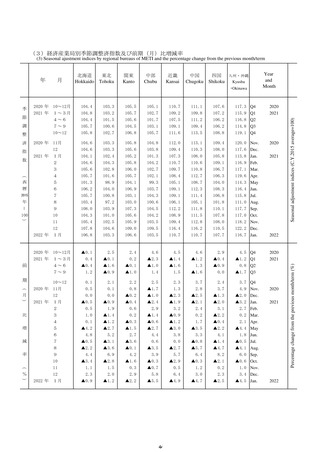
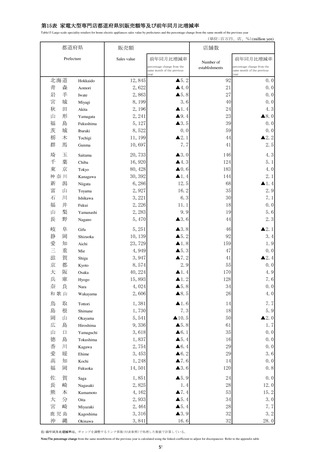
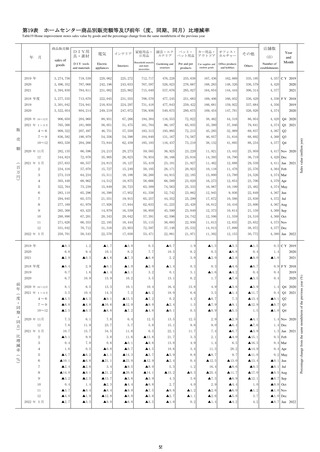
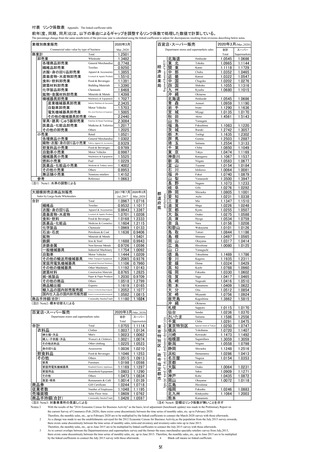
大規模卸売店商品別販売
2017年7月 2020年3月
Sales by Large-Scale Wholesalers
Total
合計
繊維品
衣服・身の回り品
農畜産物・水産物
食料・飲料
医薬品・化粧品
化学製品
石油・石炭
鉱物
鉄鋼
非鉄金属
一般機械器具
自動車
その他の輸送用機械器具
家庭用電気機械器具
その他の機械器具
建築材料
紙・紙製品
その他の商品
商品輸出額
輸入品の国内卸売販売額
国内仕入品の国内卸売販売額
商品手持額(合計)
Textiles
Apparel & Accessories
Livestock & Aquatic Products
Food & Beverages
Medicine & Cosmetics
Chemicals
Petroleum & Coal
Jul.,2017
Mar.,2020
1.0967
0.9532
0.8643
1.0701
1.0168
1.1604
1.0969
1.1636
1.0716
1.1017
1.3367
1.0208
1.2333
1.2115
1.0133
0.9406
1.5401
0.9943
1.0596
1.0092
1.0209
0.9376
0.7960
1.0143
1.2825
0.9709
1.2799
1.0165
1.1077
1.0815
1.1024
Minerals & Metals
Iron & Steel
Non-ferrous Metals
Industrial Machinery
Motor Vehicles
Other Transport Equipment
Household Electrical Machinery
Other Machinery
Construction Materials
Paper & Paper Products
Others
Exports
Domest cwholesaleofimportedgoods
Domest cwholesaleofdomesticgoods
Commodity Stocks(Total)
1.1688
0.9726
1.1754
1.1444
1.2065
1.1106
1.1192
0.8765
1.2030
1.0518
1.1619
1.2052
1.0582
1.1180
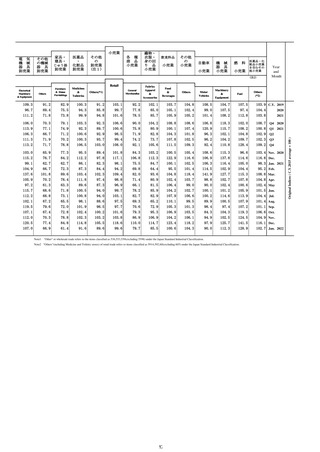
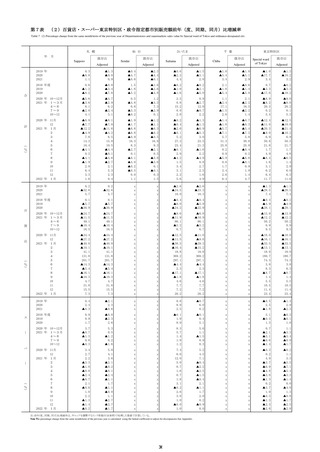
都
道
府
県
prefectures
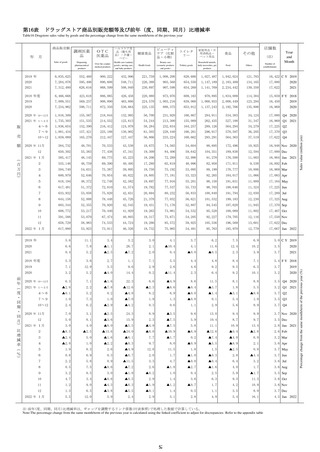
(注1) Note1: 水準の調整による
(注2) Note2: 標本切替えによる
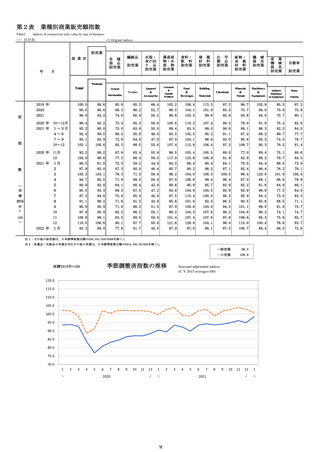
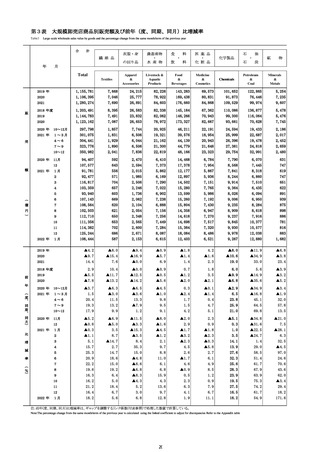
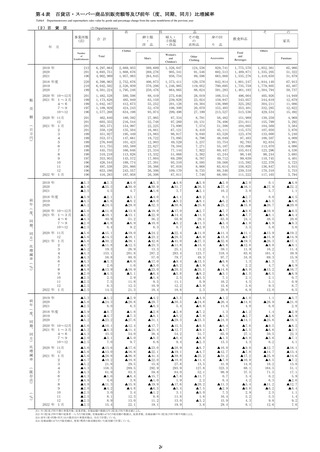
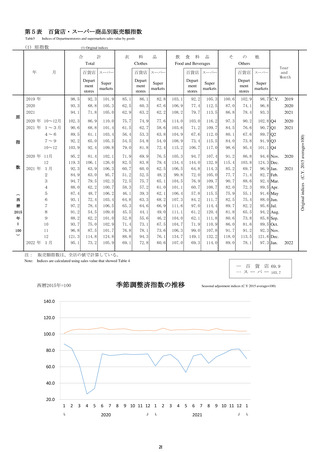
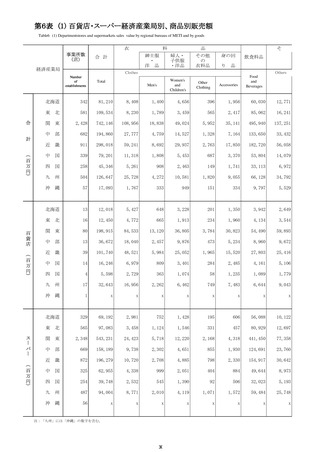
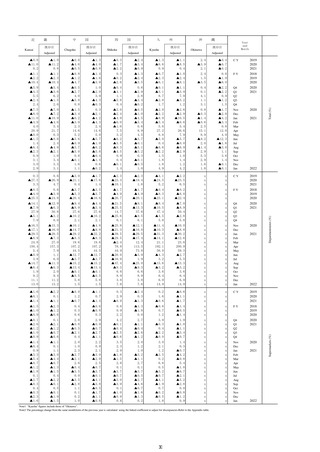
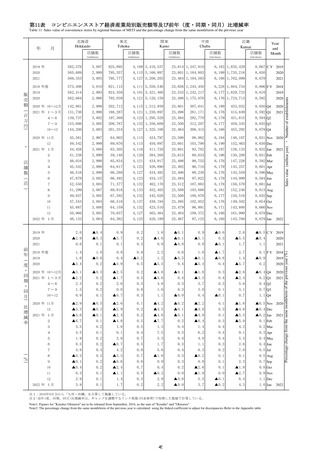
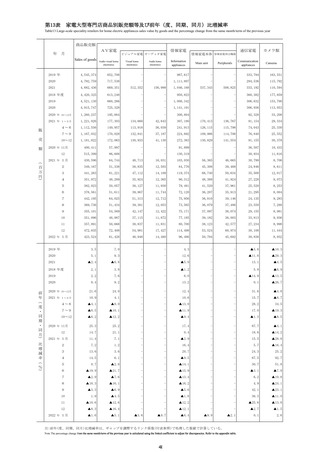
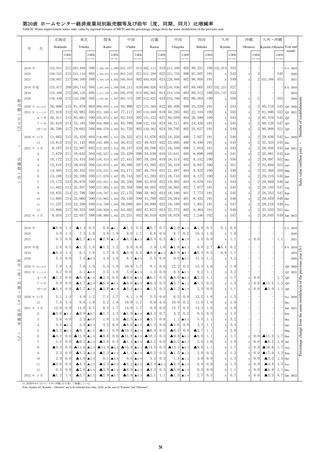
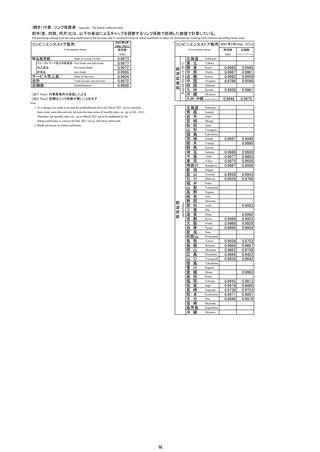
Department stores and supermarkets sales
合計
衣料品
Total
Clothes
紳士服・洋品
Men's
婦人・子供服・洋品
Women's & Children's
その他衣料品
Other clothing
身の回り品
Accessories
飲食料品
その他
Food & Beverages
Others
家具
Furniture
家庭用電気機械器具
Houshold Electric Appliances
家庭用品
Household Equipment
その他
Others
食堂・喫茶
Restaurants & Café
商品券
従業者数
売場面積
商品手持額(合計)
Gift Certificate
Number of Employees
Sales Floor Area
Commodity Stocks(Total)
合計
Total
1.0755
1.0037
1.0023
1.0021
1.0225
1.0036
1.1046
1.0515
1.0198
1.1169
1.0803
1.0473
1.0014
1.0244
1.1048
1.0609
1.0426
スーパー
Supermarkets
1.1114
1.0134
1.0062
1.0074
1.0523
1.0210
1.1253
1.0913
1.0598
1.1297
1.1290
1.0834
1.0139
1.0718
1.1195
1.0762
1.0597
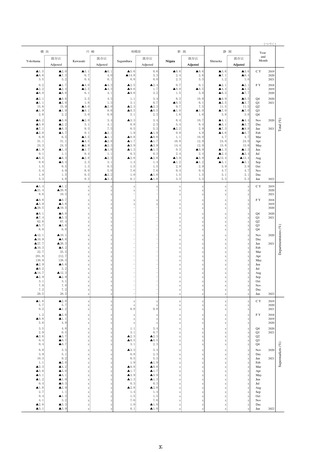
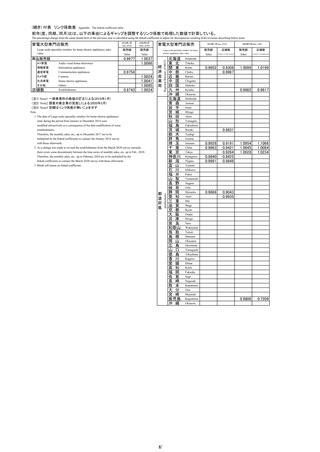
東
京
特
別
区
・
政
令
指
定
都
市
Special ward of Tokyo and ordinance-designated city
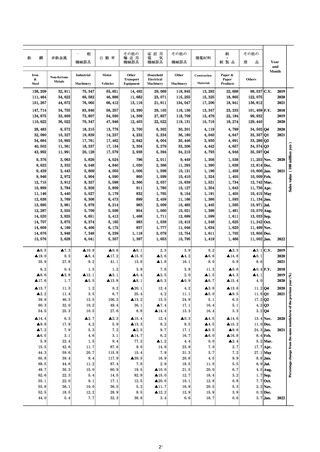
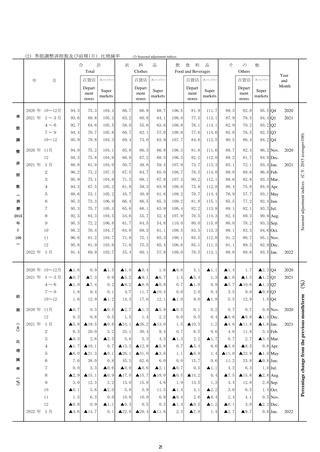
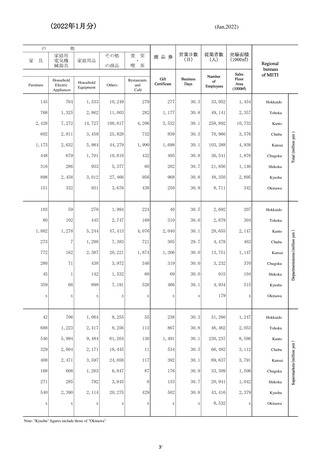
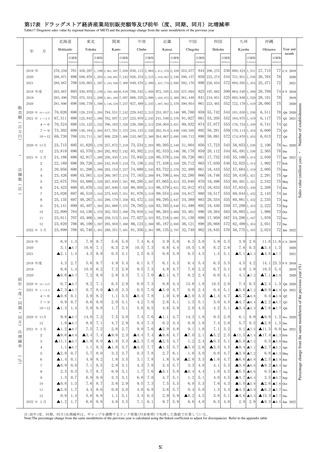
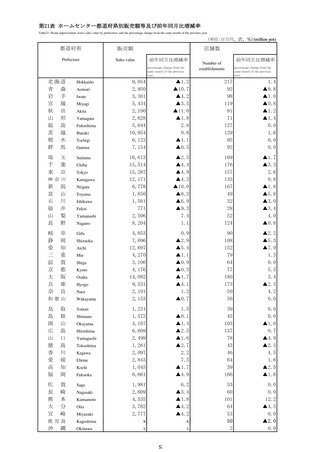
2020年3月(Mar.,2020)
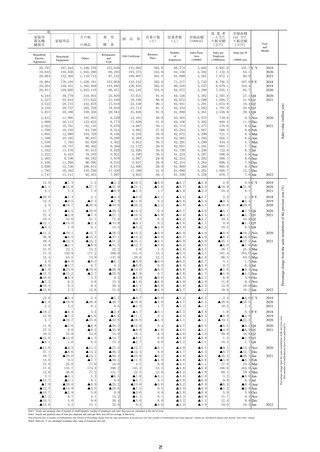
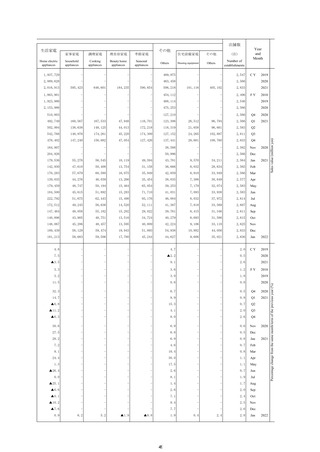
百貨店・スーパー販売
北海道
東 北
関 東
中 部
近 畿
中 国
四 国
九 州
沖 縄
北海道
青 森
岩 手
宮 城
秋 田
山 形
福 島
茨 城
栃 木
群 馬
埼 玉
千 葉
東 京
神奈川
新 潟
富 山
石 川
福 井
山 梨
長 野
岐 阜
静 岡
愛 知
三 重
滋 賀
京 都
大 阪
兵 庫
奈 良
和歌山
鳥 取
島 根
岡 山
広 島
山 口
徳 島
香 川
愛 媛
高 知
福 岡
佐 賀
長 崎
熊 本
大 分
宮 崎
鹿児島
沖 縄
札幌
仙台
さいたま
千葉
東京特別区
横浜
川崎
相模原
新潟
静岡
浜松
名古屋
京都
大阪
堺
神戸
岡山
広島
福岡
北九州
熊本
Hokkaido
Tohoku
Kanto
Chubu
Kansai
Chugoku
Shikoku
Kyushu
2020年3月(Mar.,2020)
合計
Total
スーパー
Supermarkets
1.0545
1.0965
1.1118
1.0352
1.0322
1.0202
1.1055
1.0680
1.0686
1.1144
1.1729
1.0465
1.0547
1.0276
1.1316
1.1015
1.0545
1.0959
1.1290
1.0135
1.4561
1.0686
1.1190
1.1636
1.0170
1.5143
1.1083
1.2742
1.1635
1.2503
1.2554
1.0850
1.0474
1.1067
1.0583
1.0154
1.0064
1.0740
1.3500
1.1073
1.0276
1.0805
1.0231
1.1347
1.0226
1.0255
1.0275
1.0534
1.0156
1.0101
1.0844
1.0497
1.0317
1.0080
1.1220
1.3057
1.2302
1.2887
1.3133
1.1049
1.1169
1.1537
1.0677
1.0184
1.0081
1.0879
1.3947
1.1233
1.0292
1.1001
1.0338
1.1510
1.0248
1.0507
1.0588
1.0759
1.0208
1.0126
1.1186
1.0565
1.0414
1.0125
1.1489
1.1935
1.0324
1.0788
1.0330
1.0417
1.0416
1.0409
1.0512
1.0756
1.3862
1.1786
1.2311
1.0429
1.0960
1.0602
1.0465
1.0510
1.0622
1.0854
1.0924
1.5815
1.0115
1.0236
1.1586
1.0291
1.0250
1.0720
1.1473
1.3059
1.0558
1.1248
1.0286
1.0154
1.0170
1.0370
1.2556
1.0475
1.0747
1.1407
1.1492
1.3059
1.0798
1.2516
1.0413
1.0353
1.0064
1.0909
1.0435
1.0072
1.0231
1.1271
1.0872
1.0118
1.0246
1.1064
1.0883
1.2003
Okinawa
Hokkaido
Aomori
Iwate
Miyagi
Akita
Yamagata
Fukushima
Ibaraki
Tochigi
Gunma
Saitama
Chiba
Tokyo
Kanagawa
Niigata
Toyama
Ishikawa
Fukui
Yamanashi
Nagano
Gifu
Shizuoka
Aichi
Mie
Shiga
Kyoto
Osaka
Hyogo
Nara
Wakayama
Tottori
Shimane
Okayama
Hiroshima
Yamaguchi
Tokushima
Kagawa
Ehime
Kochi
Fukuoka
Saga
Nagasaki
Kumamoto
Oita
Miyazaki
Kagoshima
Okinawa
Sapporo
Sendai
Saitama
Chiba
Special ward of Tokyo
Yokohama
Kawasaki
Sagamihara
Niigata
Shizuoka
Hamamatsu
Nagoya
Kyoto
Osaka
Sakai
Kobe
Okayama
Hiroshima
Fukuoka
Kitakyushu
Kumamoto
(注3) Note3: 対象事業所の見直しによる
(注4) Note4: 空欄はリンク係数が無いことを示す
With the results of the "2016 Economic Census for Business Activity" as the basis, level adjustment (benchmark update) was made in the Preliminary Report on
Notes:1
2
3
the current Survey of Commerce (Feb.,2020), there exists some discontinuity between the time series of monthly sales, etc. up to February 2020.
Therefore, the monthly sales, etc., up to February 2020 are to be multiplied by the linked coefficients to connect the March 2020 survey with those afterwards.
As a change was made to use the establishments surveyed for the 2012 Economic Census for Business Activity,as the population from the July 2015 survey onwards,
there exists some discontinuity between the time series of monthly sales, term-end inventory and inventory-sales ratio up to June 2015.
Therefore, the monthly sales, etc., up to June 2015 are to be multiplied by linked coefficients to connect the July 2015 survey with those afterwards.
As to correct overlaps between the Departmentstores and supermarkets survey and the former the mass merchandise specialty retailers survey from July,2015,
there exists some discontinuity between the time series of monthly sales, etc. up to June 2015. Therefore, the monthly sales, etc., up to June 2015 are to be multiplied
by the linked coefficients to connect the July 2015 survey with those afterwards.
4
Blank cell means no linked coefficient.
59
Appendix The linked coefficient table
前年(度、同期、同月)比は、以下の事由によるギャップを調整するリンク係数で処理した数値で計算している。
The percentage change from the same month/term of the previous year is calculated using the linked coefficient to adjust for discrepancies resulting from revisions describing below notes.
商業計
卸売業
各種商品卸売業
繊維品卸売業
衣服・身の回り品卸売業
農畜産物・水産物卸売業
食料・飲料卸売業
建築材料卸売業
化学製品卸売業
鉱物・金属材料卸売業
機械器具卸売業
産業機械器具卸売業
自動車卸売業
電気機械器具卸売業
その他の機械器具卸売業
家具・建具・じゅう器卸売業
医薬品・化粧品卸売業
その他の卸売業
小売業
各種商品小売業
織物・衣服・身の回り品小売業
飲食料品小売業
自動車小売業
機械器具小売業
燃料小売業
医薬品・化粧品小売業
その他小売業
無店舗小売業
参考
百貨店・スーパー販売
2020年3月
Commercial sales value by type of business
Total
Wholesale
General Merchandise
Textiles
Apparel & Accessories
Livestock & Aquatic Products
Food & Beverages
Building Materials
Chemicals
Minerals & Metals
Machinery & Equipment
Industry Machinery & Equ pment
Motor Vehicles
Elec orical Machinery & Equipment
Others
Furniture & House Furnishings
Medicine & Toiletries
Others
Retail
General Merchandise
Fabrics Apparel & Accessories
Food & Beverages
Motor Vehicles
Machinery & Equipment
Fuel
Medicine & Toiletry stores
Others
Nonstore retailers
Reference
Department stores and supermarkets sales
Mar.,2020
1.2501
1.3482
0.7748
0.9250
1.3855
1.5510
1.1391
1.3390
1.6468
1.4398
1.7027
2.3435
1.5703
1.5005
2.2440
2.3084
1.2017
1.2025
1.0521
1.0302
0.9329
0.9789
0.9987
1.5525
1.0229
1.4002
0.8953
1.4152
1.0663
Regional Bureaus of METI
業種別商業販売
経
済
産
業
局
大規模卸売店商品別販売
2017年7月 2020年3月
Sales by Large-Scale Wholesalers
Total
合計
繊維品
衣服・身の回り品
農畜産物・水産物
食料・飲料
医薬品・化粧品
化学製品
石油・石炭
鉱物
鉄鋼
非鉄金属
一般機械器具
自動車
その他の輸送用機械器具
家庭用電気機械器具
その他の機械器具
建築材料
紙・紙製品
その他の商品
商品輸出額
輸入品の国内卸売販売額
国内仕入品の国内卸売販売額
商品手持額(合計)
Textiles
Apparel & Accessories
Livestock & Aquatic Products
Food & Beverages
Medicine & Cosmetics
Chemicals
Petroleum & Coal
Jul.,2017
Mar.,2020
1.0967
0.9532
0.8643
1.0701
1.0168
1.1604
1.0969
1.1636
1.0716
1.1017
1.3367
1.0208
1.2333
1.2115
1.0133
0.9406
1.5401
0.9943
1.0596
1.0092
1.0209
0.9376
0.7960
1.0143
1.2825
0.9709
1.2799
1.0165
1.1077
1.0815
1.1024
Minerals & Metals
Iron & Steel
Non-ferrous Metals
Industrial Machinery
Motor Vehicles
Other Transport Equipment
Household Electrical Machinery
Other Machinery
Construction Materials
Paper & Paper Products
Others
Exports
Domest cwholesaleofimportedgoods
Domest cwholesaleofdomesticgoods
Commodity Stocks(Total)
1.1688
0.9726
1.1754
1.1444
1.2065
1.1106
1.1192
0.8765
1.2030
1.0518
1.1619
1.2052
1.0582
1.1180
都
道
府
県
prefectures
(注1) Note1: 水準の調整による
(注2) Note2: 標本切替えによる
Department stores and supermarkets sales
合計
衣料品
Total
Clothes
紳士服・洋品
Men's
婦人・子供服・洋品
Women's & Children's
その他衣料品
Other clothing
身の回り品
Accessories
飲食料品
その他
Food & Beverages
Others
家具
Furniture
家庭用電気機械器具
Houshold Electric Appliances
家庭用品
Household Equipment
その他
Others
食堂・喫茶
Restaurants & Café
商品券
従業者数
売場面積
商品手持額(合計)
Gift Certificate
Number of Employees
Sales Floor Area
Commodity Stocks(Total)
合計
Total
1.0755
1.0037
1.0023
1.0021
1.0225
1.0036
1.1046
1.0515
1.0198
1.1169
1.0803
1.0473
1.0014
1.0244
1.1048
1.0609
1.0426
スーパー
Supermarkets
1.1114
1.0134
1.0062
1.0074
1.0523
1.0210
1.1253
1.0913
1.0598
1.1297
1.1290
1.0834
1.0139
1.0718
1.1195
1.0762
1.0597
東
京
特
別
区
・
政
令
指
定
都
市
Special ward of Tokyo and ordinance-designated city
2020年3月(Mar.,2020)
百貨店・スーパー販売
北海道
東 北
関 東
中 部
近 畿
中 国
四 国
九 州
沖 縄
北海道
青 森
岩 手
宮 城
秋 田
山 形
福 島
茨 城
栃 木
群 馬
埼 玉
千 葉
東 京
神奈川
新 潟
富 山
石 川
福 井
山 梨
長 野
岐 阜
静 岡
愛 知
三 重
滋 賀
京 都
大 阪
兵 庫
奈 良
和歌山
鳥 取
島 根
岡 山
広 島
山 口
徳 島
香 川
愛 媛
高 知
福 岡
佐 賀
長 崎
熊 本
大 分
宮 崎
鹿児島
沖 縄
札幌
仙台
さいたま
千葉
東京特別区
横浜
川崎
相模原
新潟
静岡
浜松
名古屋
京都
大阪
堺
神戸
岡山
広島
福岡
北九州
熊本
Hokkaido
Tohoku
Kanto
Chubu
Kansai
Chugoku
Shikoku
Kyushu
2020年3月(Mar.,2020)
合計
Total
スーパー
Supermarkets
1.0545
1.0965
1.1118
1.0352
1.0322
1.0202
1.1055
1.0680
1.0686
1.1144
1.1729
1.0465
1.0547
1.0276
1.1316
1.1015
1.0545
1.0959
1.1290
1.0135
1.4561
1.0686
1.1190
1.1636
1.0170
1.5143
1.1083
1.2742
1.1635
1.2503
1.2554
1.0850
1.0474
1.1067
1.0583
1.0154
1.0064
1.0740
1.3500
1.1073
1.0276
1.0805
1.0231
1.1347
1.0226
1.0255
1.0275
1.0534
1.0156
1.0101
1.0844
1.0497
1.0317
1.0080
1.1220
1.3057
1.2302
1.2887
1.3133
1.1049
1.1169
1.1537
1.0677
1.0184
1.0081
1.0879
1.3947
1.1233
1.0292
1.1001
1.0338
1.1510
1.0248
1.0507
1.0588
1.0759
1.0208
1.0126
1.1186
1.0565
1.0414
1.0125
1.1489
1.1935
1.0324
1.0788
1.0330
1.0417
1.0416
1.0409
1.0512
1.0756
1.3862
1.1786
1.2311
1.0429
1.0960
1.0602
1.0465
1.0510
1.0622
1.0854
1.0924
1.5815
1.0115
1.0236
1.1586
1.0291
1.0250
1.0720
1.1473
1.3059
1.0558
1.1248
1.0286
1.0154
1.0170
1.0370
1.2556
1.0475
1.0747
1.1407
1.1492
1.3059
1.0798
1.2516
1.0413
1.0353
1.0064
1.0909
1.0435
1.0072
1.0231
1.1271
1.0872
1.0118
1.0246
1.1064
1.0883
1.2003
Okinawa
Hokkaido
Aomori
Iwate
Miyagi
Akita
Yamagata
Fukushima
Ibaraki
Tochigi
Gunma
Saitama
Chiba
Tokyo
Kanagawa
Niigata
Toyama
Ishikawa
Fukui
Yamanashi
Nagano
Gifu
Shizuoka
Aichi
Mie
Shiga
Kyoto
Osaka
Hyogo
Nara
Wakayama
Tottori
Shimane
Okayama
Hiroshima
Yamaguchi
Tokushima
Kagawa
Ehime
Kochi
Fukuoka
Saga
Nagasaki
Kumamoto
Oita
Miyazaki
Kagoshima
Okinawa
Sapporo
Sendai
Saitama
Chiba
Special ward of Tokyo
Yokohama
Kawasaki
Sagamihara
Niigata
Shizuoka
Hamamatsu
Nagoya
Kyoto
Osaka
Sakai
Kobe
Okayama
Hiroshima
Fukuoka
Kitakyushu
Kumamoto
(注3) Note3: 対象事業所の見直しによる
(注4) Note4: 空欄はリンク係数が無いことを示す
With the results of the "2016 Economic Census for Business Activity" as the basis, level adjustment (benchmark update) was made in the Preliminary Report on
Notes:1
2
3
the current Survey of Commerce (Feb.,2020), there exists some discontinuity between the time series of monthly sales, etc. up to February 2020.
Therefore, the monthly sales, etc., up to February 2020 are to be multiplied by the linked coefficients to connect the March 2020 survey with those afterwards.
As a change was made to use the establishments surveyed for the 2012 Economic Census for Business Activity,as the population from the July 2015 survey onwards,
there exists some discontinuity between the time series of monthly sales, term-end inventory and inventory-sales ratio up to June 2015.
Therefore, the monthly sales, etc., up to June 2015 are to be multiplied by linked coefficients to connect the July 2015 survey with those afterwards.
As to correct overlaps between the Departmentstores and supermarkets survey and the former the mass merchandise specialty retailers survey from July,2015,
there exists some discontinuity between the time series of monthly sales, etc. up to June 2015. Therefore, the monthly sales, etc., up to June 2015 are to be multiplied
by the linked coefficients to connect the July 2015 survey with those afterwards.
4
Blank cell means no linked coefficient.
59