

よむ、つかう、まなぶ。
商業動態統計速報 (51 ページ)
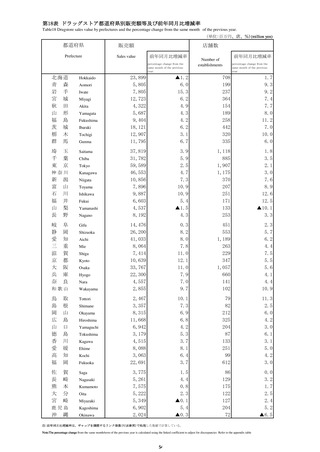
出典
| 公開元URL | https://www.meti.go.jp/statistics/tyo/syoudou/result/sokuho_2.html |
| 出典情報 | 商業動態統計速報 2022年1月分(2/28)《経済産業省》 |
ページ画像
ダウンロードした画像を利用する際は「出典情報」を明記してください。
低解像度画像をダウンロード
プレーンテキスト
資料テキストはコンピュータによる自動処理で生成されており、完全に資料と一致しない場合があります。
テキストをコピーしてご利用いただく際は資料と付け合わせてご確認ください。
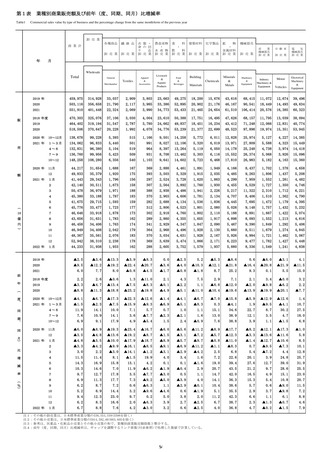
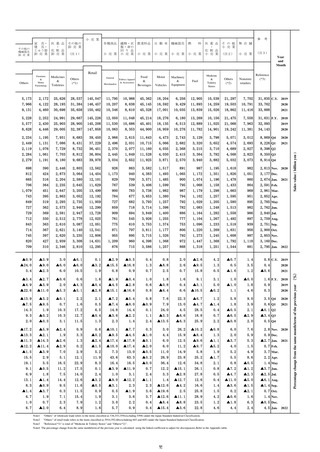
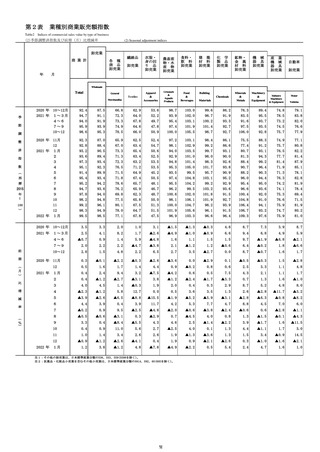
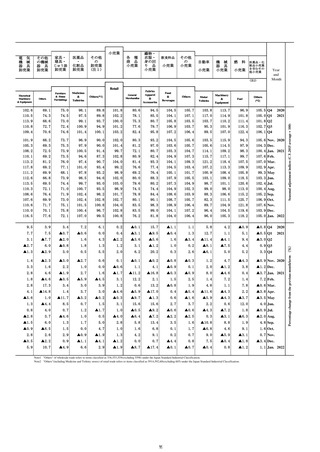
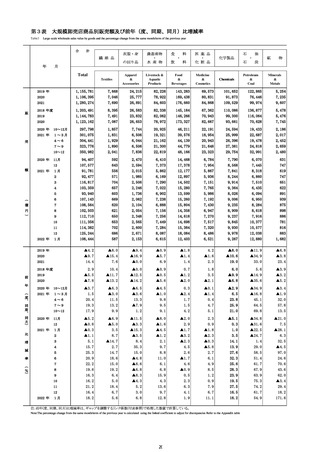
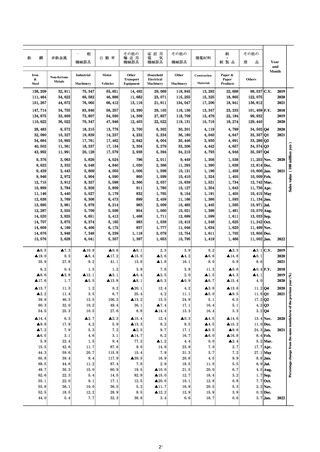
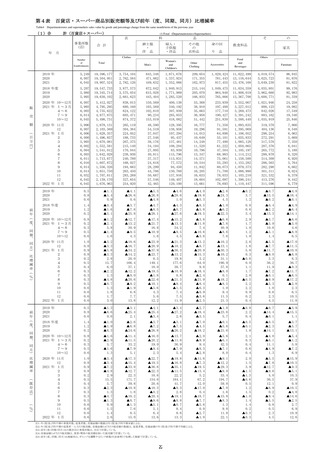
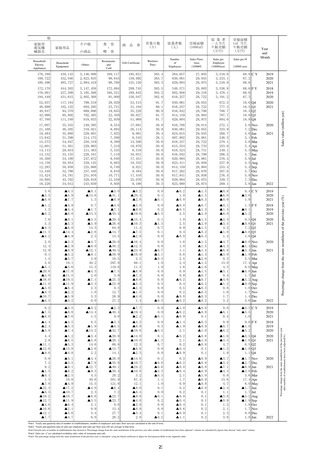
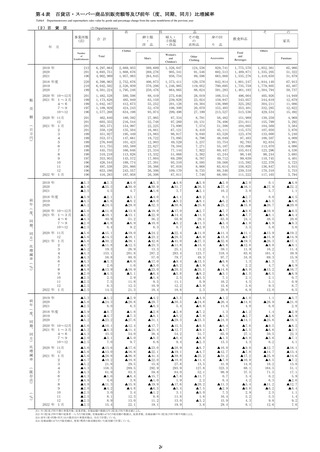
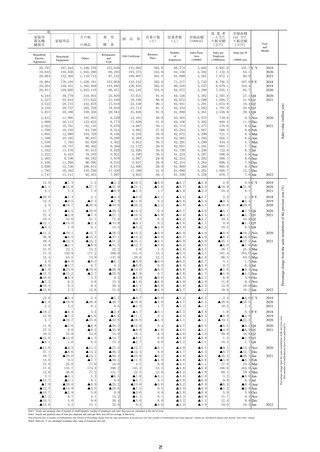
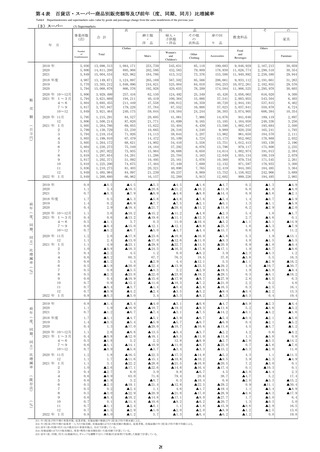
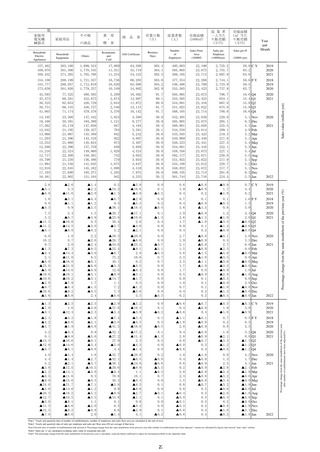
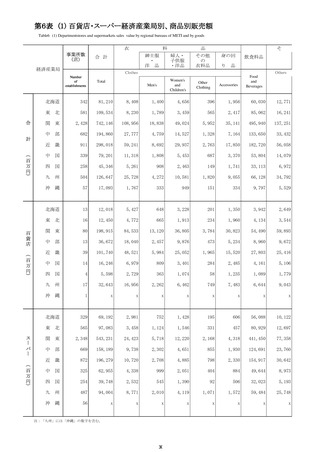
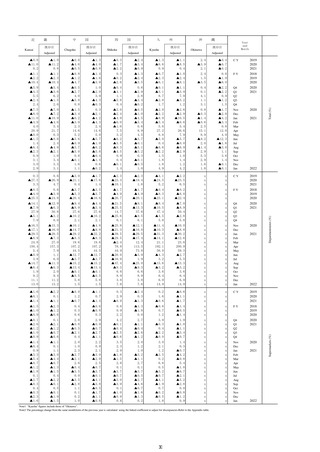
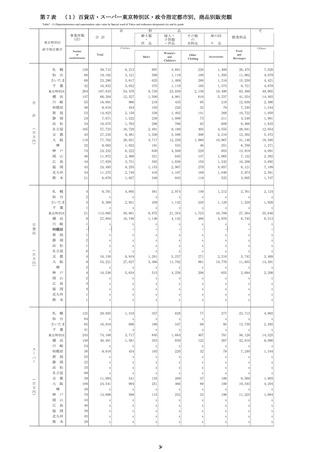
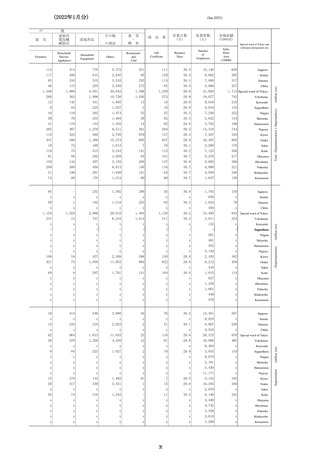
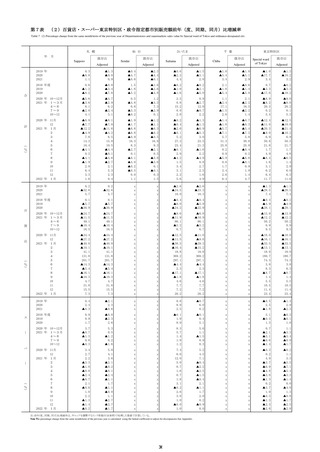
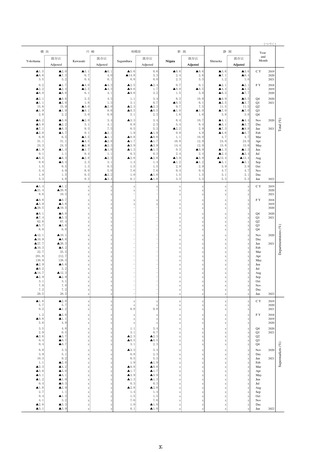
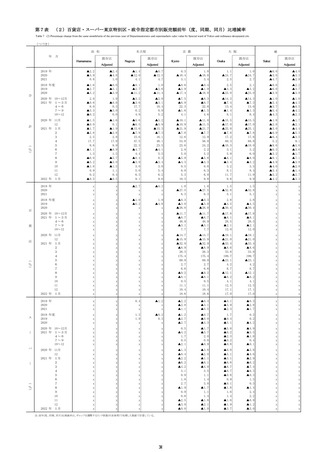
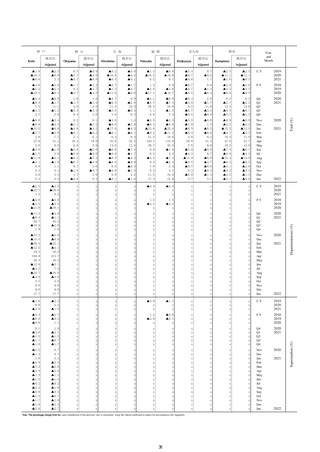
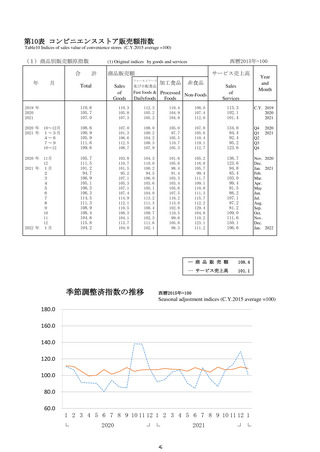
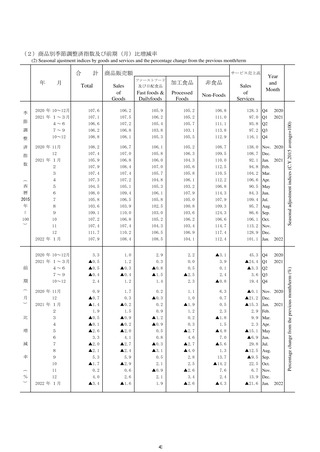
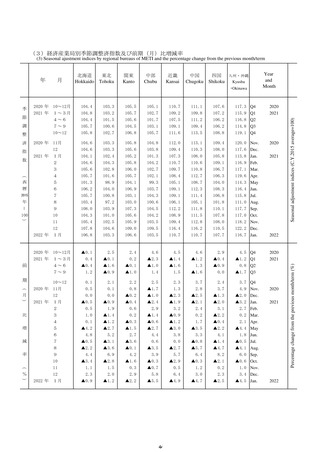
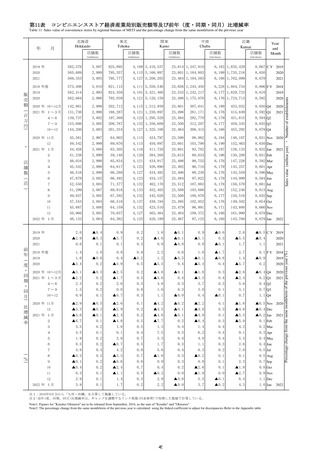
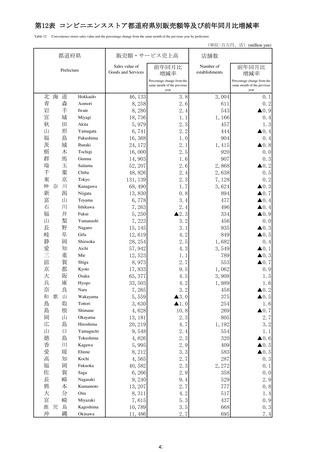
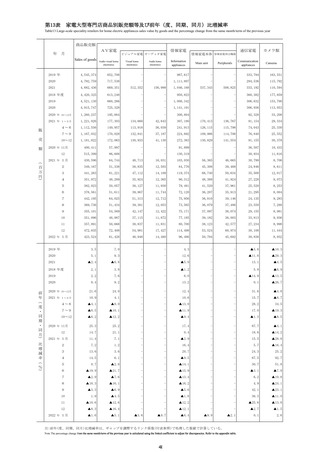
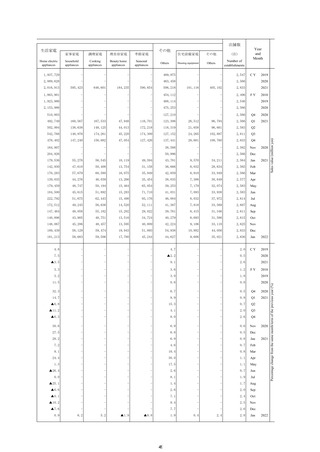
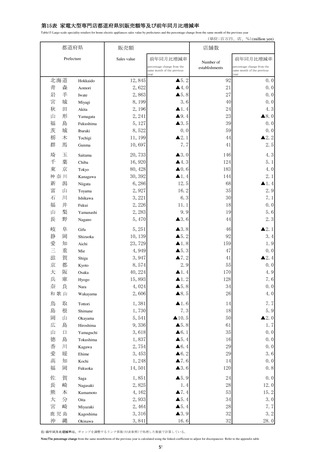
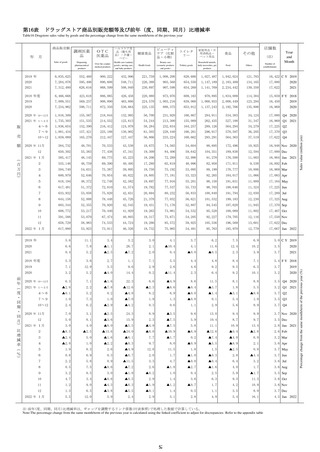
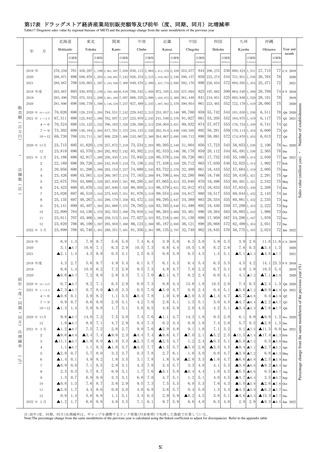
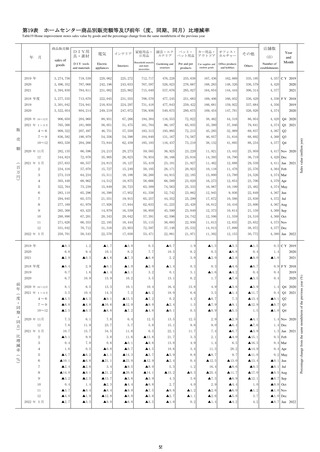
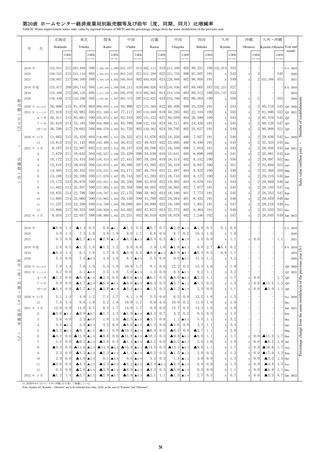
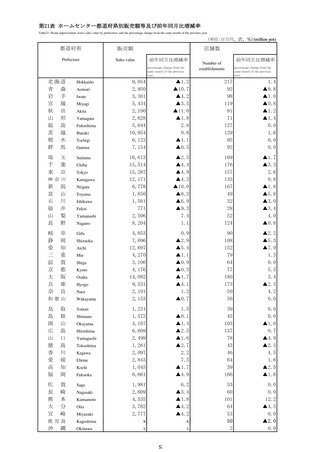
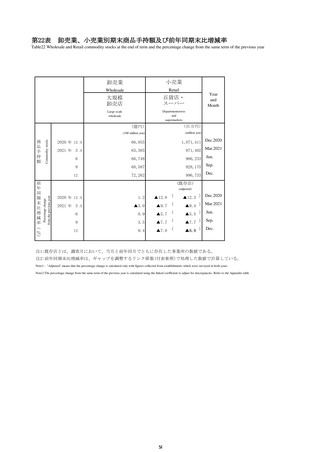
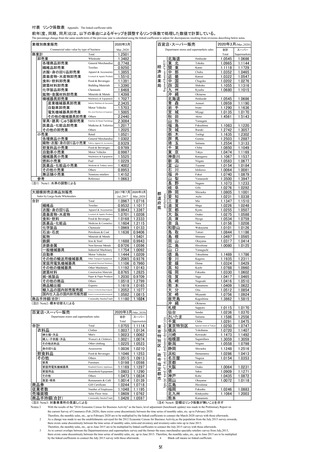
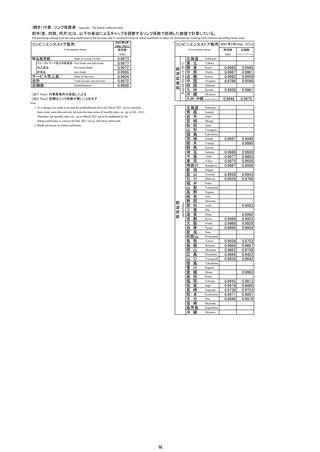
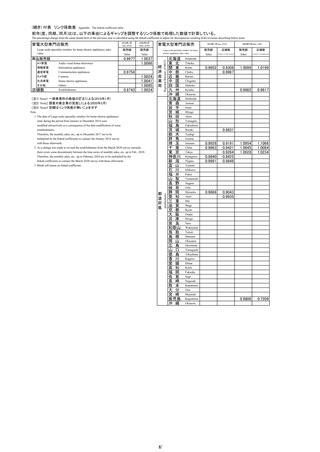
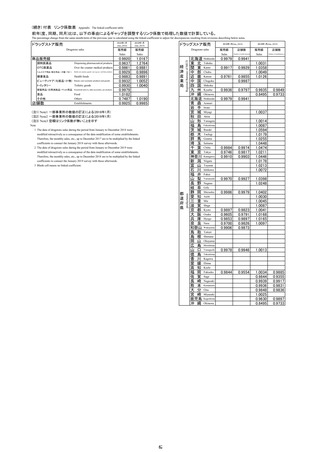
第15表 家電大型専門店都道府県別販売額等及び前年同月比増減率
Table15 Large-scale speciality retailers for home electric appliances sales value by prefectures and the percentage change from the same month of the previous year
(単位:百万円、店、%)(million yen)
都道府県
販売額
Prefecture
Sales value
店舗数
前年同月比増減率
percentage change from the
same month of the previous
year
北海道
青 森
岩 手
宮 城
秋 田
山 形
福 島
茨 城
栃 木
群 馬
Hokkaido
埼
千
東
Saitama
玉
葉
京
Aomori
Iwate
Miyagi
Akita
Yamagata
Fukushima
Ibaraki
Tochigi
Gunma
Chiba
Tokyo
神奈川
Kanagawa
新
富
石
福
山
長
潟
山
川
井
梨
野
Niigata
岐
静
愛
三
滋
京
大
兵
奈
阜
岡
知
重
賀
都
阪
庫
良
Gifu
Toyama
Ishikawa
Fukui
Yamanashi
Nagano
Shizuoka
Aichi
Mie
Shiga
Kyoto
Osaka
Hyogo
Nara
和歌山
Wakayama
鳥
島
岡
広
山
徳
香
愛
高
福
取
根
山
島
口
島
川
媛
知
岡
Tottori
佐
長
熊
大
宮
賀
崎
本
分
崎
Saga
Shimane
Okayama
Hiroshima
Yamaguchi
Tokushima
Kagawa
Ehime
Kochi
Fukuoka
Nagasaki
Kumamoto
Oita
Miyazaki
鹿児島
Kagoshima
沖
Okinawa
縄
前年同月比増減率
Number of
establishments
percentage change from the
same month of the previous
year
12,845
2,622
2,863
8,199
2,196
2,241
5,127
8,522
11,199
10,697
▲5.2
▲4.0
▲5.8
3.6
▲1.4
▲9.4
▲3.5
0.0
▲2.1
7.7
92
21
27
40
24
23
39
59
44
41
0.0
0.0
0.0
0.0
4.3
▲8.0
0.0
0.0
▲2.2
2.5
20,733
16,920
80,428
30,392
6,286
2,927
3,221
2,226
2,283
5,470
▲3.0
▲4.3
▲0.6
▲1.4
12.5
16.2
6.3
11.1
9.9
▲3.6
146
124
183
144
68
35
30
18
19
44
4.3
5.1
4.0
2.1
▲1.4
2.9
7.1
0.0
5.6
2.3
5,251
10,139
23,729
4,949
3,947
8,574
40,224
15,893
4,024
2,606
▲3.8
▲5.2
▲1.8
▲5.3
▲7.2
2.9
▲1.4
▲1.2
▲5.8
▲8.5
46
92
159
47
41
55
170
128
34
26
▲2.1
3.4
1.9
0.0
▲2.4
0.0
4.9
7.6
0.0
4.0
1,381
1,730
5,541
9,336
3,618
1,837
2,754
3,453
1,248
14,501
▲1.6
7.3
▲10.5
▲5.8
▲6.1
▲5.4
▲6.4
▲6.2
▲7.6
▲3.6
14
18
50
61
35
16
29
29
14
120
7.7
5.9
▲2.0
1.7
0.0
0.0
0.0
3.6
0.0
0.8
1,851
2,825
4,162
2,933
2,464
3,316
3,841
▲5.9
1.4
▲7.4
▲5.4
▲5.4
▲3.9
16.6
24
28
53
34
28
32
32
0.0
12.0
15.2
3.0
7.7
3.2
28.0
注:前年同月比増減率は、ギャップを調整するリンク係数(付表参照)で処理した数値で計算している。
Note:The percentage change from the same month/term of the previous year is calculated using the linked coefficient to adjust for discrepancies Refer to the appendix table
51