
よむ、つかう、まなぶ。
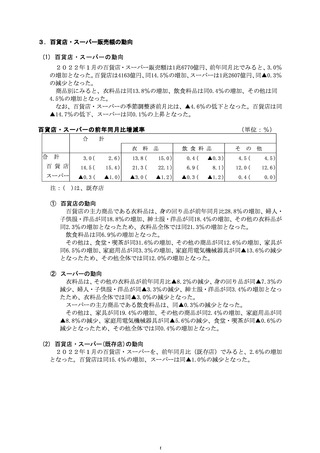
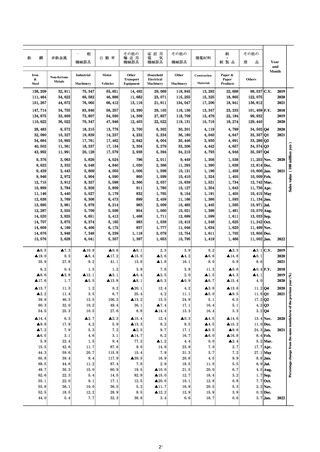
商業動態統計速報 (52 ページ)
出典
| 公開元URL | https://www.meti.go.jp/statistics/tyo/syoudou/result/sokuho_2.html |
| 出典情報 | 商業動態統計速報 2022年1月分(2/28)《経済産業省》 |
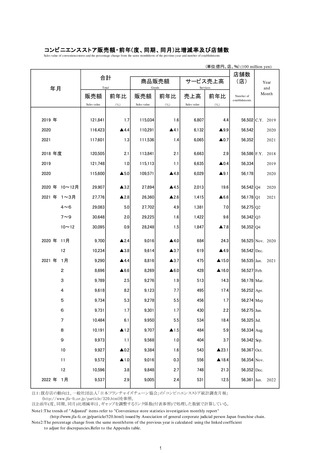
ページ画像
ダウンロードした画像を利用する際は「出典情報」を明記してください。
低解像度画像をダウンロード
プレーンテキスト
資料テキストはコンピュータによる自動処理で生成されており、完全に資料と一致しない場合があります。
テキストをコピーしてご利用いただく際は資料と付け合わせてご確認ください。
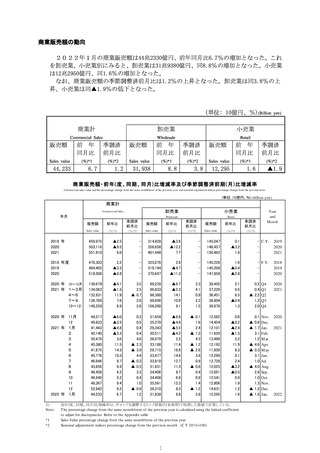
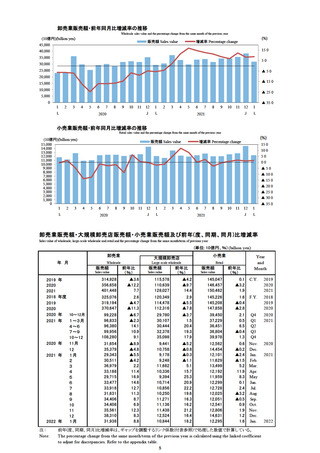
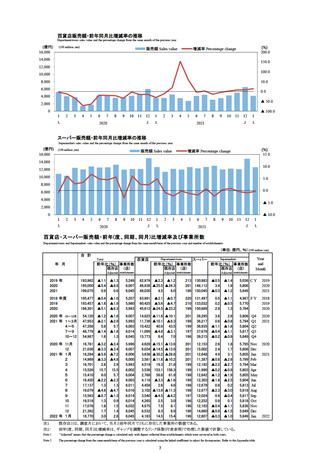
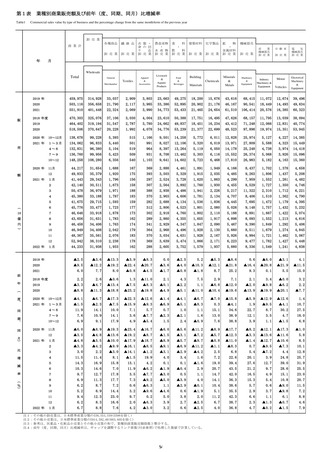
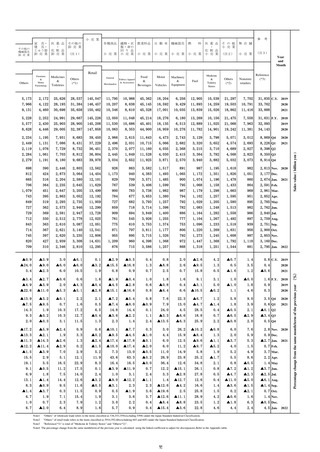
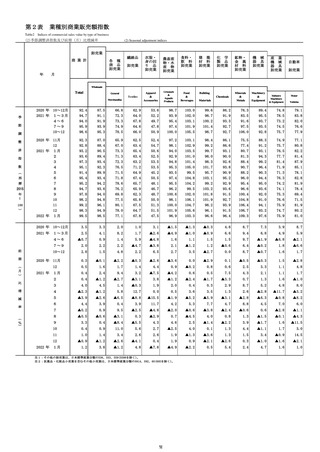
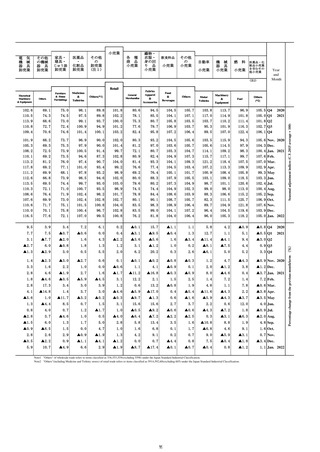
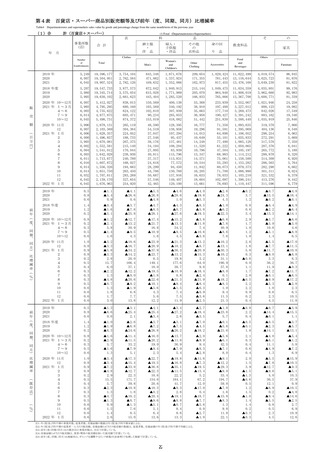
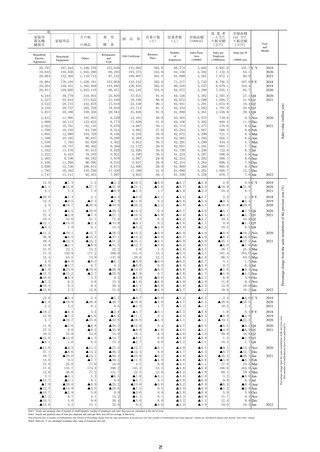
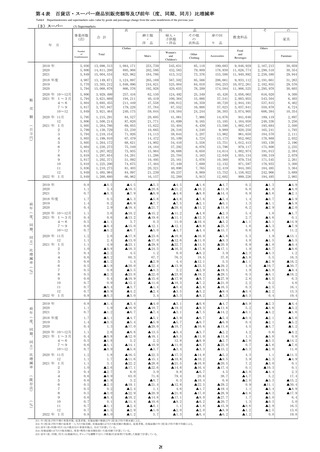
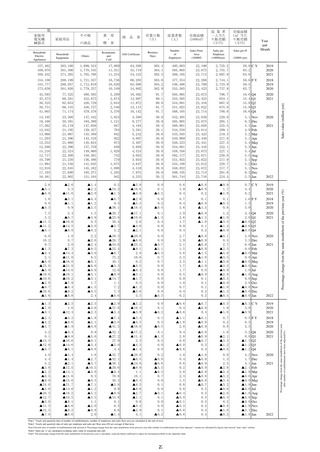
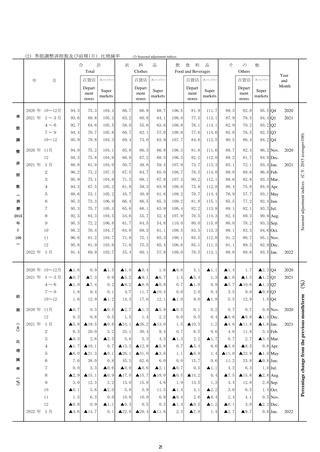
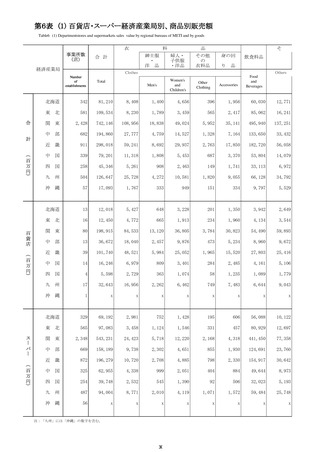
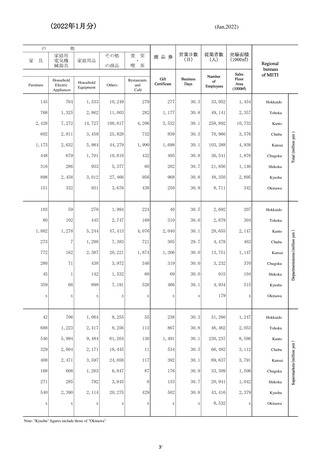
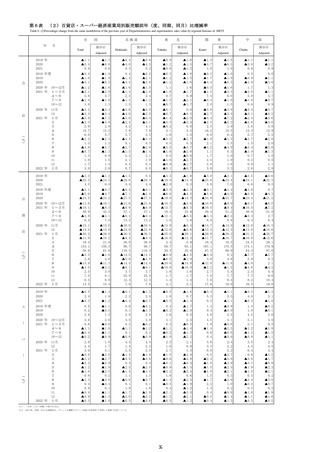
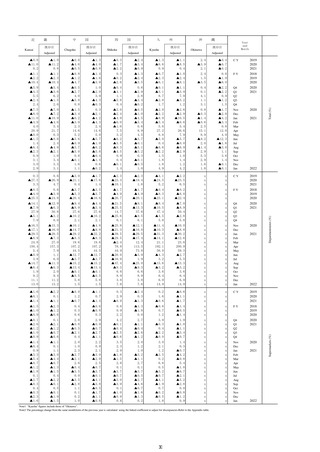
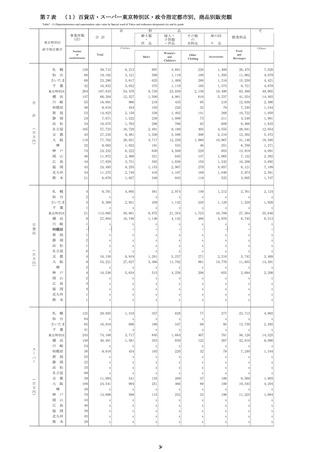
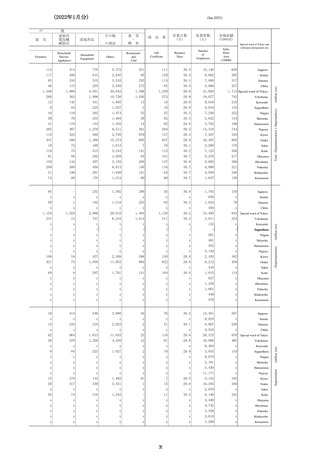
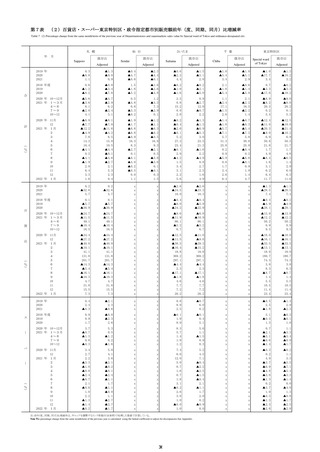
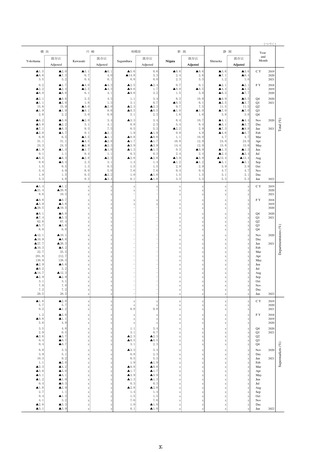
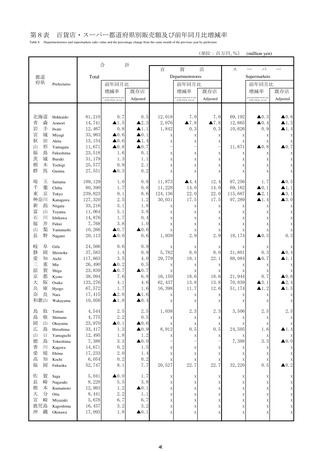
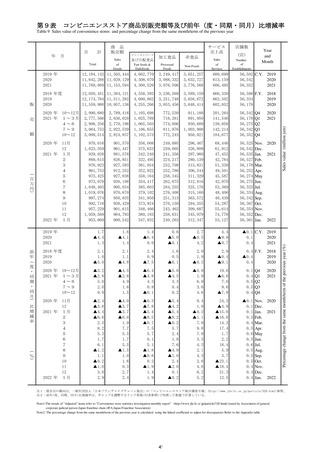
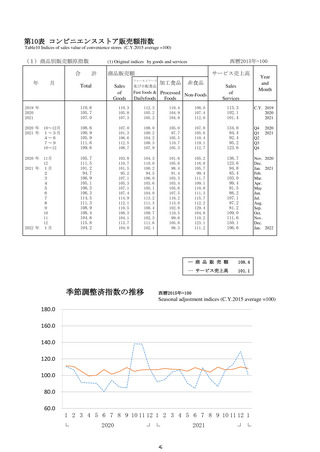
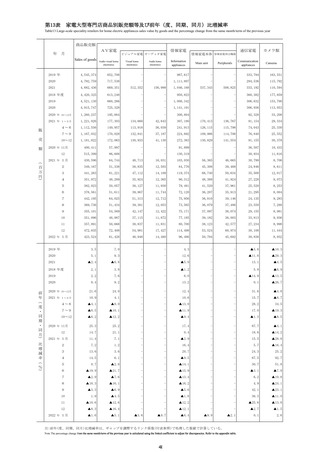
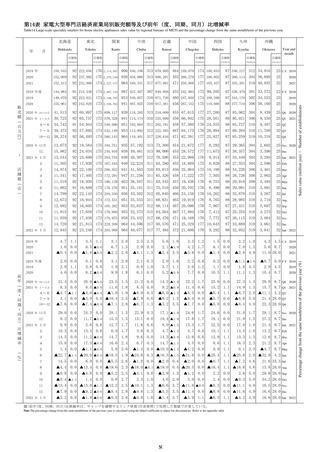
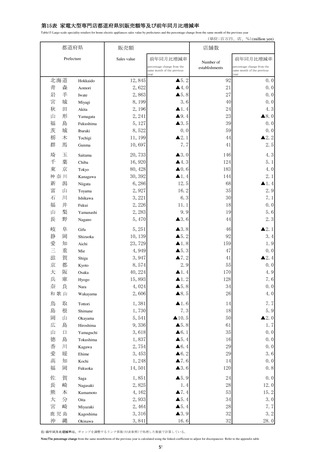
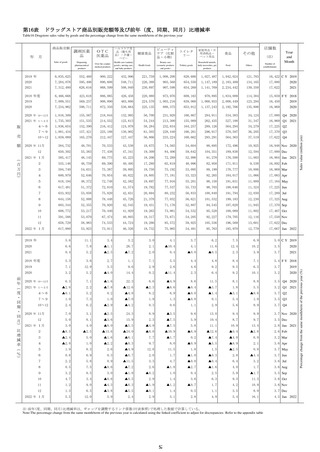
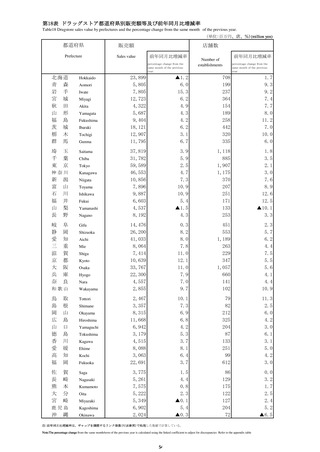
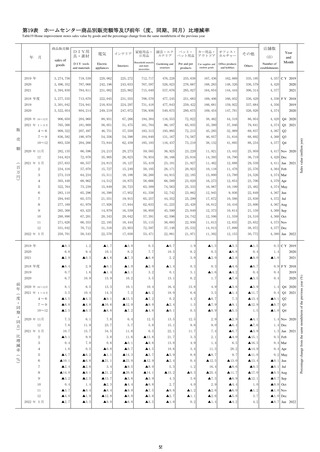
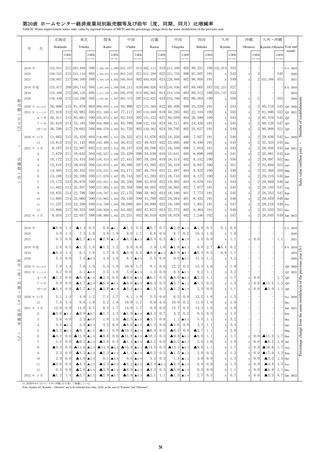
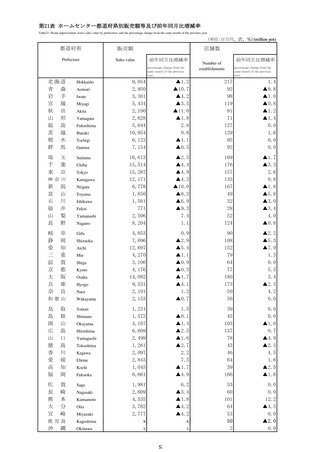
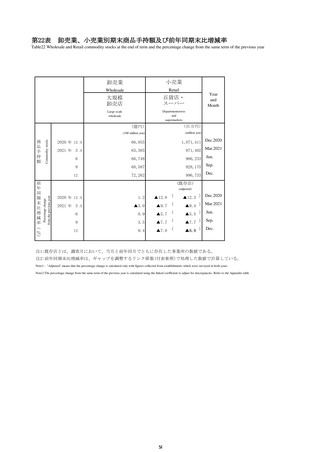
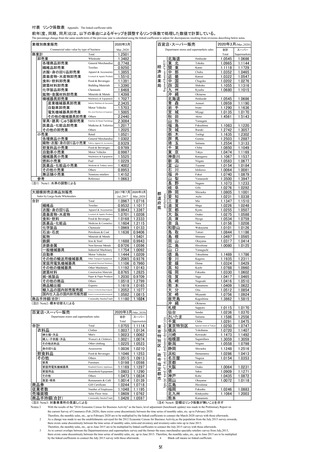
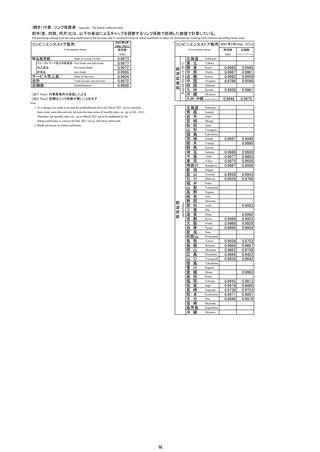
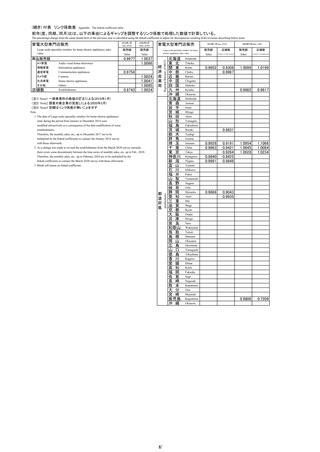
第16表
ドラッグストア商品別販売額等及び前年(度、同期、同月)比増減率
Table16 Drugstore sales value by goods and the percentage change from the same month/term of the previous year
月
Sales of goods
ビューティ
ケア(化粧
品・小物)
トイレタ
リー
家庭用品・日
用消耗品・
ペット用品
食品
その他
Dispensing
pharmaceutical
products
Over the counter
medical products
Health care (sanitary
goods), nursing care,
and baby products
Health foods
Beauty care
(cosmetic products
and goods)
Toiletry goods
Household utensils,
daily necessities, pet
products
Food
Others
(店)
Number of
establishments
Year
and
Month
6,835,625
552,460
900,222
432,996
221,759
1,008,208
628,686
1,027,487
1,942,024
121,783
16,422 C Y 2019
7,284,078
595,498
890,608
548,711
226,388
903,560
654,550
1,147,189
2,183,409
134,165
17,000
2020
2021
7,312,480
626,616
868,599
508,940
230,897
907,598
654,269
1,141,769
2,234,442
139,350
17,622
2021
2018 年度
6,466,668
423,618
886,085
426,458
220,080
973,976
609,163
978,895
1,834,009
114,384
15,859 F Y 2018
2019
7,009,551
569,237
908,890
463,886
224,578
1,003,216
639,068
1,068,933
2,008,449
123,294
16,450
2019
2020
7,234,962
598,711
872,350
530,664
225,135
888,375
653,912
1,137,243
2,192,766
135,806
16,969
2020
2020 年
10~12月
1,816,309
155,567
218,844
132,993
56,700
231,920
166,867
284,911
534,383
34,124
17,000 Q4 2020
2021 年
1~3月
1,735,303
151,535
214,552
125,613
54,244
213,300
155,089
262,435
527,188
31,347
16,969 Q1 2021
4~6
1,836,654
152,390
216,412
124,978
58,284
232,634
164,257
289,126
564,294
34,279
17,225 Q2
7~9
1,881,434
157,421
225,188
130,902
61,503
228,440
166,261
296,917
578,597
36,205
17,370 Q3
10~12
1,859,089
165,270
212,447
127,447
56,866
233,224
168,662
293,291
564,363
37,519
17,622 Q4
584,732
48,701
70,533
43,538
18,675
74,565
54,604
90,695
172,496
10,925
16,948 Nov 2020
650,302
55,383
77,438
47,341
19,309
84,406
59,642
104,351
189,838
12,594
17,000 Dec
585,417
48,145
69,775
45,223
18,206
72,289
52,998
91,278
176,500
11,003
16,904 Jan 2021
2
555,146
48,759
69,390
40,495
17,280
65,819
48,996
82,958
171,911
9,538
16,892 Feb
3
594,740
54,631
75,387
39,895
18,758
75,192
53,095
88,199
178,777
10,806
16,969 Mar
4
600,979
52,646
70,854
40,822
18,805
77,181
53,323
92,265
184,017
11,066
17,083 Apr
5
618,194
48,372
72,748
42,582
19,697
77,916
55,201
98,158
191,631
11,889
17,164 May
6
617,481
51,372
72,810
41,574
19,782
77,537
55,733
98,703
188,646
11,324
17,225 Jun
7
633,932
53,058
75,820
42,631
20,694
80,232
56,833
100,840
191,794
12,030
17,289 Jul
8
644,158
52,008
78,448
45,726
21,378
77,032
56,621
101,532
199,183
12,230
17,325 Aug
9
603,344
52,355
70,920
42,545
19,431
71,176
52,807
94,545
187,620
11,945
17,370 Sep
10
608,772
53,217
70,440
41,920
19,263
73,981
54,532
95,528
188,089
11,802
17,467 Oct
11
591,588
53,070
67,474
40,803
18,317
73,671
54,205
92,227
179,705
12,116
17,550 Nov
12
658,729
58,983
74,533
44,724
19,286
85,572
59,925
105,536
196,569
13,601
17,622 Dec
617,880
53,923
73,911
46,326
18,732
75,985
54,491
95,763
185,970
12,779
17,667 Jan 2022
2019 年
5.6
11.1
3.4
3.2
3.0
4.1
3.7
6.2
7.5
6.9
5.0 C Y 2019
2020
6.6
7.8
▲1.1
26.7
2.1
▲10.4
4.1
11.6
12.4
10.2
3.5
2020
2021
0.4
5.2
▲2.5
▲7.2
2.0
0.4
▲0.0
▲0.5
2.3
3.9
3.7
2021
2018 年度
5.3
3.6
2.7
1.1
7.1
5.5
4.4
4.8
8.4
7.1
5.4 F Y 2018
2019
7.1
12.9
3.5
9.6
2.9
2.6
4.6
9.2
9.5
6.3
3.7
2019
2020
3.2
5.2
▲4.0
14.4
0.2
▲11.4
2.3
6.4
9.2
10.1
3.2
2020
2020 年 11月
12
2021 年 1月
2022 年 1月
前
年
(
度
・
同
期
・
同
月
)
比
増
減
率
(
%
)
健康食品
2020
売
(
百
万
円
)
ヘルスケア用
品(衛生用
品)・介護・
ベビー
2019 年
販
額
OTC
医薬品
2020 年
10~12月
6.3
7.1
▲1.6
22.3
6.6
▲4.9
8.6
11.5
8.1
8.8
3.5 Q4 2020
2021 年
1~3月
▲2.8
2.2
▲7.8
▲12.6
▲2.3
▲6.6
▲0.4
▲3.7
1.8
5.5
3.2 Q1 2021
4~6
▲0.1
5.2
0.2
▲4.8
8.2
6.9
▲0.0
▲1.4
▲3.1
▲0.6
3.7 Q2
7~9
1.9
7.3
1.0
▲7.0
1.9
1.3
▲0.8
0.1
5.4
1.0
3.5 Q3
10~12
2.4
6.2
▲2.9
▲4.2
0.3
0.6
1.1
2.9
5.6
9.9
3.7 Q4
7.0
3.1
▲2.5
24.3
8.9
▲3.5
9.6
13.0
9.4
9.9
3.7 Nov 2020
5.0
8.1
▲3.6
15.9
2.3
▲7.5
5.9
10.4
8.7
9.7
3.5 Dec
3.0
4.0
▲8.0
▲5.5
▲4.9
▲7.5
5.8
11.1
10.9
13.4
2
▲8.5
▲2.5
▲13.6
▲24.0
▲8.8
▲10.9
▲6.9
▲12.6
▲0.4
▲2.8
2.6 Feb
3
▲2.4
5.0
▲1.6
▲6.1
7.7
▲1.7
0.2
▲7.4
▲4.0
6.0
3.2 Mar
4
▲2.8
1.0
▲2.2
▲0.3
9.7
8.0
▲0.9
▲5.5
▲8.9
2.1
3.6 Apr
5
1.9
8.3
2.6
▲4.9
12.8
11.5
1.8
1.5
▲2.5
0.8
3.7 May
6
0.8
6.9
0.3
▲8.7
2.8
1.7
▲1.0
▲0.3
2.8
▲4.4
3.7 Jun
7
2.2
5.8
0.9
▲11.5
3.3
4.7
▲0.0
▲0.4
6.4
3.2
3.6 Jul
8
0.5
7.5
▲0.6
▲7.2
2.6
▲1.8
▲2.7
▲1.6
4.0
1.7
3.6 Aug
9
3.2
8.5
3.0
▲1.8
▲0.2
1.0
0.4
2.5
5.9
▲1.7
3.5 Sep
10
4.7
3.4
▲0.6
▲0.5
2.9
1.4
3.6
6.3
9.3
11.3
3.6 Oct
11
1.2
9.0
▲4.3
▲6.3
▲1.9
▲1.2
▲0.7
1.7
4.2
10.9
3.6 Nov
12
1.3
6.5
▲3.8
▲5.5
▲0.1
1.4
0.5
1.1
3.5
8.0
3.7 Dec
5.5
12.0
5.9
2.4
2.9
5.1
2.8
4.9
5.4
16.1
2020 年 11月
12
2021 年 1月
2022 年 1月
注:前年(度、同期、同月)比増減率は、ギャップを調整するリンク係数(付表参照)で処理した数値で計算している。
Note:The percentage change from the same month/term of the previous year is calculated using the linked coefficient to adjust for discrepancies Refer to the appendix table
52
2.8 Jan 2021
4.5 Jan 2022
Sales value (million yen)
年
店舗数
調剤医薬
品
Percentage change from the same month/term of the previous year (%)
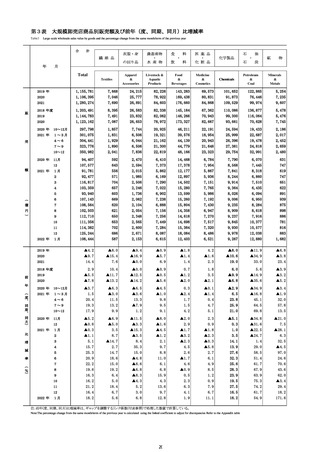
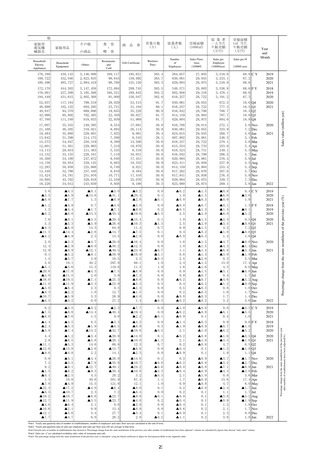
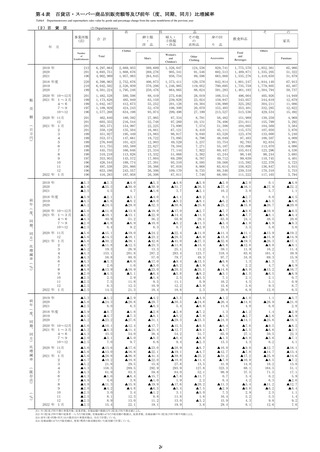
商品販売額
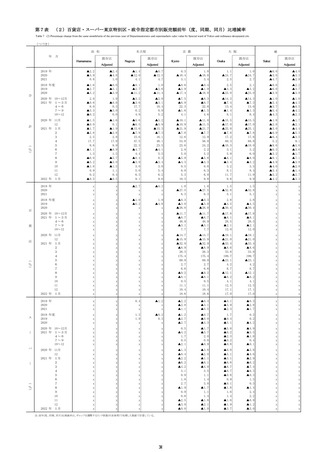
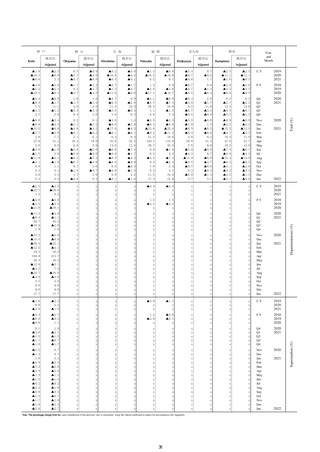
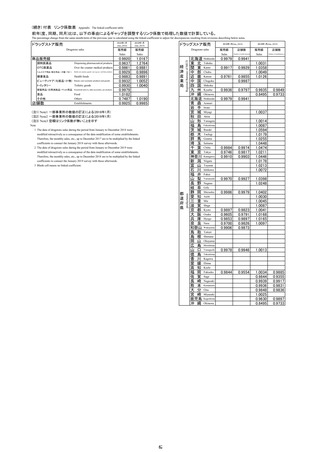
ドラッグストア商品別販売額等及び前年(度、同期、同月)比増減率
Table16 Drugstore sales value by goods and the percentage change from the same month/term of the previous year
月
Sales of goods
ビューティ
ケア(化粧
品・小物)
トイレタ
リー
家庭用品・日
用消耗品・
ペット用品
食品
その他
Dispensing
pharmaceutical
products
Over the counter
medical products
Health care (sanitary
goods), nursing care,
and baby products
Health foods
Beauty care
(cosmetic products
and goods)
Toiletry goods
Household utensils,
daily necessities, pet
products
Food
Others
(店)
Number of
establishments
Year
and
Month
6,835,625
552,460
900,222
432,996
221,759
1,008,208
628,686
1,027,487
1,942,024
121,783
16,422 C Y 2019
7,284,078
595,498
890,608
548,711
226,388
903,560
654,550
1,147,189
2,183,409
134,165
17,000
2020
2021
7,312,480
626,616
868,599
508,940
230,897
907,598
654,269
1,141,769
2,234,442
139,350
17,622
2021
2018 年度
6,466,668
423,618
886,085
426,458
220,080
973,976
609,163
978,895
1,834,009
114,384
15,859 F Y 2018
2019
7,009,551
569,237
908,890
463,886
224,578
1,003,216
639,068
1,068,933
2,008,449
123,294
16,450
2019
2020
7,234,962
598,711
872,350
530,664
225,135
888,375
653,912
1,137,243
2,192,766
135,806
16,969
2020
2020 年
10~12月
1,816,309
155,567
218,844
132,993
56,700
231,920
166,867
284,911
534,383
34,124
17,000 Q4 2020
2021 年
1~3月
1,735,303
151,535
214,552
125,613
54,244
213,300
155,089
262,435
527,188
31,347
16,969 Q1 2021
4~6
1,836,654
152,390
216,412
124,978
58,284
232,634
164,257
289,126
564,294
34,279
17,225 Q2
7~9
1,881,434
157,421
225,188
130,902
61,503
228,440
166,261
296,917
578,597
36,205
17,370 Q3
10~12
1,859,089
165,270
212,447
127,447
56,866
233,224
168,662
293,291
564,363
37,519
17,622 Q4
584,732
48,701
70,533
43,538
18,675
74,565
54,604
90,695
172,496
10,925
16,948 Nov 2020
650,302
55,383
77,438
47,341
19,309
84,406
59,642
104,351
189,838
12,594
17,000 Dec
585,417
48,145
69,775
45,223
18,206
72,289
52,998
91,278
176,500
11,003
16,904 Jan 2021
2
555,146
48,759
69,390
40,495
17,280
65,819
48,996
82,958
171,911
9,538
16,892 Feb
3
594,740
54,631
75,387
39,895
18,758
75,192
53,095
88,199
178,777
10,806
16,969 Mar
4
600,979
52,646
70,854
40,822
18,805
77,181
53,323
92,265
184,017
11,066
17,083 Apr
5
618,194
48,372
72,748
42,582
19,697
77,916
55,201
98,158
191,631
11,889
17,164 May
6
617,481
51,372
72,810
41,574
19,782
77,537
55,733
98,703
188,646
11,324
17,225 Jun
7
633,932
53,058
75,820
42,631
20,694
80,232
56,833
100,840
191,794
12,030
17,289 Jul
8
644,158
52,008
78,448
45,726
21,378
77,032
56,621
101,532
199,183
12,230
17,325 Aug
9
603,344
52,355
70,920
42,545
19,431
71,176
52,807
94,545
187,620
11,945
17,370 Sep
10
608,772
53,217
70,440
41,920
19,263
73,981
54,532
95,528
188,089
11,802
17,467 Oct
11
591,588
53,070
67,474
40,803
18,317
73,671
54,205
92,227
179,705
12,116
17,550 Nov
12
658,729
58,983
74,533
44,724
19,286
85,572
59,925
105,536
196,569
13,601
17,622 Dec
617,880
53,923
73,911
46,326
18,732
75,985
54,491
95,763
185,970
12,779
17,667 Jan 2022
2019 年
5.6
11.1
3.4
3.2
3.0
4.1
3.7
6.2
7.5
6.9
5.0 C Y 2019
2020
6.6
7.8
▲1.1
26.7
2.1
▲10.4
4.1
11.6
12.4
10.2
3.5
2020
2021
0.4
5.2
▲2.5
▲7.2
2.0
0.4
▲0.0
▲0.5
2.3
3.9
3.7
2021
2018 年度
5.3
3.6
2.7
1.1
7.1
5.5
4.4
4.8
8.4
7.1
5.4 F Y 2018
2019
7.1
12.9
3.5
9.6
2.9
2.6
4.6
9.2
9.5
6.3
3.7
2019
2020
3.2
5.2
▲4.0
14.4
0.2
▲11.4
2.3
6.4
9.2
10.1
3.2
2020
2020 年 11月
12
2021 年 1月
2022 年 1月
前
年
(
度
・
同
期
・
同
月
)
比
増
減
率
(
%
)
健康食品
2020
売
(
百
万
円
)
ヘルスケア用
品(衛生用
品)・介護・
ベビー
2019 年
販
額
OTC
医薬品
2020 年
10~12月
6.3
7.1
▲1.6
22.3
6.6
▲4.9
8.6
11.5
8.1
8.8
3.5 Q4 2020
2021 年
1~3月
▲2.8
2.2
▲7.8
▲12.6
▲2.3
▲6.6
▲0.4
▲3.7
1.8
5.5
3.2 Q1 2021
4~6
▲0.1
5.2
0.2
▲4.8
8.2
6.9
▲0.0
▲1.4
▲3.1
▲0.6
3.7 Q2
7~9
1.9
7.3
1.0
▲7.0
1.9
1.3
▲0.8
0.1
5.4
1.0
3.5 Q3
10~12
2.4
6.2
▲2.9
▲4.2
0.3
0.6
1.1
2.9
5.6
9.9
3.7 Q4
7.0
3.1
▲2.5
24.3
8.9
▲3.5
9.6
13.0
9.4
9.9
3.7 Nov 2020
5.0
8.1
▲3.6
15.9
2.3
▲7.5
5.9
10.4
8.7
9.7
3.5 Dec
3.0
4.0
▲8.0
▲5.5
▲4.9
▲7.5
5.8
11.1
10.9
13.4
2
▲8.5
▲2.5
▲13.6
▲24.0
▲8.8
▲10.9
▲6.9
▲12.6
▲0.4
▲2.8
2.6 Feb
3
▲2.4
5.0
▲1.6
▲6.1
7.7
▲1.7
0.2
▲7.4
▲4.0
6.0
3.2 Mar
4
▲2.8
1.0
▲2.2
▲0.3
9.7
8.0
▲0.9
▲5.5
▲8.9
2.1
3.6 Apr
5
1.9
8.3
2.6
▲4.9
12.8
11.5
1.8
1.5
▲2.5
0.8
3.7 May
6
0.8
6.9
0.3
▲8.7
2.8
1.7
▲1.0
▲0.3
2.8
▲4.4
3.7 Jun
7
2.2
5.8
0.9
▲11.5
3.3
4.7
▲0.0
▲0.4
6.4
3.2
3.6 Jul
8
0.5
7.5
▲0.6
▲7.2
2.6
▲1.8
▲2.7
▲1.6
4.0
1.7
3.6 Aug
9
3.2
8.5
3.0
▲1.8
▲0.2
1.0
0.4
2.5
5.9
▲1.7
3.5 Sep
10
4.7
3.4
▲0.6
▲0.5
2.9
1.4
3.6
6.3
9.3
11.3
3.6 Oct
11
1.2
9.0
▲4.3
▲6.3
▲1.9
▲1.2
▲0.7
1.7
4.2
10.9
3.6 Nov
12
1.3
6.5
▲3.8
▲5.5
▲0.1
1.4
0.5
1.1
3.5
8.0
3.7 Dec
5.5
12.0
5.9
2.4
2.9
5.1
2.8
4.9
5.4
16.1
2020 年 11月
12
2021 年 1月
2022 年 1月
注:前年(度、同期、同月)比増減率は、ギャップを調整するリンク係数(付表参照)で処理した数値で計算している。
Note:The percentage change from the same month/term of the previous year is calculated using the linked coefficient to adjust for discrepancies Refer to the appendix table
52
2.8 Jan 2021
4.5 Jan 2022
Sales value (million yen)
年
店舗数
調剤医薬
品
Percentage change from the same month/term of the previous year (%)
商品販売額