
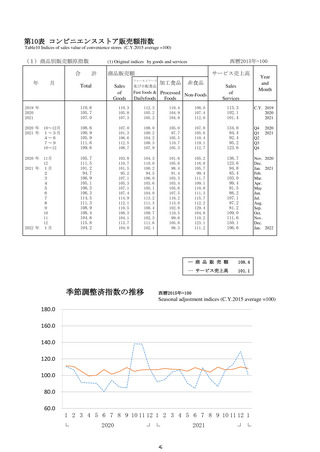
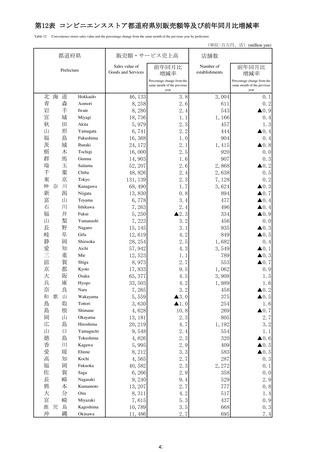

よむ、つかう、まなぶ。
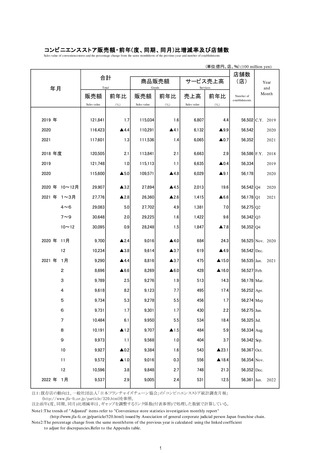
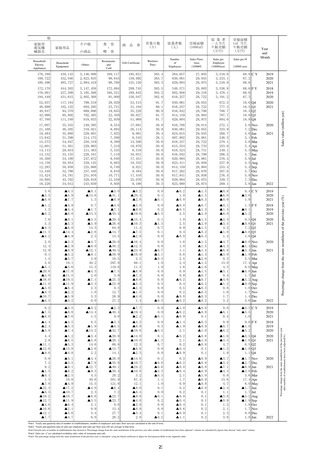
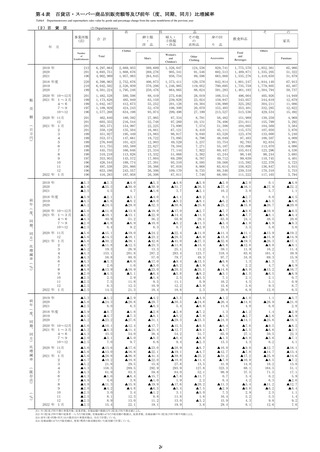
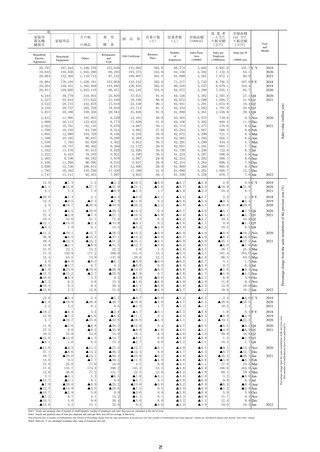
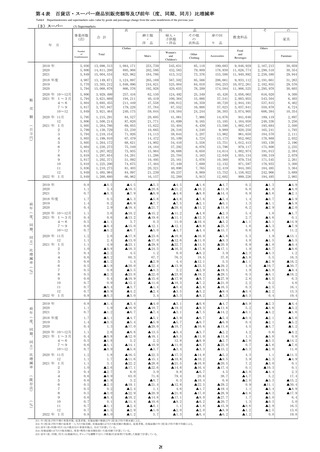
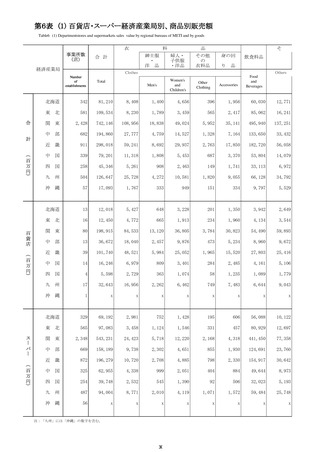
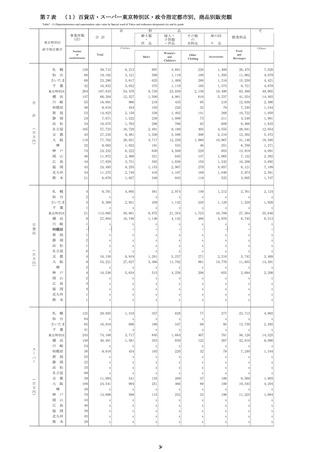
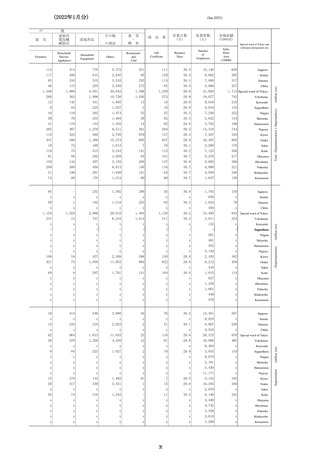
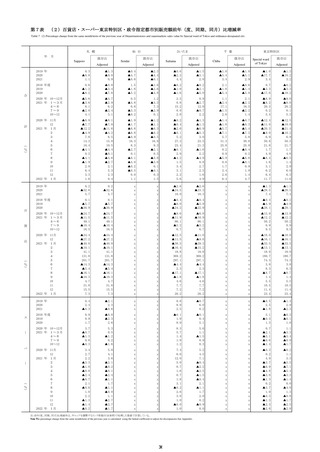
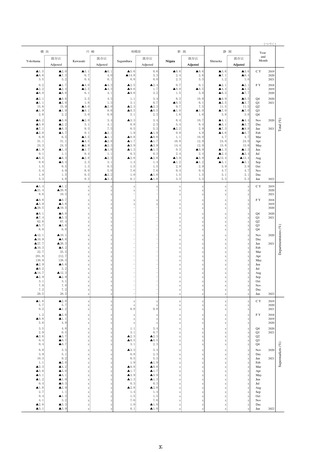
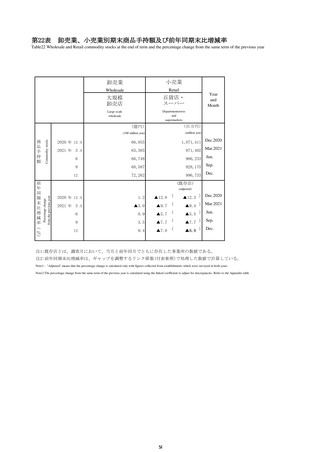
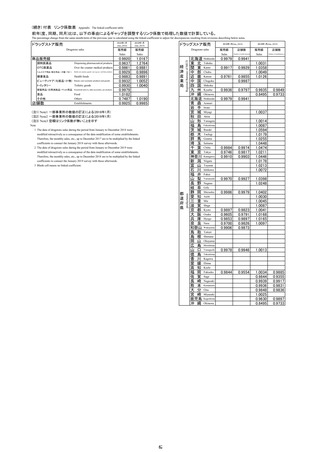
商業動態統計速報 (27 ページ)
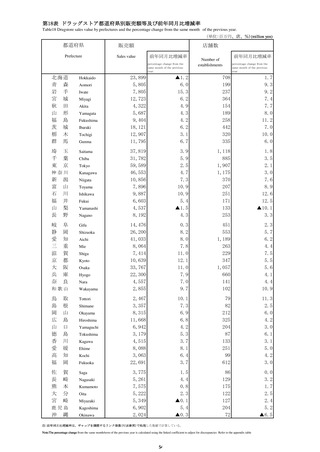
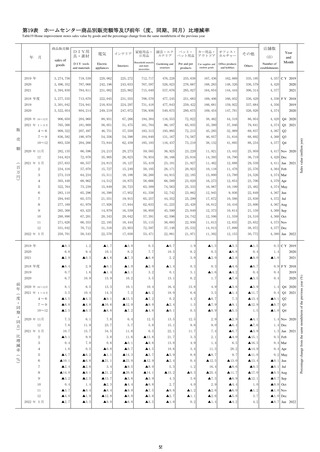
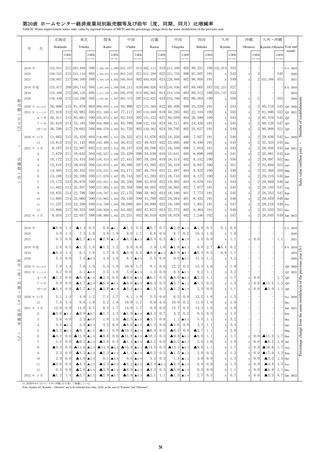
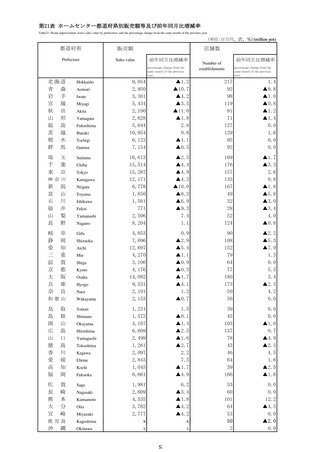
出典
| 公開元URL | https://www.meti.go.jp/statistics/tyo/syoudou/result/sokuho_2.html |
| 出典情報 | 商業動態統計速報 2022年1月分(2/28)《経済産業省》 |
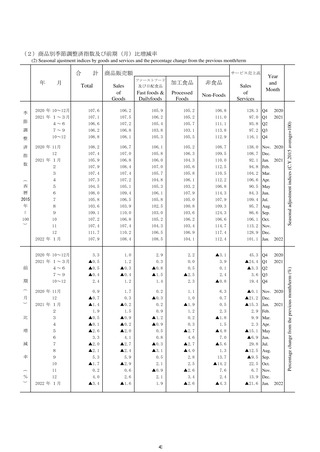
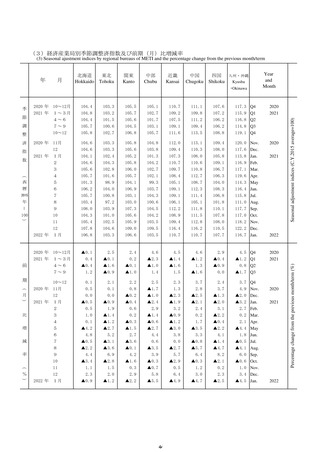
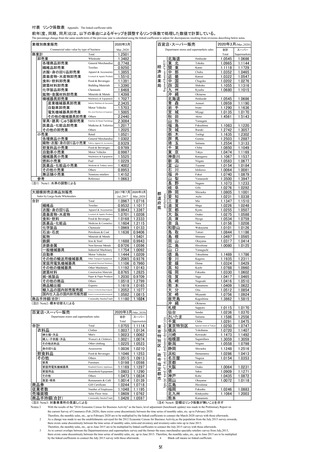
ページ画像
ダウンロードした画像を利用する際は「出典情報」を明記してください。
低解像度画像をダウンロード
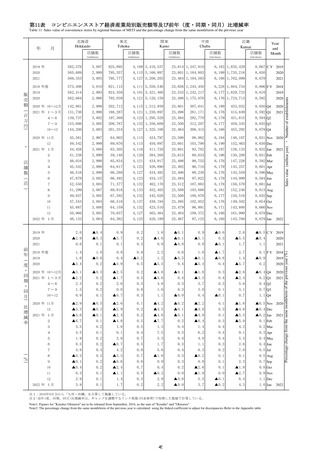
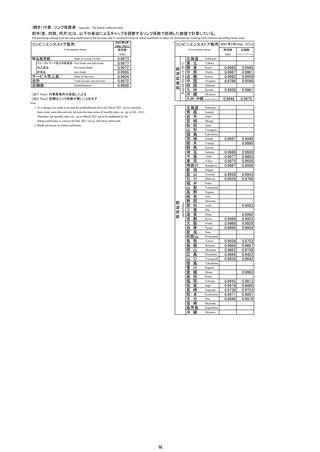
プレーンテキスト
資料テキストはコンピュータによる自動処理で生成されており、完全に資料と一致しない場合があります。
テキストをコピーしてご利用いただく際は資料と付け合わせてご確認ください。
Household
Electric
Appliances
Household
Equipment
食
堂
・
の商品
Others
喫
商
品
券
営業日数
(日)
従業者数
(人)
売場面積
(1000㎡)
従 業 者
一人当た
り販売額
(万円)
売場面積
1㎡ 当た
り販売額
(万円)
Business
Days
Number
of
Employees
Sales Floor
Area
(1000㎡)
Sales per
Employee
(10000yen)
(10000 yen)
茶
Restaurants
and
Café
Gift Certificate
Year
and
Month
Sales per ㎡
157,462
169,078
160,432
263,100
301,390
271,265
1,699,524
1,778,345
1,765,706
17,069
11,351
11,234
64,568
55,719
54,123
363.4
364.1
363.3
495,883
565,905
568,105
22,198
23,673
23,714
2,725.2
2,755.7
2,697.9
58.9 C Y
63.2
63.6
2019
2020
2021
154,106
155,777
173,638
268,199
268,057
301,930
1,721,357
1,712,619
1,779,257
16,736
16,826
10,549
66,203
63,008
54,802
363.6
364.2
362.9
477,354
536,406
555,585
22,260
23,769
23,423
2,744.1
2,733.9
2,737.9
58.6 F Y
59.5
63.7
2018
2019
2020
45,593
43,473
36,325
38,731
41,903
77,325
68,281
65,654
66,155
71,174
480,585
422,673
426,729
436,727
479,578
3,209
2,674
2,644
2,540
3,376
16,492
12,997
11,872
13,113
16,142
91.7
89.1
90.8
91.7
91.7
565,905
555,585
554,001
551,925
568,105
23,673
23,423
23,416
23,622
23,714
706.7
654.1
667.0
675.9
700.6
16.6
15.4
15.8
15.9
16.6
Q4
Q1
Q2
Q3
Q4
2020
2021
14,195
19,168
17,462
12,042
13,968
11,204
12,555
12,566
15,216
12,717
10,798
11,984
12,816
17,103
16,481
23,560
30,391
25,119
21,195
21,967
21,396
21,860
22,398
22,524
22,400
21,230
21,530
22,045
27,600
22,902
147,442
194,399
147,656
129,427
145,589
143,316
145,654
137,759
149,860
150,381
136,486
141,045
145,162
193,371
151,184
1,024
1,121
947
784
942
922
873
849
1,028
742
770
1,075
1,098
1,203
942
4,580
8,277
4,194
3,561
5,242
4,607
3,407
3,858
4,524
4,655
3,934
3,647
4,519
7,975
4,333
30.0
30.9
30.4
28.1
30.6
30.0
30.8
30.0
30.8
30.9
30.0
30.8
30.0
30.9
30.3
552,405
565,905
560,901
544,558
555,585
550,989
556,233
554,001
558,356
562,177
551,925
555,108
556,032
568,105
561,744
23,639
23,673
23,658
23,614
23,423
23,440
23,441
23,416
23,673
23,671
23,622
23,612
23,672
23,714
23,716
220.0
265.1
225.5
209.1
219.3
217.6
227.3
222.1
227.1
230.8
217.9
220.7
217.7
261.6
224.4
5.1
6.3
5.3
4.8
5.2
5.1
5.4
5.3
5.4
5.5
5.1
5.2
5.1
6.3
5.3
Nov
Dec
Jan
Feb
Mar
Apr
May
Jun
Jul
Aug
Sep
Oct
Nov
Dec
Jan
2020
2.6
▲3.1
▲6.9
▲2.6
3.3
▲11.6
▲1.4
▲2.2
▲2.0
0.2
▲34.2
▲1.3
▲3.9
▲18.6
▲4.0
0.0
0.1
▲0.2
0.6
1.9
0.4
▲0.8
▲0.9
0.2
▲0.9
1.7
▲1.9
0.7 C Y
4.4
0.2
2019
2020
2021
1.6
0.0
▲0.3
▲3.1
▲1.1
0.9
▲0.4
▲1.2
▲3.5
▲6.7
0.5
▲38.1
▲2.9
▲5.3
▲18.4
0.0
0.2
▲0.4
0.7
0.4
3.6
0.1
▲0.8
▲1.5
0.1
▲0.3
0.8
1.6 F Y
1.3
3.9
2018
2019
2020
7.5
3.2
▲11.3
▲11.2
▲8.1
2.4
▲6.7
▲16.8
▲14.5
▲8.0
1.5
▲4.9
0.3
▲3.0
▲0.2
▲28.7
▲23.8
30.4
▲3.7
5.2
▲17.1
▲10.6
2.6
▲4.6
▲2.1
0.1
▲1.3
0.4
0.0
0.0
1.9
3.6
1.7
0.9
0.4
▲0.9
▲1.5
▲1.0
0.1
0.2
1.2
▲1.8
▲3.5
▲1.4
▲0.9
4.4
2.0
▲0.0
▲0.6
▲0.0
Q4
Q1
Q2
Q3
Q4
2020
2021
6.8
10.2
9.7
▲1.3
▲0.4
2.1
▲8.0
▲23.0
▲3.9
▲19.0
▲10.8
▲2.0
▲9.7
▲10.8
▲5.6
1.0
0.7
2.0
▲7.3
▲14.4
▲11.8
▲16.0
▲21.8
▲14.6
▲18.1
▲10.2
▲7.9
▲6.4
▲9.2
▲8.8
2.2
▲2.6
▲2.4
▲9.5
▲3.0
8.5
▲0.1
▲6.8
▲0.9
▲5.1
▲3.1
1.7
▲1.5
▲0.5
2.4
▲29.3
▲28.7
▲34.6
▲25.4
▲6.7
75.2
40.1
▲3.3
12.6
▲9.8
▲14.7
1.1
7.2
7.3
▲0.6
▲20.8
▲6.6
▲23.5
▲9.1
2.0
16.6
0.2
▲8.5
▲8.4
▲3.1
▲1.7
0.3
▲1.3
▲3.6
3.3
0.0
0.0
▲0.7
▲3.1
▲0.3
0.7
0.7
0.0
0.0
0.0
0.0
0.0
0.0
0.0
▲0.3
2.7
1.9
2.1
1.5
3.6
3.3
2.5
1.7
1.7
0.5
0.9
1.0
0.7
0.4
0.2
▲0.8
▲0.9
▲0.8
▲0.9
▲1.5
▲1.0
▲1.1
▲1.0
0.0
▲0.0
0.1
0.1
0.1
0.2
0.2
▲0.1
0.5
2.7
▲2.3
▲5.6
▲3.5
▲3.6
▲3.5
▲0.9
▲2.8
▲0.5
▲0.0
▲1.0
▲1.3
▲0.5
2.0
3.3
6.0
0.0
▲0.0
0.0
▲0.0
▲0.0
1.9
▲1.8
0.0
2.0
▲0.0
▲0.0
▲0.0
Nov
Dec
Jan
Feb
Mar
Apr
May
Jun
Jul
Aug
Sep
Oct
Nov
Dec
Jan
2020
▲1.3
▲7.8
▲9.1
▲2.3
1.6
▲12.4
▲2.3
▲3.6
▲2.3
▲2.9
▲37.8
▲3.4
▲3.2
▲18.3
▲3.9
0.0
0.1
▲0.2
▲0.6
0.4
▲0.6
▲0.7
▲0.9
0.4
▲0.3
1.9
▲1.8
▲0.3 C Y
3.0
▲0.9
2019
2020
2021
▲2.1
▲4.2
▲4.7
▲3.3
▲0.6
▲1.9
▲1.8
▲2.1
▲4.8
▲7.4
▲3.8
▲41.3
▲3.4
▲4.3
▲18.6
0.1
0.3
▲0.5
▲1.1
▲1.6
2.8
▲0.1
▲0.9
▲0.9
0.7
0.2
0.8
0.5 F Y
0.3
2.3
2018
2019
2020
3.2
0.1
▲13.3
▲12.9
▲9.7
▲0.4
▲9.8
▲16.6
▲14.6
▲8.1
0.9
▲5.6
▲0.1
▲3.4
▲0.6
▲32.1
▲27.2
27.0
▲5.0
4.4
▲17.2
▲11.4
2.3
▲4.3
▲1.4
0.1
▲1.3
0.5
0.0
0.0
0.4
2.8
0.8
▲0.0
▲0.6
▲0.9
▲0.9
▲0.7
0.3
0.4
1.8
▲2.1
▲3.3
▲1.2
▲0.6
3.2
0.0
▲1.3
▲1.2
▲1.2
Q4
Q1
Q2
Q3
Q4
2020
2021
4.0
4.4
5.2
▲3.8
▲2.2
▲0.5
▲9.9
▲24.8
▲5.6
▲20.3
▲12.7
▲3.8
▲11.3
▲12.3
▲7.0
▲1.4
▲1.4
▲2.1
▲12.5
▲14.1
▲11.6
▲15.6
▲21.7
▲14.6
▲18.2
▲10.5
▲8.1
▲6.6
▲9.2
▲8.6
1.8
▲2.7
▲3.7
▲10.5
▲3.0
8.3
▲0.5
▲7.1
▲1.2
▲5.3
▲3.5
1.1
▲2.0
▲0.8
2.0
▲32.7
▲32.1
▲38.1
▲29.6
▲9.4
70.8
36.3
▲5.8
9.9
▲9.8
▲15.8
0.1
6.5
6.6
▲1.4
▲20.0
▲6.5
▲24.8
▲9.9
1.1
16.1
▲0.4
▲8.5
▲8.6
▲2.7
▲1.1
0.8
▲0.4
▲2.9
4.1
0.2
▲0.0
▲0.6
▲3.3
▲0.3
0.7
0.6
0.1
0.0
▲0.1
0.1
0.0
0.0
0.1
▲0.2
1.0
0.4
0.6
0.2
2.8
2.3
1.5
0.8
0.8
▲0.4
▲0.0
▲0.1
▲0.3
▲0.6
▲0.8
▲1.0
▲0.9
▲0.9
▲0.9
▲0.9
▲0.8
▲0.8
▲0.7
0.3
0.3
0.3
0.3
0.4
0.4
0.4
0.8
1.3
2.5
▲2.8
▲5.4
▲3.2
▲3.4
▲3.2
▲0.6
▲2.6
▲0.3
0.2
▲0.8
▲1.0
▲0.2
4.2
1.7
4.1
▲2.1
▲1.9
▲0.0
▲0.0
▲1.9
▲0.0
▲1.8
▲0.0
▲0.0
▲1.9
▲3.1
▲1.9
Nov
Dec
Jan
Feb
Mar
Apr
May
Jun
Jul
Aug
Sep
Oct
Nov
Dec
Jan
2020
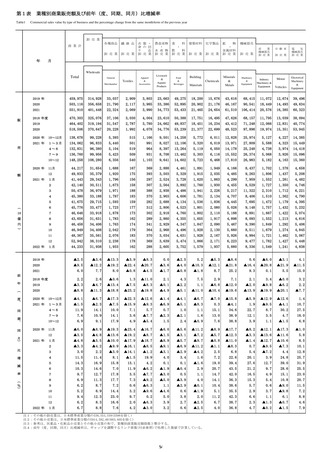
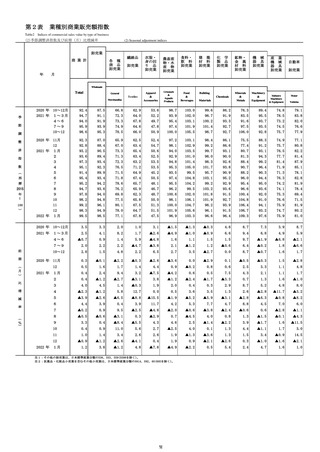
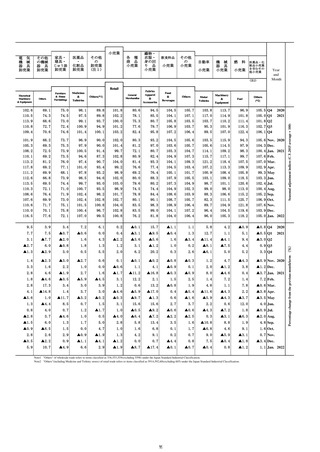
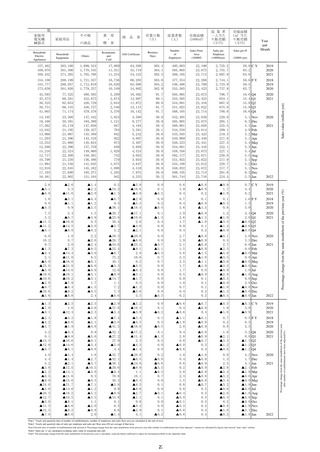
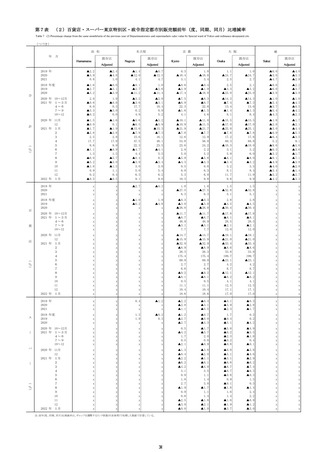
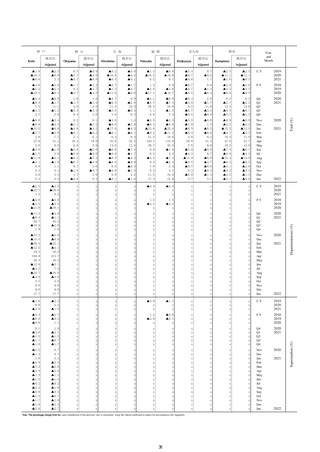
Note1 Yearly and quarterly data of number of establishments, number of employees and sales floor area are calculated at the end of term.
Note2 Yearly and quarterly data of sales per employee and sales per floor area (㎡) are average of that term.
Note3:Growth rates of number of establishments that showed at "Percentage change from the same month/term of the previous year after number of establisments have been adjusted " column are calculated by figures that showed "sales value" column.
Note4 Sales per ㎡ are calculated excluding sales value of restaurant and café.
Note5: The percentage change from the same month/term of the previous year is calculated using the linked coefficient to adjust for discrepancies.Refer to the Appendix table.
27
2021
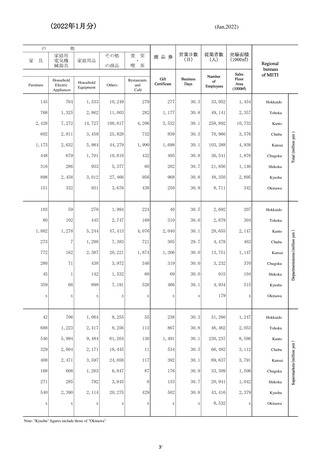
Sales value (million yen)
その他
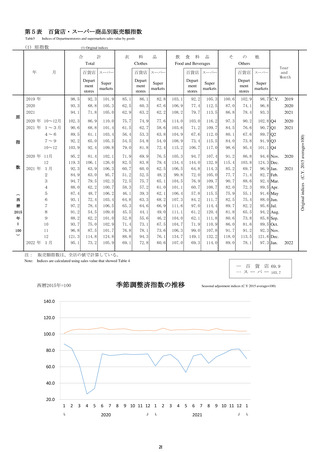
2022
2021
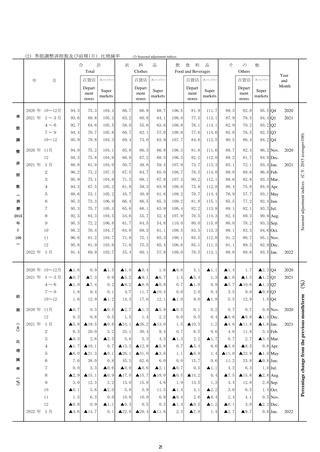
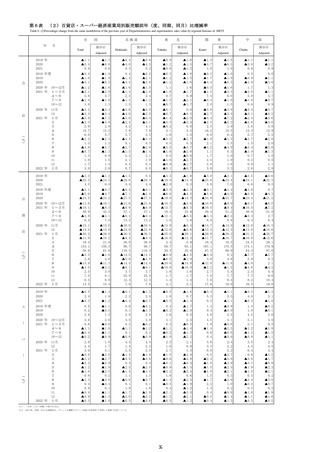
Percentage change from the same month/term of the previous year (%)
家庭用品
2022
2021
2022
Percentage change from the same month/term of the previous year
after number of establishments have been adjusted(%).
他
家庭用
電気機
械器具
Electric
Appliances
Household
Equipment
食
堂
・
の商品
Others
喫
商
品
券
営業日数
(日)
従業者数
(人)
売場面積
(1000㎡)
従 業 者
一人当た
り販売額
(万円)
売場面積
1㎡ 当た
り販売額
(万円)
Business
Days
Number
of
Employees
Sales Floor
Area
(1000㎡)
Sales per
Employee
(10000yen)
(10000 yen)
茶
Restaurants
and
Café
Gift Certificate
Year
and
Month
Sales per ㎡
157,462
169,078
160,432
263,100
301,390
271,265
1,699,524
1,778,345
1,765,706
17,069
11,351
11,234
64,568
55,719
54,123
363.4
364.1
363.3
495,883
565,905
568,105
22,198
23,673
23,714
2,725.2
2,755.7
2,697.9
58.9 C Y
63.2
63.6
2019
2020
2021
154,106
155,777
173,638
268,199
268,057
301,930
1,721,357
1,712,619
1,779,257
16,736
16,826
10,549
66,203
63,008
54,802
363.6
364.2
362.9
477,354
536,406
555,585
22,260
23,769
23,423
2,744.1
2,733.9
2,737.9
58.6 F Y
59.5
63.7
2018
2019
2020
45,593
43,473
36,325
38,731
41,903
77,325
68,281
65,654
66,155
71,174
480,585
422,673
426,729
436,727
479,578
3,209
2,674
2,644
2,540
3,376
16,492
12,997
11,872
13,113
16,142
91.7
89.1
90.8
91.7
91.7
565,905
555,585
554,001
551,925
568,105
23,673
23,423
23,416
23,622
23,714
706.7
654.1
667.0
675.9
700.6
16.6
15.4
15.8
15.9
16.6
Q4
Q1
Q2
Q3
Q4
2020
2021
14,195
19,168
17,462
12,042
13,968
11,204
12,555
12,566
15,216
12,717
10,798
11,984
12,816
17,103
16,481
23,560
30,391
25,119
21,195
21,967
21,396
21,860
22,398
22,524
22,400
21,230
21,530
22,045
27,600
22,902
147,442
194,399
147,656
129,427
145,589
143,316
145,654
137,759
149,860
150,381
136,486
141,045
145,162
193,371
151,184
1,024
1,121
947
784
942
922
873
849
1,028
742
770
1,075
1,098
1,203
942
4,580
8,277
4,194
3,561
5,242
4,607
3,407
3,858
4,524
4,655
3,934
3,647
4,519
7,975
4,333
30.0
30.9
30.4
28.1
30.6
30.0
30.8
30.0
30.8
30.9
30.0
30.8
30.0
30.9
30.3
552,405
565,905
560,901
544,558
555,585
550,989
556,233
554,001
558,356
562,177
551,925
555,108
556,032
568,105
561,744
23,639
23,673
23,658
23,614
23,423
23,440
23,441
23,416
23,673
23,671
23,622
23,612
23,672
23,714
23,716
220.0
265.1
225.5
209.1
219.3
217.6
227.3
222.1
227.1
230.8
217.9
220.7
217.7
261.6
224.4
5.1
6.3
5.3
4.8
5.2
5.1
5.4
5.3
5.4
5.5
5.1
5.2
5.1
6.3
5.3
Nov
Dec
Jan
Feb
Mar
Apr
May
Jun
Jul
Aug
Sep
Oct
Nov
Dec
Jan
2020
2.6
▲3.1
▲6.9
▲2.6
3.3
▲11.6
▲1.4
▲2.2
▲2.0
0.2
▲34.2
▲1.3
▲3.9
▲18.6
▲4.0
0.0
0.1
▲0.2
0.6
1.9
0.4
▲0.8
▲0.9
0.2
▲0.9
1.7
▲1.9
0.7 C Y
4.4
0.2
2019
2020
2021
1.6
0.0
▲0.3
▲3.1
▲1.1
0.9
▲0.4
▲1.2
▲3.5
▲6.7
0.5
▲38.1
▲2.9
▲5.3
▲18.4
0.0
0.2
▲0.4
0.7
0.4
3.6
0.1
▲0.8
▲1.5
0.1
▲0.3
0.8
1.6 F Y
1.3
3.9
2018
2019
2020
7.5
3.2
▲11.3
▲11.2
▲8.1
2.4
▲6.7
▲16.8
▲14.5
▲8.0
1.5
▲4.9
0.3
▲3.0
▲0.2
▲28.7
▲23.8
30.4
▲3.7
5.2
▲17.1
▲10.6
2.6
▲4.6
▲2.1
0.1
▲1.3
0.4
0.0
0.0
1.9
3.6
1.7
0.9
0.4
▲0.9
▲1.5
▲1.0
0.1
0.2
1.2
▲1.8
▲3.5
▲1.4
▲0.9
4.4
2.0
▲0.0
▲0.6
▲0.0
Q4
Q1
Q2
Q3
Q4
2020
2021
6.8
10.2
9.7
▲1.3
▲0.4
2.1
▲8.0
▲23.0
▲3.9
▲19.0
▲10.8
▲2.0
▲9.7
▲10.8
▲5.6
1.0
0.7
2.0
▲7.3
▲14.4
▲11.8
▲16.0
▲21.8
▲14.6
▲18.1
▲10.2
▲7.9
▲6.4
▲9.2
▲8.8
2.2
▲2.6
▲2.4
▲9.5
▲3.0
8.5
▲0.1
▲6.8
▲0.9
▲5.1
▲3.1
1.7
▲1.5
▲0.5
2.4
▲29.3
▲28.7
▲34.6
▲25.4
▲6.7
75.2
40.1
▲3.3
12.6
▲9.8
▲14.7
1.1
7.2
7.3
▲0.6
▲20.8
▲6.6
▲23.5
▲9.1
2.0
16.6
0.2
▲8.5
▲8.4
▲3.1
▲1.7
0.3
▲1.3
▲3.6
3.3
0.0
0.0
▲0.7
▲3.1
▲0.3
0.7
0.7
0.0
0.0
0.0
0.0
0.0
0.0
0.0
▲0.3
2.7
1.9
2.1
1.5
3.6
3.3
2.5
1.7
1.7
0.5
0.9
1.0
0.7
0.4
0.2
▲0.8
▲0.9
▲0.8
▲0.9
▲1.5
▲1.0
▲1.1
▲1.0
0.0
▲0.0
0.1
0.1
0.1
0.2
0.2
▲0.1
0.5
2.7
▲2.3
▲5.6
▲3.5
▲3.6
▲3.5
▲0.9
▲2.8
▲0.5
▲0.0
▲1.0
▲1.3
▲0.5
2.0
3.3
6.0
0.0
▲0.0
0.0
▲0.0
▲0.0
1.9
▲1.8
0.0
2.0
▲0.0
▲0.0
▲0.0
Nov
Dec
Jan
Feb
Mar
Apr
May
Jun
Jul
Aug
Sep
Oct
Nov
Dec
Jan
2020
▲1.3
▲7.8
▲9.1
▲2.3
1.6
▲12.4
▲2.3
▲3.6
▲2.3
▲2.9
▲37.8
▲3.4
▲3.2
▲18.3
▲3.9
0.0
0.1
▲0.2
▲0.6
0.4
▲0.6
▲0.7
▲0.9
0.4
▲0.3
1.9
▲1.8
▲0.3 C Y
3.0
▲0.9
2019
2020
2021
▲2.1
▲4.2
▲4.7
▲3.3
▲0.6
▲1.9
▲1.8
▲2.1
▲4.8
▲7.4
▲3.8
▲41.3
▲3.4
▲4.3
▲18.6
0.1
0.3
▲0.5
▲1.1
▲1.6
2.8
▲0.1
▲0.9
▲0.9
0.7
0.2
0.8
0.5 F Y
0.3
2.3
2018
2019
2020
3.2
0.1
▲13.3
▲12.9
▲9.7
▲0.4
▲9.8
▲16.6
▲14.6
▲8.1
0.9
▲5.6
▲0.1
▲3.4
▲0.6
▲32.1
▲27.2
27.0
▲5.0
4.4
▲17.2
▲11.4
2.3
▲4.3
▲1.4
0.1
▲1.3
0.5
0.0
0.0
0.4
2.8
0.8
▲0.0
▲0.6
▲0.9
▲0.9
▲0.7
0.3
0.4
1.8
▲2.1
▲3.3
▲1.2
▲0.6
3.2
0.0
▲1.3
▲1.2
▲1.2
Q4
Q1
Q2
Q3
Q4
2020
2021
4.0
4.4
5.2
▲3.8
▲2.2
▲0.5
▲9.9
▲24.8
▲5.6
▲20.3
▲12.7
▲3.8
▲11.3
▲12.3
▲7.0
▲1.4
▲1.4
▲2.1
▲12.5
▲14.1
▲11.6
▲15.6
▲21.7
▲14.6
▲18.2
▲10.5
▲8.1
▲6.6
▲9.2
▲8.6
1.8
▲2.7
▲3.7
▲10.5
▲3.0
8.3
▲0.5
▲7.1
▲1.2
▲5.3
▲3.5
1.1
▲2.0
▲0.8
2.0
▲32.7
▲32.1
▲38.1
▲29.6
▲9.4
70.8
36.3
▲5.8
9.9
▲9.8
▲15.8
0.1
6.5
6.6
▲1.4
▲20.0
▲6.5
▲24.8
▲9.9
1.1
16.1
▲0.4
▲8.5
▲8.6
▲2.7
▲1.1
0.8
▲0.4
▲2.9
4.1
0.2
▲0.0
▲0.6
▲3.3
▲0.3
0.7
0.6
0.1
0.0
▲0.1
0.1
0.0
0.0
0.1
▲0.2
1.0
0.4
0.6
0.2
2.8
2.3
1.5
0.8
0.8
▲0.4
▲0.0
▲0.1
▲0.3
▲0.6
▲0.8
▲1.0
▲0.9
▲0.9
▲0.9
▲0.9
▲0.8
▲0.8
▲0.7
0.3
0.3
0.3
0.3
0.4
0.4
0.4
0.8
1.3
2.5
▲2.8
▲5.4
▲3.2
▲3.4
▲3.2
▲0.6
▲2.6
▲0.3
0.2
▲0.8
▲1.0
▲0.2
4.2
1.7
4.1
▲2.1
▲1.9
▲0.0
▲0.0
▲1.9
▲0.0
▲1.8
▲0.0
▲0.0
▲1.9
▲3.1
▲1.9
Nov
Dec
Jan
Feb
Mar
Apr
May
Jun
Jul
Aug
Sep
Oct
Nov
Dec
Jan
2020
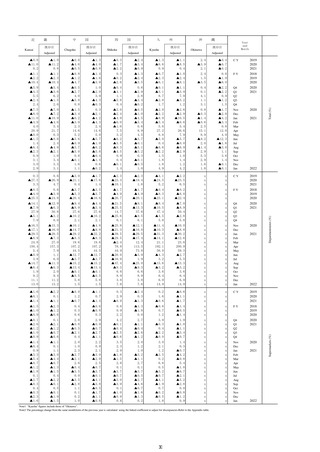
Note1 Yearly and quarterly data of number of establishments, number of employees and sales floor area are calculated at the end of term.
Note2 Yearly and quarterly data of sales per employee and sales per floor area (㎡) are average of that term.
Note3:Growth rates of number of establishments that showed at "Percentage change from the same month/term of the previous year after number of establisments have been adjusted " column are calculated by figures that showed "sales value" column.
Note4 Sales per ㎡ are calculated excluding sales value of restaurant and café.
Note5: The percentage change from the same month/term of the previous year is calculated using the linked coefficient to adjust for discrepancies.Refer to the Appendix table.
27
2021
Sales value (million yen)
その他
2022
2021
Percentage change from the same month/term of the previous year (%)
家庭用品
2022
2021
2022
Percentage change from the same month/term of the previous year
after number of establishments have been adjusted(%).
他
家庭用
電気機
械器具