
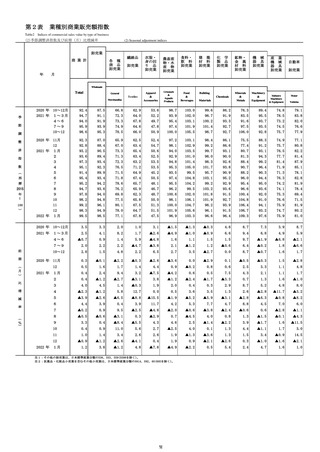
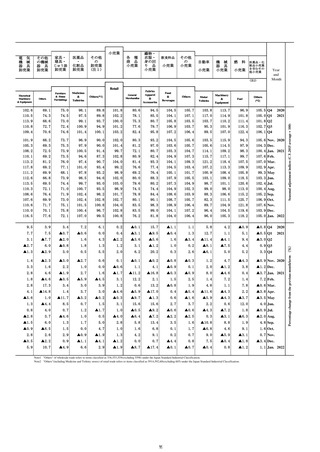
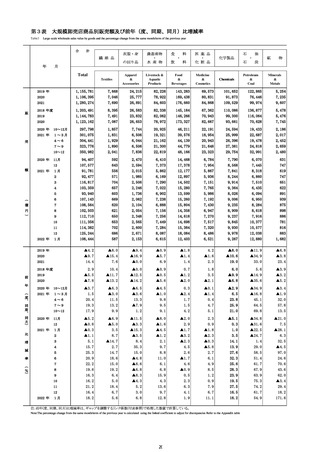
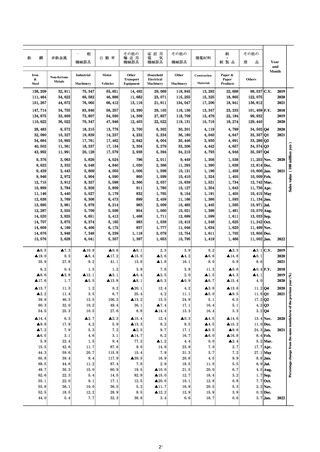

よむ、つかう、まなぶ。
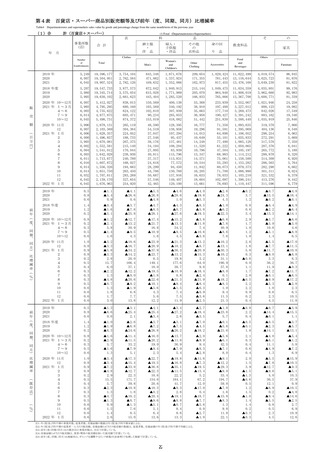
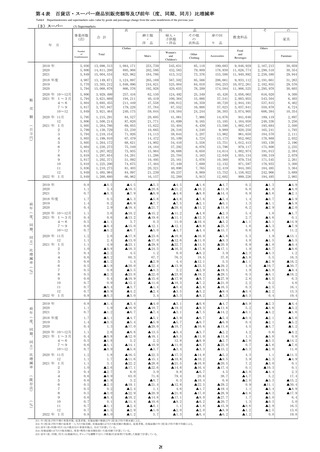
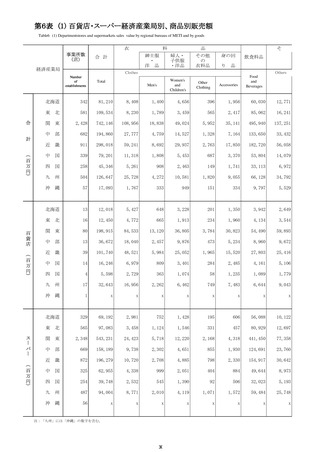
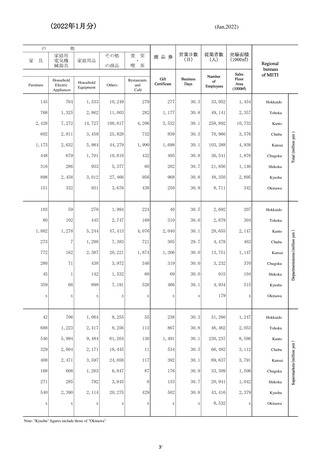
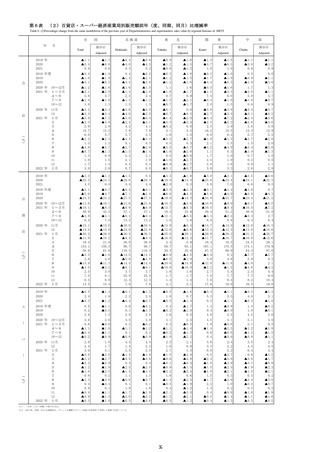
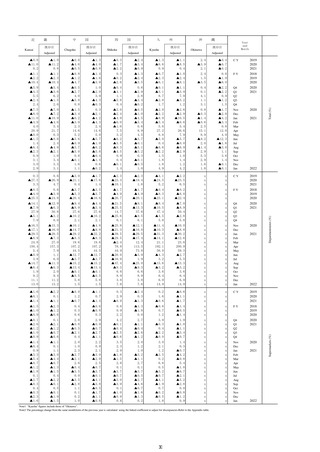
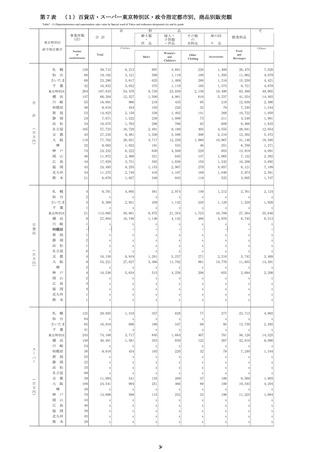
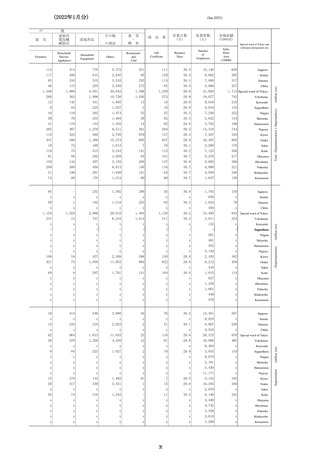
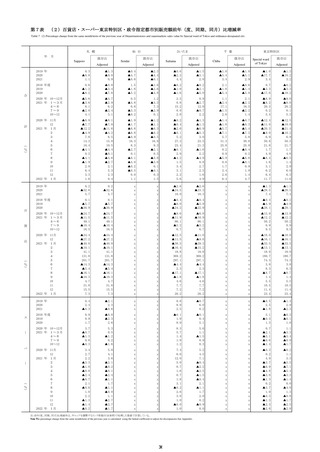
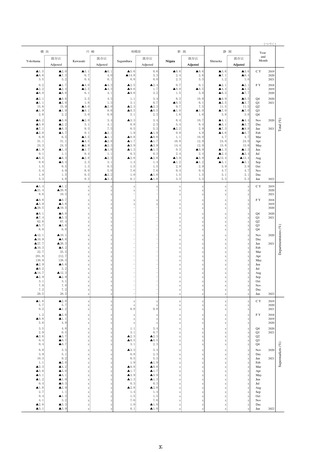
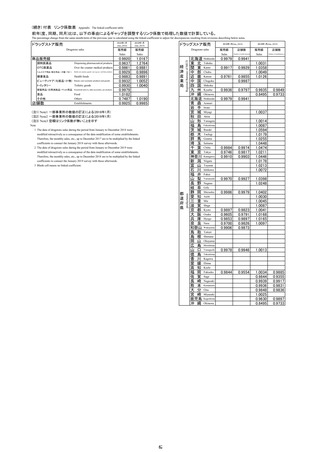
商業動態統計速報 (15 ページ)
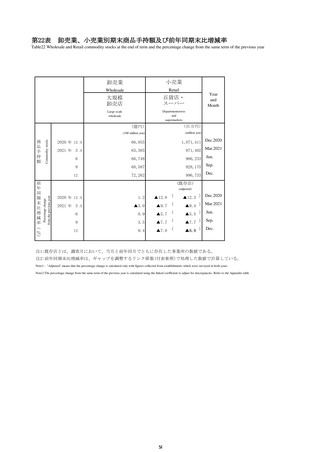
出典
| 公開元URL | https://www.meti.go.jp/statistics/tyo/syoudou/result/sokuho_2.html |
| 出典情報 | 商業動態統計速報 2022年1月分(2/28)《経済産業省》 |
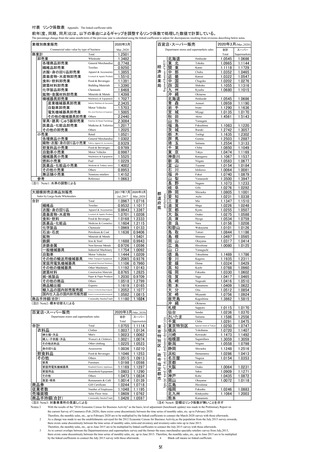
ページ画像
ダウンロードした画像を利用する際は「出典情報」を明記してください。
低解像度画像をダウンロード
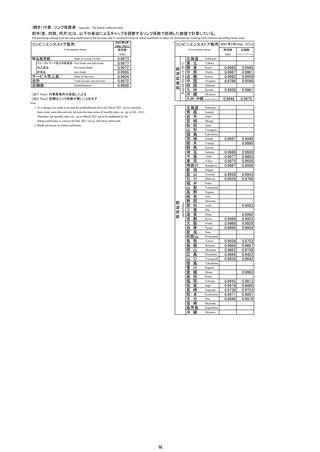
プレーンテキスト
資料テキストはコンピュータによる自動処理で生成されており、完全に資料と一致しない場合があります。
テキストをコピーしてご利用いただく際は資料と付け合わせてご確認ください。
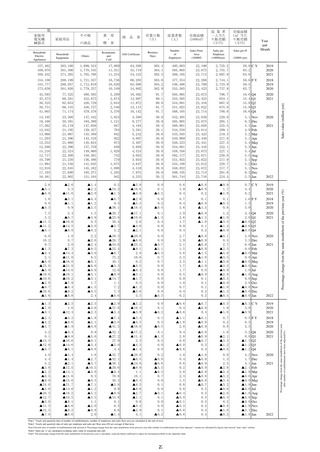
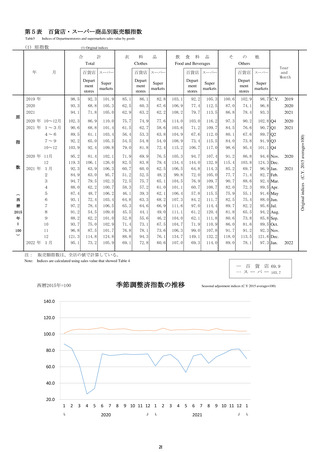
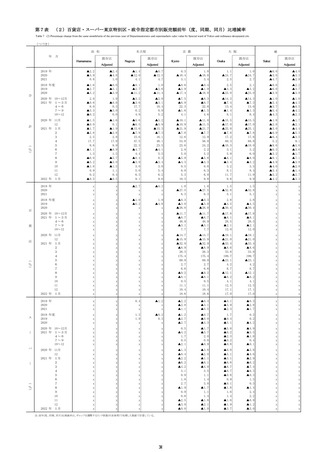
参
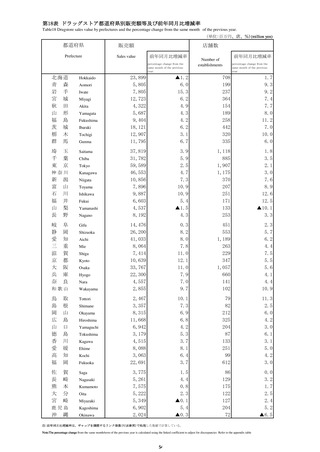
小 売 業
医 薬 品
・
化 粧 品
卸 売 業
その他の
卸 売 業
各種商品
(注1)
小 売 業
織物・衣
服・身の
回 り 品
小 売 業
飲食料品
自 動 車
機械器具
燃
料
小 売 業
小 売 業
小 売 業
小 売 業
そ の 他
小 売 業
無 店 舗
(注2)
小 売 業
考
(注3)
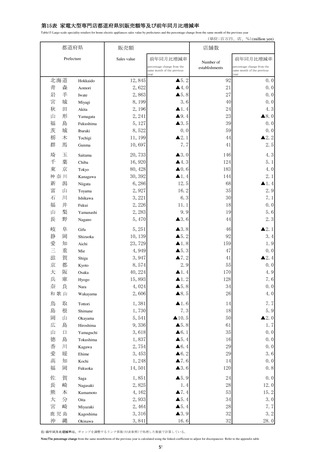
Year
and
Month
Medicines
&
Toiletries
General
Others
(*1)
Merchandise
Fabrics Apparel
& Accessories
Food
&
Beverages
Motor
Vehicles
Machinery
&
Equipment
Fuel
Medicine
&
Toiletry
Stores
Others
(*2)
Nonstore
retailers
Reference
(*3)
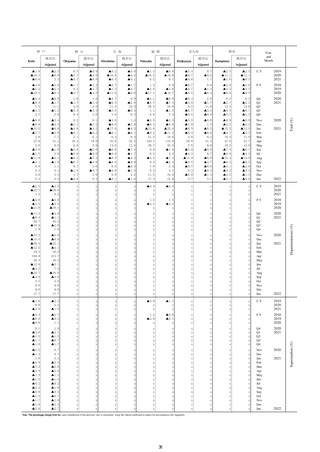
5,173
2,172
25,626
28,537
145,047
11,795
10,988
45,362
18,204
6,256
12,905
10,538
21,297
7,702
7,966
4,122
28,193
31,384
146,457
10,207
8,638
45,145
16,592
9,429
11,893
14,259
19,503
10,791
31,835 C.Y. 2019
33,762
2020
9,131
4,460
30,698
35,658
150,462
10,346
8,610
45,328
17,001
10,035
13,839
15,026
18,862
11,416
33,888
2021
5,228
2,252
24,991
29,667
145,226
12,050
11,048
45,214
18,276
6,180
13,269
10,156
21,475
7,558
31,631 F.Y. 2018
5,577
2,430
25,903
28,905
145,208
11,530
10,686
45,401
18,135
6,513
12,889
11,025
21,068
7,963
32,093
2019
8,628
4,446
29,005
32,387
147,858
10,063
8,353
44,900
16,959
10,276
11,782
14,901
19,242
11,381
34,143
2020
2,234
1,195
7,931
8,683
39,450
2,966
2,615
11,643
4,473
2,743
3,129
3,798
5,071
3,012
8,869 Q4
2020
2,449
1,131
7,086
8,431
37,229
2,496
2,031
10,715
5,066
2,682
3,320
3,652
4,574
2,693
8,226 Q1
2021
2,119
1,076
7,729
8,732
36,451
2,370
2,077
11,160
4,035
2,368
3,215
3,710
4,689
2,827
8,398 Q2
2,284
1,061
7,703
8,812
36,804
2,445
1,849
11,528
4,030
2,415
3,364
3,782
4,568
2,823
8,350 Q3
2,279
1,191
8,180
9,683
39,978
3,034
2,652
11,925
3,871
2,570
3,940
3,882
5,032
3,073
8,914 Q4
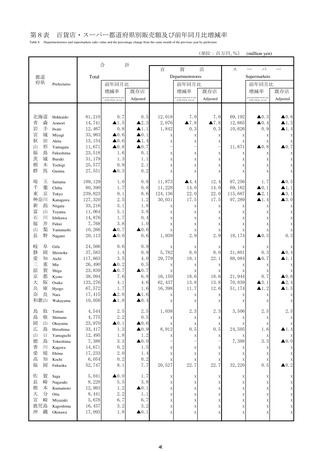
698
390
2,446
2,803
12,562
926
863
3,582
1,517
891
987
1,195
1,618
982
812
424
2,873
3,064
14,454
1,173
940
4,383
1,493
1,065
1,172
1,351
1,826
1,051
665
316
2,204
2,580
12,101
829
709
3,571
1,485
900
1,074
1,196
1,478
860
2,674 Jan. 2021
706
364
2,235
2,645
11,629
767
539
3,406
1,599
795
1,068
1,158
1,433
864
2,591 Feb.
1,079
451
2,647
3,205
13,499
900
783
3,738
1,982
987
1,179
1,298
1,663
969
2,961 Mar.
743
395
2,863
3,052
12,192
784
677
3,653
1,380
794
1,102
1,257
1,595
951
2,852 Apr.
649
319
2,293
2,735
11,959
727
682
3,793
1,257
792
1,029
1,205
1,580
895
2,785 May
727
362
2,573
2,946
12,299
859
718
3,714
1,398
782
1,083
1,248
1,513
982
2,762 Jun.
729
369
2,581
2,947
12,728
909
694
3,849
1,400
886
1,164
1,282
1,558
986
2,840 Jul.
712
330
2,512
2,778
12,025
761
545
3,926
1,255
777
1,104
1,267
1,492
897
2,759 Aug.
843
363
2,610
3,087
12,051
775
610
3,753
1,374
753
1,096
1,233
1,518
939
2,751 Sep.
714
367
2,621
3,140
12,541
871
797
3,811
1,177
806
1,220
1,269
1,631
958
2,900 Oct.
745
397
2,620
3,235
12,806
955
895
3,715
1,326
792
1,273
1,245
1,608
997
2,853 Nov.
820
427
2,939
3,308
14,631
1,209
960
4,398
1,368
972
1,447
1,368
1,792
1,118
3,160 Dec.
709
310
2,346
2,810
12,295
876
715
3,586
1,257
868
1,318
1,251
1,544
881
2,795 Jan. 2022
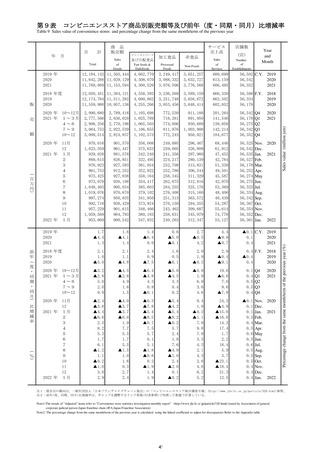
0.8 C.Y. 2019
2,813 Nov. 2020
3,177 Dec.
▲0.9
▲3.9
3.0
▲6.1
0.1
▲2.9
▲0.5
0.4
0.8
2.0
▲2.6
4.2
▲0.7
1.4
▲24.0
▲9.0
▲6.0
▲6.0
▲3.2
▲15.5
▲16.8
1.3
▲8.8
2.6
▲9.5
1.3
0.5
3.5
0.4
2020
3.4
▲2.3
6.0
10.5
1.9
0.8
0.9
0.7
2.5
0.7
15.8
0.5
▲1.6
1.2
▲0.6
2021
▲3.4
▲2.7
▲0.6
0.6
1.6
▲1.9
▲0.4
1.0
1.8
1.6
9.1
3.1
1.0
▲0.0
▲4.9
▲3.9
2.0
▲4.3
▲0.4
▲4.5
▲2.8
0.6
▲0.8
0.4
▲3.1
5.0
▲1.0
1.8
0.9
2019
▲22.6
▲11.0
▲5.3
▲5.1
▲2.8
▲15.1
▲16.6
0.8
▲6.4
6.6
▲10.5
▲0.2
1.1
4.6
0.3
2020
▲13.9
▲3.2
▲0.1
2.2
2.1
▲7.2
▲5.4
0.8
7.6
22.3
▲6.7
1.2
5.8
9.0
3.5 Q4
2020
▲7.5
▲9.5
0.7
1.6
0.5
▲7.4
▲8.0
▲0.9
7.9
13.0
▲4.7
▲1.4
1.8
3.9
0.6 Q1
2021
14.3
1.9
10.3
17.2
6.5
14.8
14.4
0.1
24.0
4.5
28.5
0.4
▲0.5
2.1
▲0.1 Q2
9.3
▲0.2
10.3
12.7
▲0.4
▲3.6
▲2.2
1.1
▲3.3
▲6.6
18.8
0.7
▲6.5
▲2.9
▲3.4 Q3
2.0
▲0.3
3.1
11.5
1.3
2.3
1.4
2.4
▲13.5
▲6.3
25.9
2.2
▲0.8
2.0
0.5 Q4
▲17.2
▲5.9
▲2.4
0.9
0.6
▲10.1
▲7.7
0.3
3.0
26.2
▲10.2
▲0.8
6.0
7.6
2.8 Nov. 2020
▲13.3
▲2.1
1.9
3.3
▲0.2
▲9.5
▲4.5
▲1.0
4.4
15.9
▲8.4
1.3
2.0
5.9
▲11.3
▲14.3
▲2.6
1.3
▲2.4
▲17.4
▲17.8
▲0.1
6.0
12.5
▲9.6
▲1.1
▲3.7
5.3
▲12.2
▲11.4
▲2.9
0.2
▲1.5
▲10.0
▲17.4
▲2.0
6.0
11.2
▲9.7
▲5.2
4.0
1.5
0.7 Feb.
▲1.5
▲3.9
7.0
2.9
5.2
7.3
13.0
▲0.5
11.0
14.9
5.8
1.9
5.2
4.9
3.7 Mar.
15.5
2.9
5.1
12.1
11.9
43.6
63.3
▲0.2
26.9
23.8
25.2
▲1.7
5.5
8.6
2.2 Apr.
19.1
3.5
16.5
22.9
8.3
16.4
16.5
▲0.0
36.4
12.6
34.8
2.1
0.8
▲0.5
1.4 May
9.1
▲0.5
11.2
17.5
0.1
▲3.9
▲11.9
0.7
12.2
▲15.1
26.1
0.8
▲7.2
▲1.2
▲3.7 Jun.
1.6 F.Y. 2018
0.9 Dec.
▲2.7 Jan. 2021
6.9
1.8
7.5
14.0
2.4
1.0
3.1
2.4
3.3
▲2.8
27.8
0.5
▲4.7
▲2.3
▲2.5 Jul.
13.1
▲1.4
14.4
12.6
▲3.2
▲9.0
▲12.2
▲1.1
1.4
▲12.7
12.6
0.4
▲11.0
▲5.0
▲6.1 Aug.
8.3
▲0.9
9.5
11.6
▲0.5
▲3.1
2.3
2.3
▲12.6
▲4.2
16.6
1.4
▲3.6
▲1.5
▲1.4 Sep.
▲1.4
▲3.7
0.3
11.5
0.9
0.5
▲1.9
3.6
▲19.6
2.5
25.8
1.5
0.2
▲2.1
0.7 Oct.
6.7
1.9
7.1
15.4
1.9
3.1
3.6
3.7
▲12.6
▲11.1
28.9
4.2
▲0.6
1.6
1.4 Nov.
1.0
0.7
2.3
7.9
1.2
3.0
2.2
0.4
▲8.4
▲8.8
23.5
1.2
▲1.8
6.3
▲0.5 Dec.
▲2.0
6.4
8.9
1.6
5.7
0.9
0.4
▲15.4
▲3.6
22.8
4.6
4.4
2.4
6.7
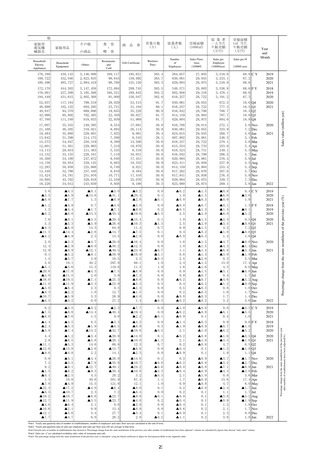
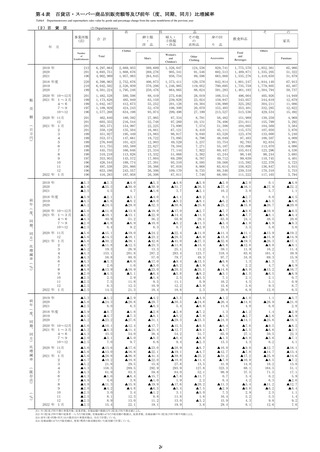
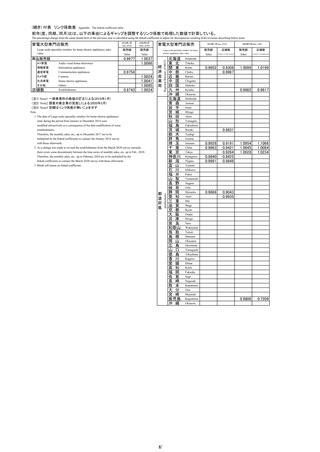
Note1 "Others" of wholesale trade refers to the items classified as 536,553,559(excluding 5598) under the Japan Standard Industrial Classification.
Note2 "Others" of retail trade refers to the items classified as 5914,592,60(excludeing 603 and 605) under the Japan Standard Industrial Classification.
Note3 "Reference(*3)" is total of "Medicine & Toiletry Stores" and "Others(*2)".
Note4 The percentage change from the same month/term of the previous year is calculated using the linked coefficient to adjust for discrepancies.Refer to the Appendix table.
15
4.5 Jan. 2022
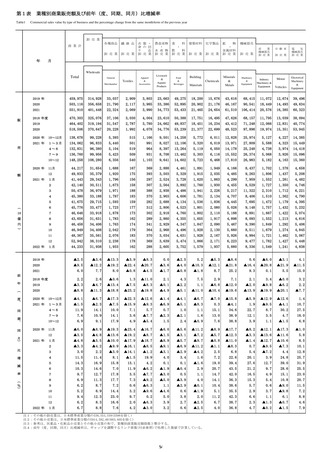
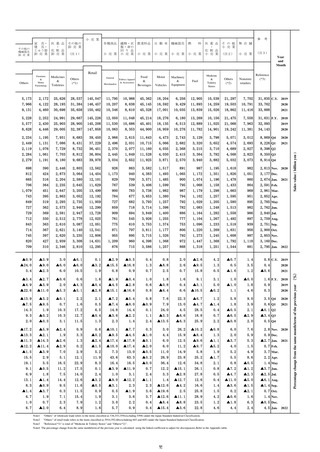
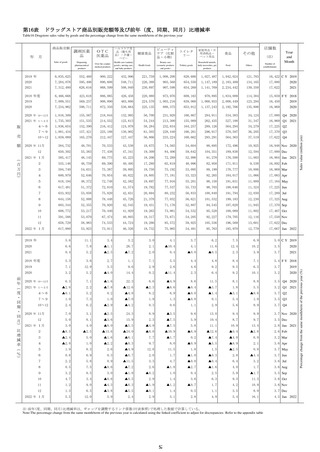
Sales value ( billion yen )
Furniture
&
House
Furnishings
(%)
Retail
Others
医 薬 品
・
化 粧 品
小 売 業
Percentage change from the same month/term of the previous year
その他の
機械器具
卸 売 業
家 具・
建 具・
じゅう器
卸 売 業
小 売 業
医 薬 品
・
化 粧 品
卸 売 業
その他の
卸 売 業
各種商品
(注1)
小 売 業
織物・衣
服・身の
回 り 品
小 売 業
飲食料品
自 動 車
機械器具
燃
料
小 売 業
小 売 業
小 売 業
小 売 業
そ の 他
小 売 業
無 店 舗
(注2)
小 売 業
考
(注3)
Year
and
Month
Medicines
&
Toiletries
General
Others
(*1)
Merchandise
Fabrics Apparel
& Accessories
Food
&
Beverages
Motor
Vehicles
Machinery
&
Equipment
Fuel
Medicine
&
Toiletry
Stores
Others
(*2)
Nonstore
retailers
Reference
(*3)
5,173
2,172
25,626
28,537
145,047
11,795
10,988
45,362
18,204
6,256
12,905
10,538
21,297
7,702
7,966
4,122
28,193
31,384
146,457
10,207
8,638
45,145
16,592
9,429
11,893
14,259
19,503
10,791
31,835 C.Y. 2019
33,762
2020
9,131
4,460
30,698
35,658
150,462
10,346
8,610
45,328
17,001
10,035
13,839
15,026
18,862
11,416
33,888
2021
5,228
2,252
24,991
29,667
145,226
12,050
11,048
45,214
18,276
6,180
13,269
10,156
21,475
7,558
31,631 F.Y. 2018
5,577
2,430
25,903
28,905
145,208
11,530
10,686
45,401
18,135
6,513
12,889
11,025
21,068
7,963
32,093
2019
8,628
4,446
29,005
32,387
147,858
10,063
8,353
44,900
16,959
10,276
11,782
14,901
19,242
11,381
34,143
2020
2,234
1,195
7,931
8,683
39,450
2,966
2,615
11,643
4,473
2,743
3,129
3,798
5,071
3,012
8,869 Q4
2020
2,449
1,131
7,086
8,431
37,229
2,496
2,031
10,715
5,066
2,682
3,320
3,652
4,574
2,693
8,226 Q1
2021
2,119
1,076
7,729
8,732
36,451
2,370
2,077
11,160
4,035
2,368
3,215
3,710
4,689
2,827
8,398 Q2
2,284
1,061
7,703
8,812
36,804
2,445
1,849
11,528
4,030
2,415
3,364
3,782
4,568
2,823
8,350 Q3
2,279
1,191
8,180
9,683
39,978
3,034
2,652
11,925
3,871
2,570
3,940
3,882
5,032
3,073
8,914 Q4
698
390
2,446
2,803
12,562
926
863
3,582
1,517
891
987
1,195
1,618
982
812
424
2,873
3,064
14,454
1,173
940
4,383
1,493
1,065
1,172
1,351
1,826
1,051
665
316
2,204
2,580
12,101
829
709
3,571
1,485
900
1,074
1,196
1,478
860
2,674 Jan. 2021
706
364
2,235
2,645
11,629
767
539
3,406
1,599
795
1,068
1,158
1,433
864
2,591 Feb.
1,079
451
2,647
3,205
13,499
900
783
3,738
1,982
987
1,179
1,298
1,663
969
2,961 Mar.
743
395
2,863
3,052
12,192
784
677
3,653
1,380
794
1,102
1,257
1,595
951
2,852 Apr.
649
319
2,293
2,735
11,959
727
682
3,793
1,257
792
1,029
1,205
1,580
895
2,785 May
727
362
2,573
2,946
12,299
859
718
3,714
1,398
782
1,083
1,248
1,513
982
2,762 Jun.
729
369
2,581
2,947
12,728
909
694
3,849
1,400
886
1,164
1,282
1,558
986
2,840 Jul.
712
330
2,512
2,778
12,025
761
545
3,926
1,255
777
1,104
1,267
1,492
897
2,759 Aug.
843
363
2,610
3,087
12,051
775
610
3,753
1,374
753
1,096
1,233
1,518
939
2,751 Sep.
714
367
2,621
3,140
12,541
871
797
3,811
1,177
806
1,220
1,269
1,631
958
2,900 Oct.
745
397
2,620
3,235
12,806
955
895
3,715
1,326
792
1,273
1,245
1,608
997
2,853 Nov.
820
427
2,939
3,308
14,631
1,209
960
4,398
1,368
972
1,447
1,368
1,792
1,118
3,160 Dec.
709
310
2,346
2,810
12,295
876
715
3,586
1,257
868
1,318
1,251
1,544
881
2,795 Jan. 2022
0.8 C.Y. 2019
2,813 Nov. 2020
3,177 Dec.
▲0.9
▲3.9
3.0
▲6.1
0.1
▲2.9
▲0.5
0.4
0.8
2.0
▲2.6
4.2
▲0.7
1.4
▲24.0
▲9.0
▲6.0
▲6.0
▲3.2
▲15.5
▲16.8
1.3
▲8.8
2.6
▲9.5
1.3
0.5
3.5
0.4
2020
3.4
▲2.3
6.0
10.5
1.9
0.8
0.9
0.7
2.5
0.7
15.8
0.5
▲1.6
1.2
▲0.6
2021
▲3.4
▲2.7
▲0.6
0.6
1.6
▲1.9
▲0.4
1.0
1.8
1.6
9.1
3.1
1.0
▲0.0
▲4.9
▲3.9
2.0
▲4.3
▲0.4
▲4.5
▲2.8
0.6
▲0.8
0.4
▲3.1
5.0
▲1.0
1.8
0.9
2019
▲22.6
▲11.0
▲5.3
▲5.1
▲2.8
▲15.1
▲16.6
0.8
▲6.4
6.6
▲10.5
▲0.2
1.1
4.6
0.3
2020
▲13.9
▲3.2
▲0.1
2.2
2.1
▲7.2
▲5.4
0.8
7.6
22.3
▲6.7
1.2
5.8
9.0
3.5 Q4
2020
▲7.5
▲9.5
0.7
1.6
0.5
▲7.4
▲8.0
▲0.9
7.9
13.0
▲4.7
▲1.4
1.8
3.9
0.6 Q1
2021
14.3
1.9
10.3
17.2
6.5
14.8
14.4
0.1
24.0
4.5
28.5
0.4
▲0.5
2.1
▲0.1 Q2
9.3
▲0.2
10.3
12.7
▲0.4
▲3.6
▲2.2
1.1
▲3.3
▲6.6
18.8
0.7
▲6.5
▲2.9
▲3.4 Q3
2.0
▲0.3
3.1
11.5
1.3
2.3
1.4
2.4
▲13.5
▲6.3
25.9
2.2
▲0.8
2.0
0.5 Q4
▲17.2
▲5.9
▲2.4
0.9
0.6
▲10.1
▲7.7
0.3
3.0
26.2
▲10.2
▲0.8
6.0
7.6
2.8 Nov. 2020
▲13.3
▲2.1
1.9
3.3
▲0.2
▲9.5
▲4.5
▲1.0
4.4
15.9
▲8.4
1.3
2.0
5.9
▲11.3
▲14.3
▲2.6
1.3
▲2.4
▲17.4
▲17.8
▲0.1
6.0
12.5
▲9.6
▲1.1
▲3.7
5.3
▲12.2
▲11.4
▲2.9
0.2
▲1.5
▲10.0
▲17.4
▲2.0
6.0
11.2
▲9.7
▲5.2
4.0
1.5
0.7 Feb.
▲1.5
▲3.9
7.0
2.9
5.2
7.3
13.0
▲0.5
11.0
14.9
5.8
1.9
5.2
4.9
3.7 Mar.
15.5
2.9
5.1
12.1
11.9
43.6
63.3
▲0.2
26.9
23.8
25.2
▲1.7
5.5
8.6
2.2 Apr.
19.1
3.5
16.5
22.9
8.3
16.4
16.5
▲0.0
36.4
12.6
34.8
2.1
0.8
▲0.5
1.4 May
9.1
▲0.5
11.2
17.5
0.1
▲3.9
▲11.9
0.7
12.2
▲15.1
26.1
0.8
▲7.2
▲1.2
▲3.7 Jun.
1.6 F.Y. 2018
0.9 Dec.
▲2.7 Jan. 2021
6.9
1.8
7.5
14.0
2.4
1.0
3.1
2.4
3.3
▲2.8
27.8
0.5
▲4.7
▲2.3
▲2.5 Jul.
13.1
▲1.4
14.4
12.6
▲3.2
▲9.0
▲12.2
▲1.1
1.4
▲12.7
12.6
0.4
▲11.0
▲5.0
▲6.1 Aug.
8.3
▲0.9
9.5
11.6
▲0.5
▲3.1
2.3
2.3
▲12.6
▲4.2
16.6
1.4
▲3.6
▲1.5
▲1.4 Sep.
▲1.4
▲3.7
0.3
11.5
0.9
0.5
▲1.9
3.6
▲19.6
2.5
25.8
1.5
0.2
▲2.1
0.7 Oct.
6.7
1.9
7.1
15.4
1.9
3.1
3.6
3.7
▲12.6
▲11.1
28.9
4.2
▲0.6
1.6
1.4 Nov.
1.0
0.7
2.3
7.9
1.2
3.0
2.2
0.4
▲8.4
▲8.8
23.5
1.2
▲1.8
6.3
▲0.5 Dec.
▲2.0
6.4
8.9
1.6
5.7
0.9
0.4
▲15.4
▲3.6
22.8
4.6
4.4
2.4
6.7
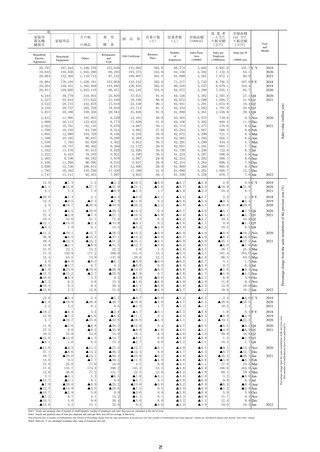
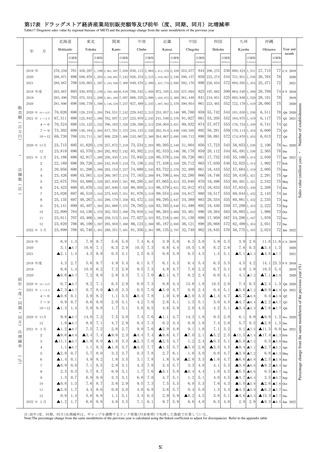
Note1 "Others" of wholesale trade refers to the items classified as 536,553,559(excluding 5598) under the Japan Standard Industrial Classification.
Note2 "Others" of retail trade refers to the items classified as 5914,592,60(excludeing 603 and 605) under the Japan Standard Industrial Classification.
Note3 "Reference(*3)" is total of "Medicine & Toiletry Stores" and "Others(*2)".
Note4 The percentage change from the same month/term of the previous year is calculated using the linked coefficient to adjust for discrepancies.Refer to the Appendix table.
15
4.5 Jan. 2022
Sales value ( billion yen )
Furniture
&
House
Furnishings
(%)
Retail
Others
医 薬 品
・
化 粧 品
小 売 業
Percentage change from the same month/term of the previous year
その他の
機械器具
卸 売 業
家 具・
建 具・
じゅう器
卸 売 業