
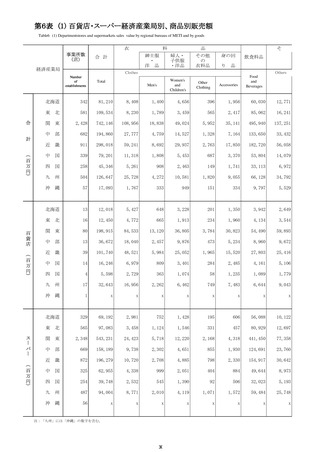
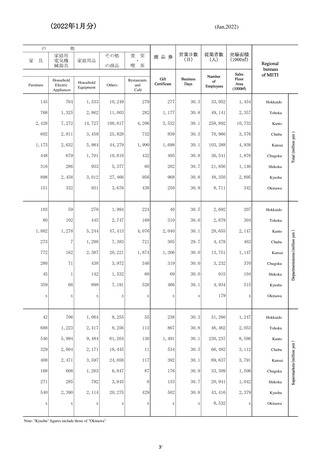

よむ、つかう、まなぶ。
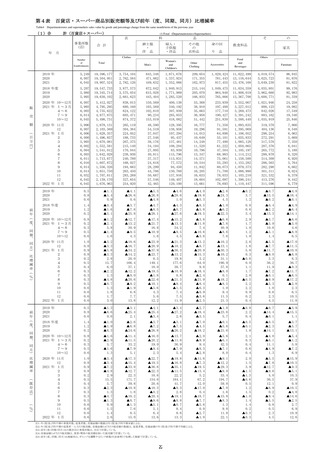
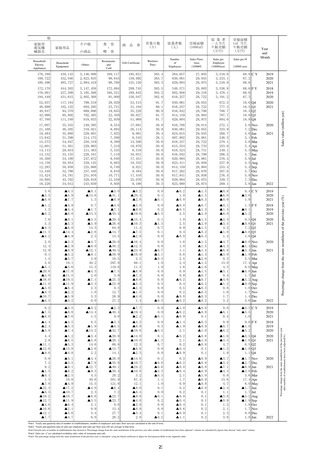
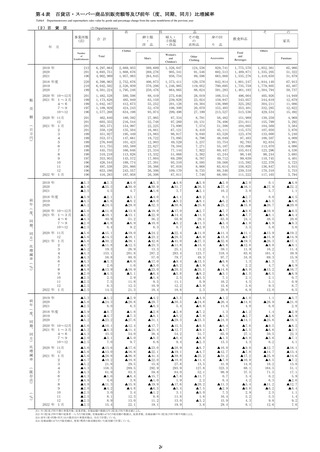
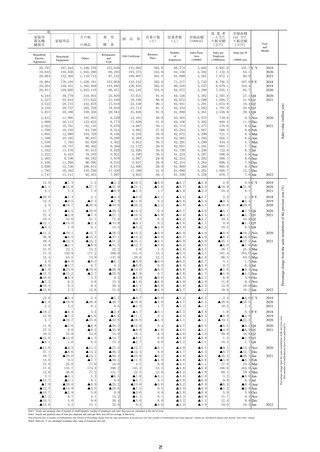
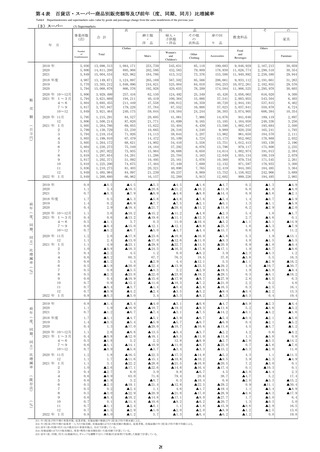
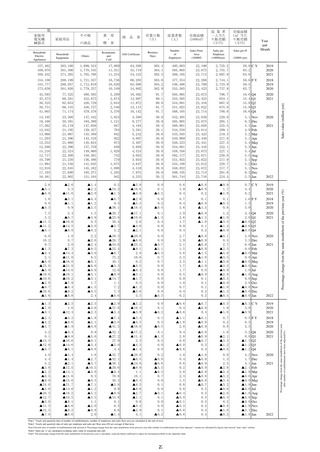
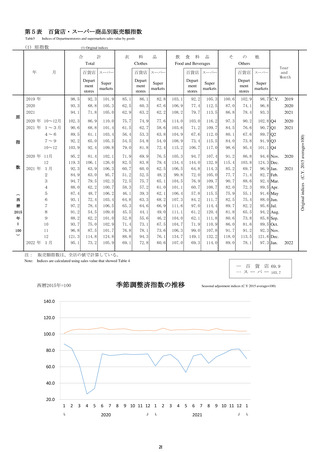
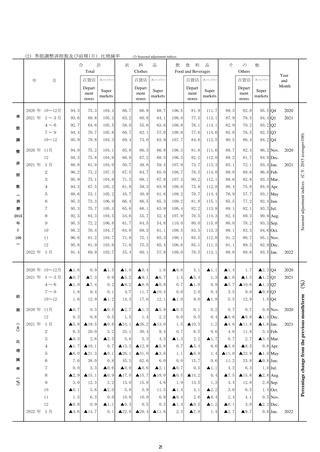
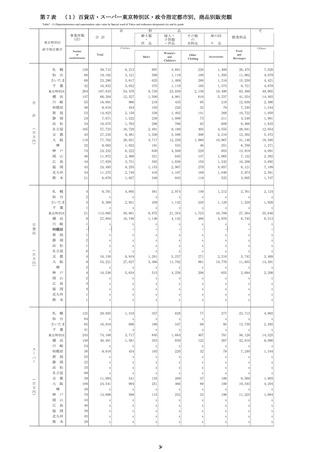
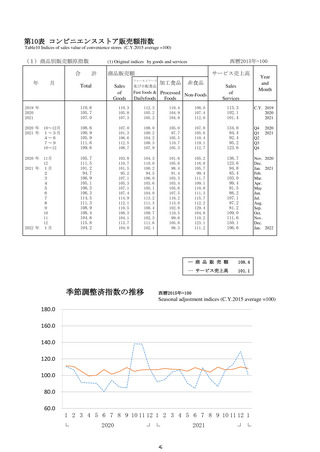
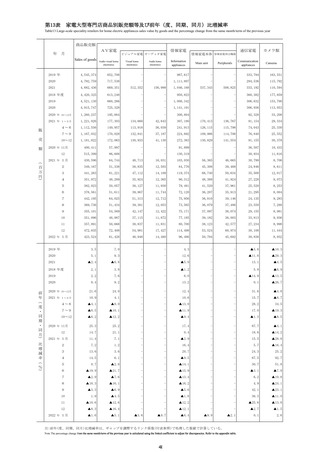
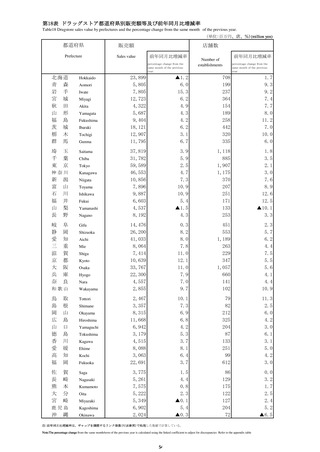
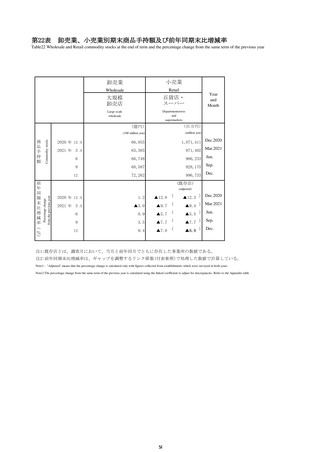
商業動態統計速報 (23 ページ)
出典
| 公開元URL | https://www.meti.go.jp/statistics/tyo/syoudou/result/sokuho_2.html |
| 出典情報 | 商業動態統計速報 2022年1月分(2/28)《経済産業省》 |
ページ画像
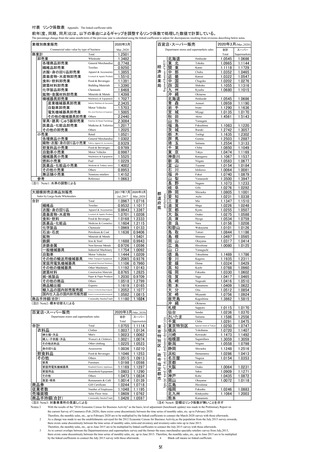
ダウンロードした画像を利用する際は「出典情報」を明記してください。
低解像度画像をダウンロード
プレーンテキスト
資料テキストはコンピュータによる自動処理で生成されており、完全に資料と一致しない場合があります。
テキストをコピーしてご利用いただく際は資料と付け合わせてご確認ください。
Household
Electric
Appliances
Household
Equipment
食
堂
・
の商品
Others
喫
商
品
券
営業日数
(日)
従業者数
(人)
売場面積
(1000㎡)
従 業 者
一人当た
り販売額
(万円)
売場面積
1㎡ 当た
り販売額
(万円)
Business
Days
Number
of
Employees
Sales Floor
Area
(1000㎡)
Sales per
Employee
(10000yen)
(10000 yen)
茶
Restaurants
and
Café
Gift Certificate
Year
and
Month
Sales per ㎡
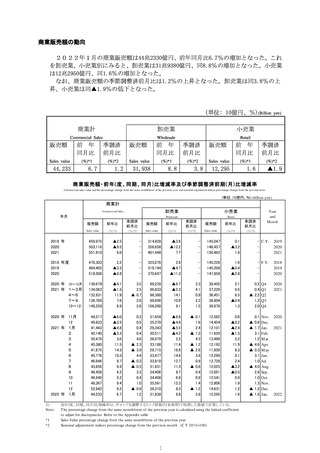
178,169
188,722
180,496
430,143
432,046
403,727
3,146,099
2,823,635
2,884,419
169,117
99,644
98,766
195,651
159,092
155,120
363.4
363.7
363.3
564,657
630,061
629,804
27,803
29,055
28,975
3,518.0
3,233.1
3,218.9
68.8 C Y
67.2
68.6
2019
2020
2021
172,170
176,081
194,449
444,303
427,508
431,615
3,147,458
3,105,568
2,802,368
172,694
160,521
91,000
209,745
189,843
156,047
363.5
364.2
362.6
548,571
602,956
618,257
28,003
29,316
28,722
3,536.8
3,478.1
3,191.2
68.6 F Y
68.6
67.3
2018
2019
2020
52,037
48,899
40,847
42,990
47,760
117,104
102,125
94,370
95,892
111,340
799,519
694,295
669,606
702,485
818,033
29,029
23,721
19,655
22,450
32,939
53,513
31,104
35,220
36,827
51,969
91.7
89.1
90.8
91.7
91.7
630,061
618,257
616,042
614,159
629,804
29,055
28,722
28,706
28,904
28,975
872.5
777.3
768.7
787.7
884.6
18.6
16.5
16.4
16.8
18.9
Q4
Q1
Q2
Q3
Q4
2020
2021
17,007
21,168
19,484
13,842
15,573
12,601
14,113
14,132
16,568
14,138
12,283
13,440
15,424
18,895
18,228
35,555
46,505
35,880
31,298
34,947
31,561
29,654
33,155
34,100
30,854
30,938
32,798
34,781
43,762
34,012
249,395
318,021
229,801
214,175
250,319
229,963
211,483
228,161
247,672
229,145
225,668
237,440
251,976
328,618
243,639
9,554
9,894
7,025
7,308
9,389
7,210
5,335
7,110
9,048
6,663
6,740
9,610
10,771
12,559
8,938
17,681
26,114
9,061
8,543
13,500
10,870
8,319
16,031
17,451
10,355
9,021
9,484
17,410
25,076
9,188
30.0
30.9
30.4
28.1
30.6
30.0
30.8
30.0
30.8
30.9
30.0
30.8
30.0
30.9
30.3
616,708
630,061
624,615
607,802
618,257
613,554
618,524
616,042
620,094
623,411
614,159
617,262
617,841
629,804
623,080
29,014
29,055
29,035
28,981
28,722
28,733
28,731
28,706
28,961
28,958
28,904
28,876
28,938
28,975
28,974
272.1
333.9
260.7
246.3
270.1
253.0
249.1
266.5
276.4
257.9
253.4
267.6
276.4
339.7
269.1
5.8
7.2
5.6
5.1
5.8
5.4
5.3
5.7
5.9
5.5
5.4
5.7
5.9
7.3
5.8
Nov
Dec
Jan
Feb
Mar
Apr
May
Jun
Jul
Aug
Sep
Oct
Nov
Dec
Jan
2020
3.6
▲3.5
▲6.0
▲4.5
▲5.9
▲7.7
▲0.1
▲13.6
1.3
▲3.0
▲41.1
▲0.9
▲8.2
▲20.4
▲2.8
0.0
0.1
▲0.1
▲0.2
1.0
▲0.0
▲1.5
▲1.5
▲0.3
▲0.8
▲6.0
▲0.0
0.4 C Y
▲3.6
1.9
2019
2020
2021
▲1.2
1.3
▲0.2
▲4.9
▲4.4
▲6.0
0.7
▲1.7
▲13.5
▲4.6
▲7.1
▲43.4
▲5.0
▲9.6
▲19.6
0.0
0.2
▲0.5
▲0.0
▲0.5
2.5
▲0.7
▲1.3
▲2.0
▲0.1
▲1.4
▲6.0
1.3 F Y
▲0.1
▲3.2
2018
2019
2020
7.6
5.3
▲9.3
▲11.3
▲8.2
▲0.1
▲5.3
▲6.0
▲14.4
▲4.9
▲3.5
▲5.9
14.3
▲2.8
2.3
▲29.4
▲26.8
64.8
▲14.7
13.5
▲15.4
▲10.3
11.4
▲7.5
▲2.9
0.1
▲1.3
0.7
0.1
0.0
1.0
2.5
0.9
0.4
▲0.0
▲1.5
▲2.0
▲1.5
▲0.2
▲0.3
▲2.4
▲3.5
4.2
▲1.8
1.4
0.5
▲0.6
7.2
▲0.6
1.6
Q4
Q1
Q2
Q3
Q4
2020
2021
2.0
12.4
12.9
0.1
1.5
3.6
▲6.1
▲20.8
▲5.0
▲18.0
▲11.0
▲3.0
▲9.3
▲10.7
▲6.5
▲3.3
▲2.9
▲6.9
▲5.2
▲3.7
10.1
▲5.6
▲17.8
▲11.5
▲19.5
▲11.9
▲6.4
▲2.2
▲5.9
▲5.2
▲4.7
▲8.0
▲12.1
▲9.1
3.9
40.2
15.3
▲4.3
2.0
▲7.1
▲3.3
2.3
1.0
3.3
6.0
▲28.6
▲36.2
▲49.5
▲30.9
18.5
297.8
119.6
▲7.5
5.9
▲25.3
▲23.9
0.3
12.7
26.9
27.2
▲16.4
▲12.3
▲23.9
▲10.9
2.5
66.1
11.3
▲8.9
▲7.3
▲9.8
▲5.3
▲2.4
▲1.5
▲4.0
1.4
0.0
0.0
▲0.7
▲3.1
▲0.3
1.0
1.0
0.0
0.0
0.0
0.3
0.0
0.0
0.0
▲0.3
1.6
1.0
1.1
0.6
2.5
2.4
1.6
0.9
0.9
▲0.2
0.4
0.5
0.2
▲0.0
▲0.2
▲1.5
▲1.5
▲1.4
▲1.4
▲2.0
▲1.5
▲1.6
▲1.5
▲0.7
▲0.7
▲0.2
▲0.3
▲0.3
▲0.3
▲0.2
▲4.7
▲4.3
▲6.8
▲3.9
0.3
13.0
4.3
▲3.1
0.4
▲4.6
▲1.2
0.8
1.6
1.7
3.2
▲0.0
▲1.4
▲3.4
▲1.9
5.5
17.4
6.0
▲0.0
1.7
▲5.2
▲0.0
1.8
1.7
1.4
3.6
Nov
Dec
Jan
Feb
Mar
Apr
May
Jun
Jul
Aug
Sep
Oct
Nov
Dec
Jan
2020
0.2
▲7.5
▲8.0
▲3.5
▲6.8
▲7.6
▲0.2
▲14.4
1.5
▲2.3
▲40.4
0.0
▲7.7
▲19.4
▲2.2
0.0
0.0
▲0.1
▲1.0
▲0.2
▲0.9
▲0.6
▲0.8
0.1
0.0
▲6.1
0.4
▲0.3 C Y
▲5.5
1.0
2019
2020
2021
▲4.4
▲2.4
▲3.8
▲4.5
▲3.3
▲7.4
0.5
▲1.9
▲14.2
▲3.3
▲6.5
▲42.7
▲4.3
▲8.9
▲18.8
0.0
0.3
▲0.5
▲1.4
▲1.9
2.1
▲0.3
▲0.9
▲1.0
0.9
▲0.7
▲6.2
0.6 F Y
▲1.0
▲5.2
2018
2019
2020
4.4
2.8
▲11.1
▲12.8
▲9.6
▲1.2
▲6.5
▲5.3
▲13.8
▲4.8
▲3.4
▲5.8
14.6
▲2.6
2.2
▲28.9
▲26.1
66.6
▲13.7
14.1
▲14.0
▲10.0
12.3
▲6.8
▲2.3
0.1
▲1.3
0.7
0.0
0.0
▲0.2
2.1
0.2
▲0.4
▲0.9
▲0.8
▲1.0
▲0.8
0.1
0.1
▲1.6
▲3.5
4.7
▲1.2
1.9
▲0.5
▲1.8
6.5
▲1.8
1.1
Q4
Q1
Q2
Q3
Q4
2020
2021
0.8
7.2
9.2
▲1.5
▲0.1
1.3
▲7.8
▲22.4
▲6.5
▲19.2
▲12.7
▲4.6
▲10.6
▲12.1
▲7.7
▲4.1
▲3.5
▲9.1
▲8.2
▲2.5
10.8
▲4.9
▲17.2
▲10.7
▲18.7
▲11.9
▲6.4
▲2.1
▲5.6
▲4.7
▲4.4
▲7.8
▲12.7
▲9.3
4.5
40.6
15.5
▲4.0
2.3
▲6.6
▲3.5
2.1
0.9
3.4
6.0
▲28.0
▲35.8
▲49.1
▲30.4
20.2
301.9
121.8
▲6.4
7.2
▲23.7
▲23.7
0.8
13.4
27.7
28.2
▲14.6
▲10.7
▲24.2
▲10.8
3.2
67.4
12.1
▲8.0
▲6.4
▲9.0
▲4.8
▲2.0
▲0.9
▲3.4
2.0
0.1
▲0.0
▲0.6
▲3.3
▲0.3
1.1
1.0
0.1
0.0
▲0.1
0.2
0.0
0.0
0.1
▲0.2
0.3
▲0.2
▲0.0
▲0.4
2.1
1.7
0.9
0.2
0.2
▲0.9
▲0.4
▲0.4
▲0.6
▲0.9
▲1.1
▲0.9
▲0.8
▲0.8
▲0.9
▲1.0
▲0.9
▲0.8
▲0.8
0.1
0.1
0.1
0.1
0.2
0.1
0.2
▲3.7
▲3.2
▲7.1
▲4.3
0.8
13.6
4.7
▲2.4
1.1
▲3.8
▲0.9
1.2
2.1
2.3
3.8
▲1.7
▲2.7
▲6.9
▲3.8
3.6
17.4
6.0
▲1.7
1.7
▲5.2
▲1.9
1.8
1.7
0.0
1.8
Nov
Dec
Jan
Feb
Mar
Apr
May
Jun
Jul
Aug
Sep
Oct
Nov
Dec
Jan
2020
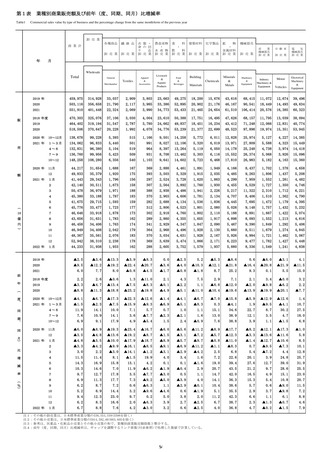
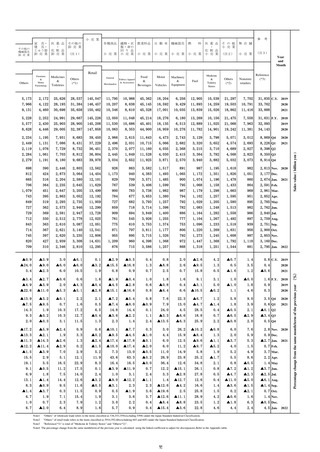
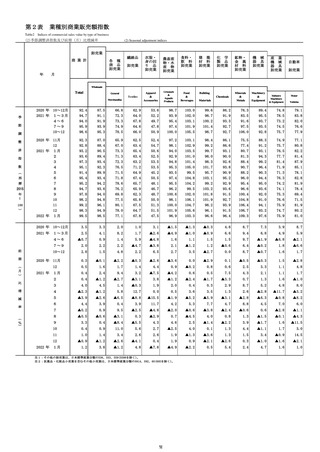
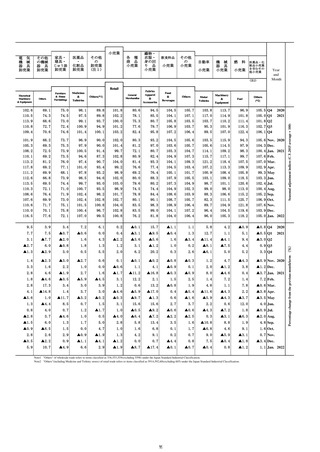
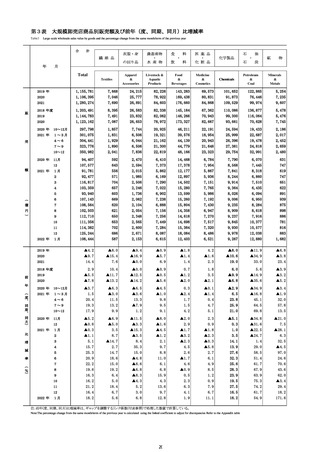
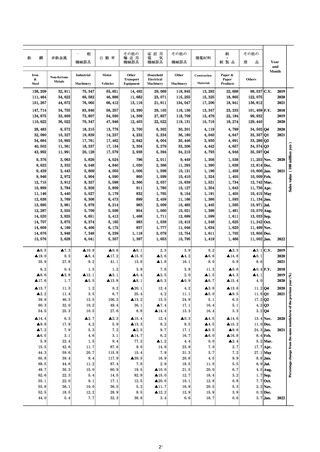
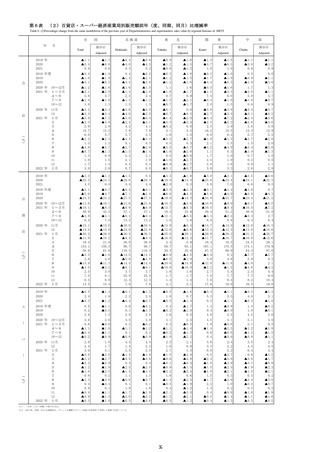
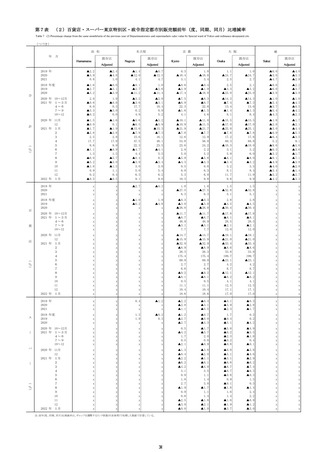
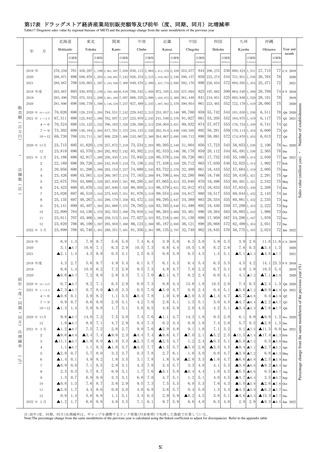
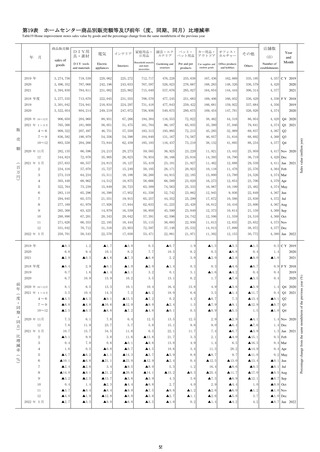
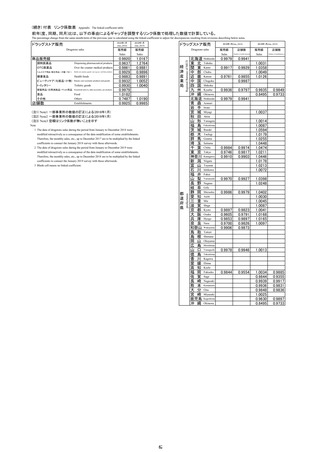
Note1 Yearly and quarterly data of number of establishments, number of employees and sales floor area are calculated at the end of term.
Note2 Yearly and quarterly data of sales per employee and sales per floor area (㎡) are average of that term.
Note3:Growth rates of number of establishments that showed at "Percentage change from the same month/term of the previous year after number of establisments have been adjusted " column are calculated by figures that showed "sales value" column.
Note4 Sales per ㎡ are calculated excluding sales value of restaurant and café.
Note5: The percentage change from the same month/term of the previous year is calculated using the linked coefficient to adjust for discrepancies.Refer to the Appendix table.
23
2021
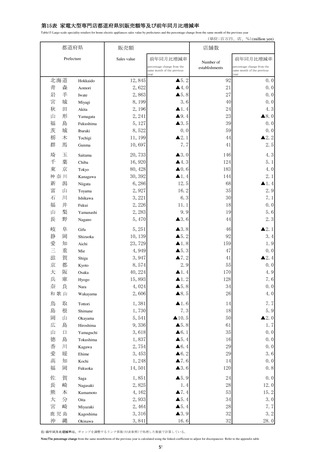
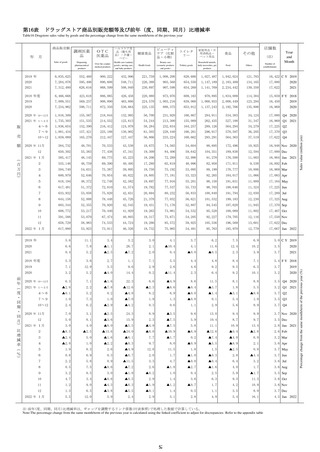
Sales value (million yen)
その他
2022
2021
Percentage change from the same month/term of the previous year (%)
家庭用品
2022
2021
2022
Percentage change from the same month/term of the previous year
after number of establishments have been adjusted(%).
他
家庭用
電気機
械器具
Electric
Appliances
Household
Equipment
食
堂
・
の商品
Others
喫
商
品
券
営業日数
(日)
従業者数
(人)
売場面積
(1000㎡)
従 業 者
一人当た
り販売額
(万円)
売場面積
1㎡ 当た
り販売額
(万円)
Business
Days
Number
of
Employees
Sales Floor
Area
(1000㎡)
Sales per
Employee
(10000yen)
(10000 yen)
茶
Restaurants
and
Café
Gift Certificate
Year
and
Month
Sales per ㎡
178,169
188,722
180,496
430,143
432,046
403,727
3,146,099
2,823,635
2,884,419
169,117
99,644
98,766
195,651
159,092
155,120
363.4
363.7
363.3
564,657
630,061
629,804
27,803
29,055
28,975
3,518.0
3,233.1
3,218.9
68.8 C Y
67.2
68.6
2019
2020
2021
172,170
176,081
194,449
444,303
427,508
431,615
3,147,458
3,105,568
2,802,368
172,694
160,521
91,000
209,745
189,843
156,047
363.5
364.2
362.6
548,571
602,956
618,257
28,003
29,316
28,722
3,536.8
3,478.1
3,191.2
68.6 F Y
68.6
67.3
2018
2019
2020
52,037
48,899
40,847
42,990
47,760
117,104
102,125
94,370
95,892
111,340
799,519
694,295
669,606
702,485
818,033
29,029
23,721
19,655
22,450
32,939
53,513
31,104
35,220
36,827
51,969
91.7
89.1
90.8
91.7
91.7
630,061
618,257
616,042
614,159
629,804
29,055
28,722
28,706
28,904
28,975
872.5
777.3
768.7
787.7
884.6
18.6
16.5
16.4
16.8
18.9
Q4
Q1
Q2
Q3
Q4
2020
2021
17,007
21,168
19,484
13,842
15,573
12,601
14,113
14,132
16,568
14,138
12,283
13,440
15,424
18,895
18,228
35,555
46,505
35,880
31,298
34,947
31,561
29,654
33,155
34,100
30,854
30,938
32,798
34,781
43,762
34,012
249,395
318,021
229,801
214,175
250,319
229,963
211,483
228,161
247,672
229,145
225,668
237,440
251,976
328,618
243,639
9,554
9,894
7,025
7,308
9,389
7,210
5,335
7,110
9,048
6,663
6,740
9,610
10,771
12,559
8,938
17,681
26,114
9,061
8,543
13,500
10,870
8,319
16,031
17,451
10,355
9,021
9,484
17,410
25,076
9,188
30.0
30.9
30.4
28.1
30.6
30.0
30.8
30.0
30.8
30.9
30.0
30.8
30.0
30.9
30.3
616,708
630,061
624,615
607,802
618,257
613,554
618,524
616,042
620,094
623,411
614,159
617,262
617,841
629,804
623,080
29,014
29,055
29,035
28,981
28,722
28,733
28,731
28,706
28,961
28,958
28,904
28,876
28,938
28,975
28,974
272.1
333.9
260.7
246.3
270.1
253.0
249.1
266.5
276.4
257.9
253.4
267.6
276.4
339.7
269.1
5.8
7.2
5.6
5.1
5.8
5.4
5.3
5.7
5.9
5.5
5.4
5.7
5.9
7.3
5.8
Nov
Dec
Jan
Feb
Mar
Apr
May
Jun
Jul
Aug
Sep
Oct
Nov
Dec
Jan
2020
3.6
▲3.5
▲6.0
▲4.5
▲5.9
▲7.7
▲0.1
▲13.6
1.3
▲3.0
▲41.1
▲0.9
▲8.2
▲20.4
▲2.8
0.0
0.1
▲0.1
▲0.2
1.0
▲0.0
▲1.5
▲1.5
▲0.3
▲0.8
▲6.0
▲0.0
0.4 C Y
▲3.6
1.9
2019
2020
2021
▲1.2
1.3
▲0.2
▲4.9
▲4.4
▲6.0
0.7
▲1.7
▲13.5
▲4.6
▲7.1
▲43.4
▲5.0
▲9.6
▲19.6
0.0
0.2
▲0.5
▲0.0
▲0.5
2.5
▲0.7
▲1.3
▲2.0
▲0.1
▲1.4
▲6.0
1.3 F Y
▲0.1
▲3.2
2018
2019
2020
7.6
5.3
▲9.3
▲11.3
▲8.2
▲0.1
▲5.3
▲6.0
▲14.4
▲4.9
▲3.5
▲5.9
14.3
▲2.8
2.3
▲29.4
▲26.8
64.8
▲14.7
13.5
▲15.4
▲10.3
11.4
▲7.5
▲2.9
0.1
▲1.3
0.7
0.1
0.0
1.0
2.5
0.9
0.4
▲0.0
▲1.5
▲2.0
▲1.5
▲0.2
▲0.3
▲2.4
▲3.5
4.2
▲1.8
1.4
0.5
▲0.6
7.2
▲0.6
1.6
Q4
Q1
Q2
Q3
Q4
2020
2021
2.0
12.4
12.9
0.1
1.5
3.6
▲6.1
▲20.8
▲5.0
▲18.0
▲11.0
▲3.0
▲9.3
▲10.7
▲6.5
▲3.3
▲2.9
▲6.9
▲5.2
▲3.7
10.1
▲5.6
▲17.8
▲11.5
▲19.5
▲11.9
▲6.4
▲2.2
▲5.9
▲5.2
▲4.7
▲8.0
▲12.1
▲9.1
3.9
40.2
15.3
▲4.3
2.0
▲7.1
▲3.3
2.3
1.0
3.3
6.0
▲28.6
▲36.2
▲49.5
▲30.9
18.5
297.8
119.6
▲7.5
5.9
▲25.3
▲23.9
0.3
12.7
26.9
27.2
▲16.4
▲12.3
▲23.9
▲10.9
2.5
66.1
11.3
▲8.9
▲7.3
▲9.8
▲5.3
▲2.4
▲1.5
▲4.0
1.4
0.0
0.0
▲0.7
▲3.1
▲0.3
1.0
1.0
0.0
0.0
0.0
0.3
0.0
0.0
0.0
▲0.3
1.6
1.0
1.1
0.6
2.5
2.4
1.6
0.9
0.9
▲0.2
0.4
0.5
0.2
▲0.0
▲0.2
▲1.5
▲1.5
▲1.4
▲1.4
▲2.0
▲1.5
▲1.6
▲1.5
▲0.7
▲0.7
▲0.2
▲0.3
▲0.3
▲0.3
▲0.2
▲4.7
▲4.3
▲6.8
▲3.9
0.3
13.0
4.3
▲3.1
0.4
▲4.6
▲1.2
0.8
1.6
1.7
3.2
▲0.0
▲1.4
▲3.4
▲1.9
5.5
17.4
6.0
▲0.0
1.7
▲5.2
▲0.0
1.8
1.7
1.4
3.6
Nov
Dec
Jan
Feb
Mar
Apr
May
Jun
Jul
Aug
Sep
Oct
Nov
Dec
Jan
2020
0.2
▲7.5
▲8.0
▲3.5
▲6.8
▲7.6
▲0.2
▲14.4
1.5
▲2.3
▲40.4
0.0
▲7.7
▲19.4
▲2.2
0.0
0.0
▲0.1
▲1.0
▲0.2
▲0.9
▲0.6
▲0.8
0.1
0.0
▲6.1
0.4
▲0.3 C Y
▲5.5
1.0
2019
2020
2021
▲4.4
▲2.4
▲3.8
▲4.5
▲3.3
▲7.4
0.5
▲1.9
▲14.2
▲3.3
▲6.5
▲42.7
▲4.3
▲8.9
▲18.8
0.0
0.3
▲0.5
▲1.4
▲1.9
2.1
▲0.3
▲0.9
▲1.0
0.9
▲0.7
▲6.2
0.6 F Y
▲1.0
▲5.2
2018
2019
2020
4.4
2.8
▲11.1
▲12.8
▲9.6
▲1.2
▲6.5
▲5.3
▲13.8
▲4.8
▲3.4
▲5.8
14.6
▲2.6
2.2
▲28.9
▲26.1
66.6
▲13.7
14.1
▲14.0
▲10.0
12.3
▲6.8
▲2.3
0.1
▲1.3
0.7
0.0
0.0
▲0.2
2.1
0.2
▲0.4
▲0.9
▲0.8
▲1.0
▲0.8
0.1
0.1
▲1.6
▲3.5
4.7
▲1.2
1.9
▲0.5
▲1.8
6.5
▲1.8
1.1
Q4
Q1
Q2
Q3
Q4
2020
2021
0.8
7.2
9.2
▲1.5
▲0.1
1.3
▲7.8
▲22.4
▲6.5
▲19.2
▲12.7
▲4.6
▲10.6
▲12.1
▲7.7
▲4.1
▲3.5
▲9.1
▲8.2
▲2.5
10.8
▲4.9
▲17.2
▲10.7
▲18.7
▲11.9
▲6.4
▲2.1
▲5.6
▲4.7
▲4.4
▲7.8
▲12.7
▲9.3
4.5
40.6
15.5
▲4.0
2.3
▲6.6
▲3.5
2.1
0.9
3.4
6.0
▲28.0
▲35.8
▲49.1
▲30.4
20.2
301.9
121.8
▲6.4
7.2
▲23.7
▲23.7
0.8
13.4
27.7
28.2
▲14.6
▲10.7
▲24.2
▲10.8
3.2
67.4
12.1
▲8.0
▲6.4
▲9.0
▲4.8
▲2.0
▲0.9
▲3.4
2.0
0.1
▲0.0
▲0.6
▲3.3
▲0.3
1.1
1.0
0.1
0.0
▲0.1
0.2
0.0
0.0
0.1
▲0.2
0.3
▲0.2
▲0.0
▲0.4
2.1
1.7
0.9
0.2
0.2
▲0.9
▲0.4
▲0.4
▲0.6
▲0.9
▲1.1
▲0.9
▲0.8
▲0.8
▲0.9
▲1.0
▲0.9
▲0.8
▲0.8
0.1
0.1
0.1
0.1
0.2
0.1
0.2
▲3.7
▲3.2
▲7.1
▲4.3
0.8
13.6
4.7
▲2.4
1.1
▲3.8
▲0.9
1.2
2.1
2.3
3.8
▲1.7
▲2.7
▲6.9
▲3.8
3.6
17.4
6.0
▲1.7
1.7
▲5.2
▲1.9
1.8
1.7
0.0
1.8
Nov
Dec
Jan
Feb
Mar
Apr
May
Jun
Jul
Aug
Sep
Oct
Nov
Dec
Jan
2020
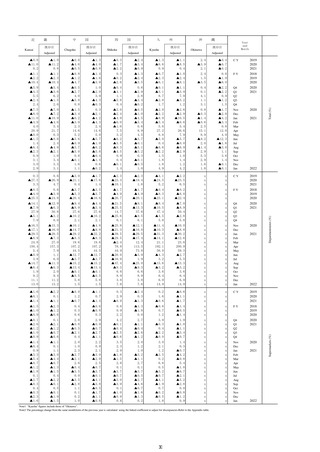
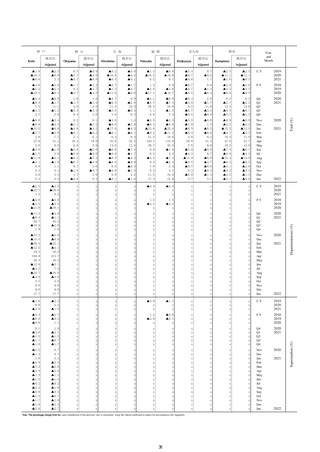
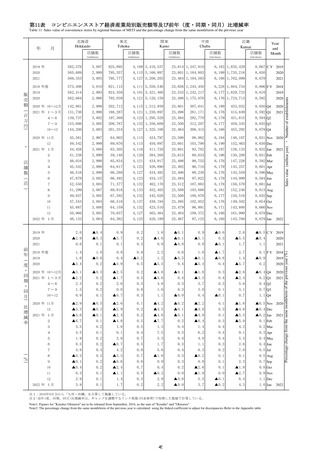
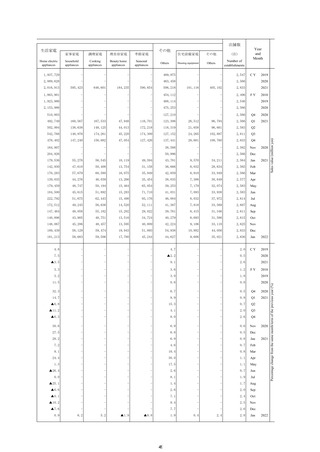
Note1 Yearly and quarterly data of number of establishments, number of employees and sales floor area are calculated at the end of term.
Note2 Yearly and quarterly data of sales per employee and sales per floor area (㎡) are average of that term.
Note3:Growth rates of number of establishments that showed at "Percentage change from the same month/term of the previous year after number of establisments have been adjusted " column are calculated by figures that showed "sales value" column.
Note4 Sales per ㎡ are calculated excluding sales value of restaurant and café.
Note5: The percentage change from the same month/term of the previous year is calculated using the linked coefficient to adjust for discrepancies.Refer to the Appendix table.
23
2021
Sales value (million yen)
その他
2022
2021
Percentage change from the same month/term of the previous year (%)
家庭用品
2022
2021
2022
Percentage change from the same month/term of the previous year
after number of establishments have been adjusted(%).
他
家庭用
電気機
械器具