
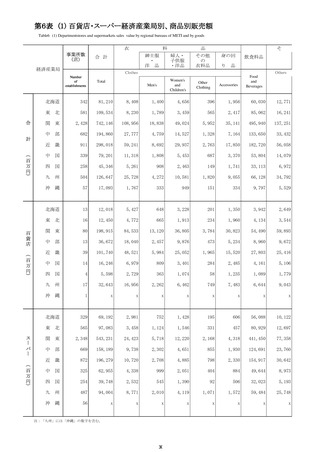
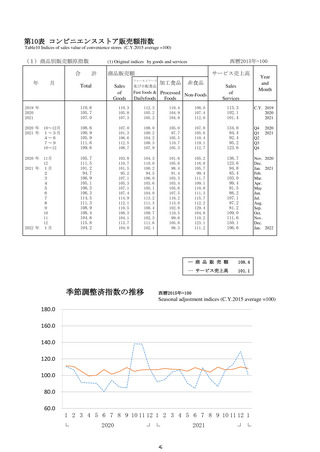
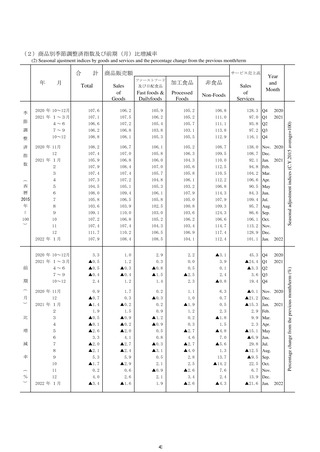
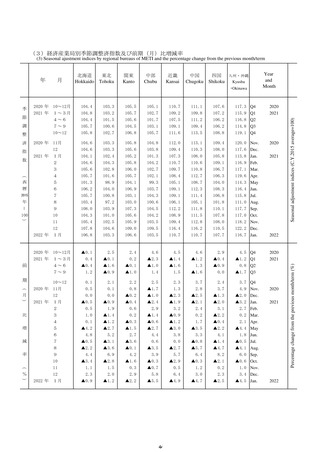
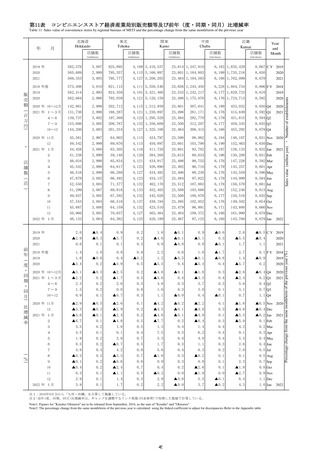

よむ、つかう、まなぶ。
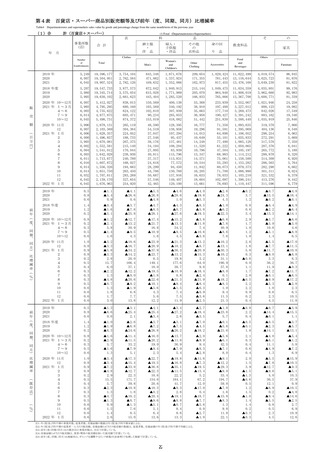
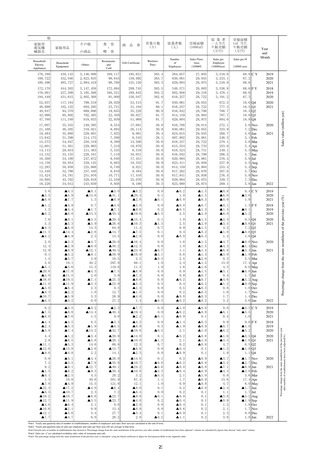
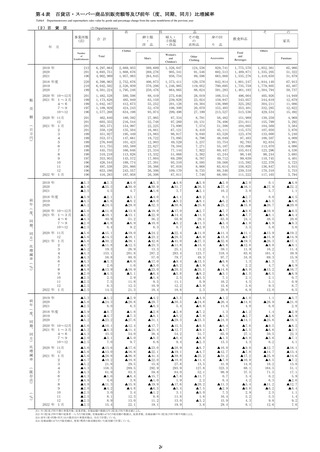
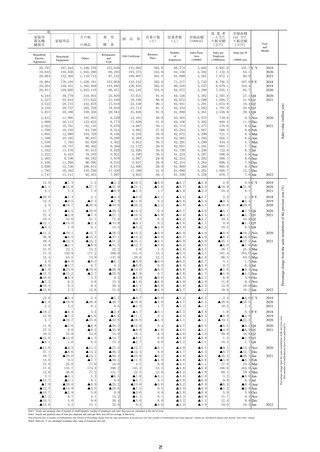
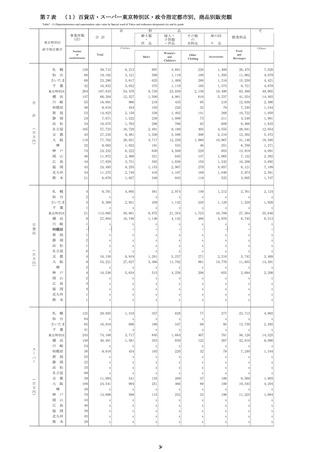
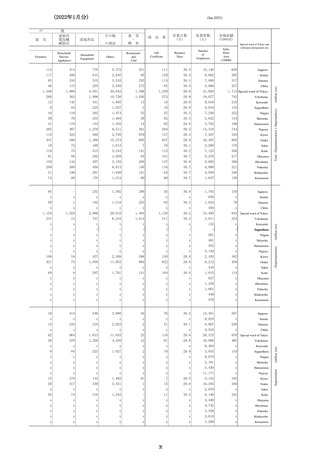
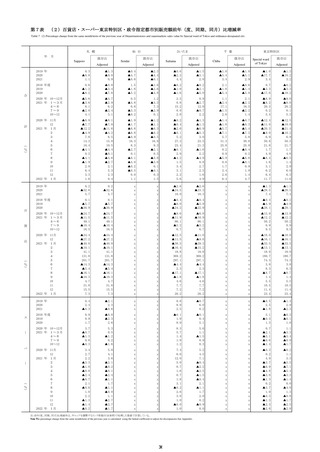
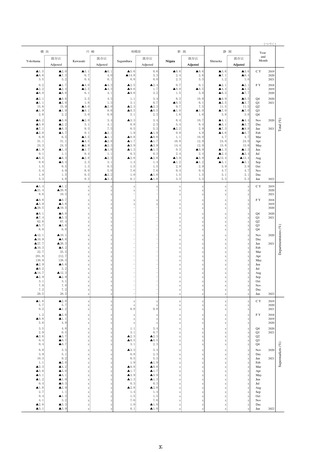
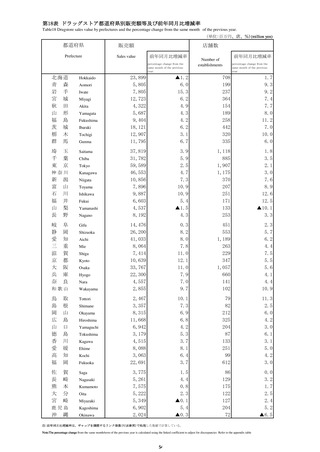
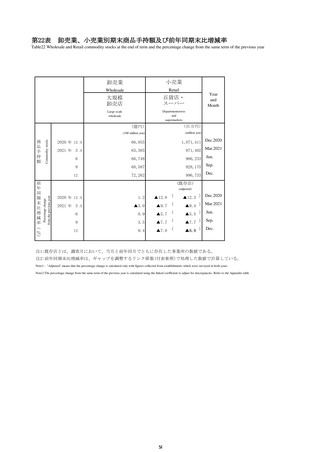
商業動態統計速報 (25 ページ)
出典
| 公開元URL | https://www.meti.go.jp/statistics/tyo/syoudou/result/sokuho_2.html |
| 出典情報 | 商業動態統計速報 2022年1月分(2/28)《経済産業省》 |
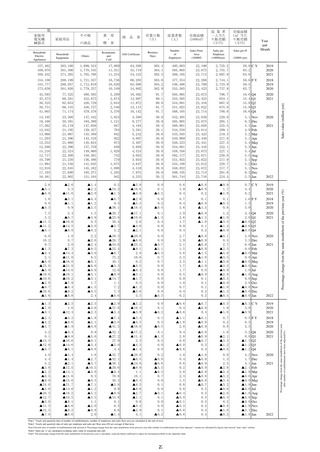
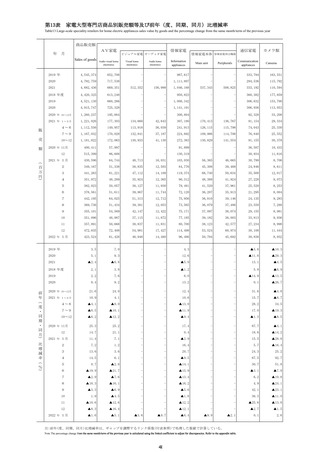
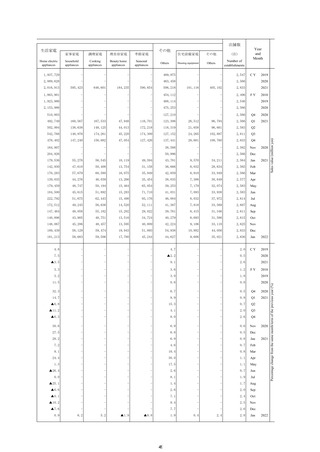
ページ画像
ダウンロードした画像を利用する際は「出典情報」を明記してください。
低解像度画像をダウンロード
プレーンテキスト
資料テキストはコンピュータによる自動処理で生成されており、完全に資料と一致しない場合があります。
テキストをコピーしてご利用いただく際は資料と付け合わせてご確認ください。
Household
Electric
Appliances
Household
Equipment
食
堂
・
の商品
Others
喫
商
品
券
営業日数
(日)
従業者数
(人)
売場面積
(1000㎡)
従 業 者
一人当た
り販売額
(万円)
売場面積
1㎡ 当た
り販売額
(万円)
Business
Days
Number
of
Employees
Sales Floor
Area
(1000㎡)
Sales per
Employee
(10000yen)
Sales per ㎡
茶
Restaurants
and
Café
Gift Certificate
Year
and
Month
(10000 yen)
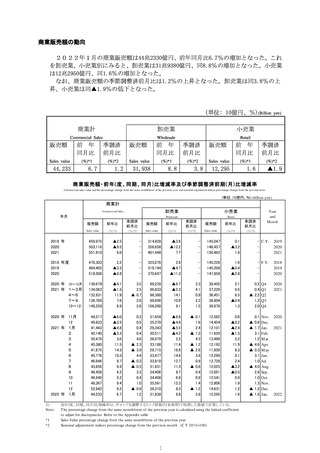
20,707
19,643
20,064
167,044
130,656
132,463
1,446,576
1,045,290
1,118,713
152,049
88,293
87,532
131,083
103,373
100,997
362.0
355.6
361.8
68,774
64,156
61,699
5,605
5,382
5,261
8,907.0
7,132.3
7,872.1
107.7 C Y
84.1
90.9
2019
2020
2021
18,064
20,304
20,811
176,104
159,451
129,685
1,426,101
1,392,949
1,023,110
155,958
143,695
80,451
143,542
126,835
101,245
362.0
362.6
354.8
71,217
66,550
62,672
5,743
5,547
5,299
8,705.3
8,679.1
7,045.1
107.0 F Y
104.4
82.7
2018
2019
2020
6,444
5,427
4,522
4,258
5,857
39,779
33,844
28,715
29,737
40,166
318,934
271,622
242,878
265,758
338,456
25,820
21,048
17,010
19,910
29,564
37,021
18,108
23,348
23,714
35,828
91.8
88.6
90.1
91.3
91.8
64,156
62,672
62,041
62,234
61,699
5,382
5,299
5,291
5,282
5,261
2,307.4
1,856.7
1,672.8
1,797.9
2,548.6
27.1
21.6
19.4
20.6
29.4
Q4
Q1
Q2
Q3
Q4
2020
2021
2,812
1,999
2,022
1,799
1,605
1,398
1,558
1,566
1,352
1,422
1,485
1,456
2,608
1,792
1,747
11,995
16,113
10,761
10,103
12,980
10,165
7,793
10,757
11,576
8,453
9,708
11,268
12,736
16,162
11,111
101,953
123,622
82,145
84,748
104,729
86,647
65,829
90,402
97,813
78,763
89,182
96,395
106,814
135,246
92,455
8,529
8,773
6,078
6,524
8,446
6,288
4,462
6,260
8,020
5,921
5,970
8,535
9,673
11,356
7,997
13,101
17,838
4,867
4,982
8,258
6,264
4,912
12,172
12,926
5,700
5,087
5,837
12,890
17,100
4,855
29.9
31.0
30.1
27.6
30.9
29.8
30.5
29.8
30.9
30.5
29.9
30.9
29.9
31.0
30.1
64,303
64,156
63,714
63,244
62,672
62,565
62,291
62,041
61,738
61,234
62,234
62,154
61,809
61,699
61,336
5,375
5,382
5,377
5,367
5,299
5,293
5,290
5,291
5,288
5,287
5,282
5,264
5,266
5,261
5,258
719.8
940.4
570.6
566.3
721.1
565.1
444.4
663.7
722.0
506.6
568.7
686.3
805.0
1,058.7
678.7
8.5
11.0
6.6
6.6
8.4
6.6
5.1
7.7
8.3
5.8
6.6
7.9
9.3
12.2
7.8
Nov
Dec
Jan
Feb
Mar
Apr
May
Jun
Jul
Aug
Sep
Oct
Nov
Dec
Jan
2020
12.0
▲5.1
2.1
▲7.3
▲21.8
1.4
1.5
▲27.7
7.0
▲3.3
▲41.9
▲0.9
▲10.3
▲21.1
▲2.3
▲0.0
▲1.8
1.7
▲5.7
▲6.7
▲3.8
▲3.9
▲4.0
▲2.3
2.8
▲19.9
10.4
0.9 C Y
▲21.9
8.1
2019
2020
2021
▲20.0
12.4
2.5
▲7.4
▲9.5
▲18.7
2.1
▲2.3
▲26.6
▲4.4
▲7.9
▲44.0
▲6.0
▲11.6
▲20.2
▲0.1
0.2
▲2.2
▲4.5
▲6.6
▲5.8
▲3.7
▲3.4
▲4.5
2.4
▲0.3
▲18.8
2.1 F Y
▲2.4
▲20.8
2018
2019
2020
11.7
27.4
10.3
▲12.1
▲9.1
▲4.5
▲2.8
33.6
▲14.0
1.0
▲10.0
▲7.5
51.7
▲2.4
6.1
▲29.5
▲27.1
71.8
▲15.9
14.5
▲14.2
▲10.5
16.5
▲9.1
▲3.2
0.4
▲0.9
8.2
0.2
▲0.0
▲6.7
▲5.8
▲6.2
▲3.6
▲3.8
▲4.0
▲4.5
▲3.7
▲1.7
▲2.3
▲5.1
▲4.1
49.5
0.9
10.5
▲7.5
▲5.7
45.9
▲1.4
8.5
Q4
Q1
Q2
Q3
Q4
2020
2021
▲11.2
36.9
49.4
13.9
21.0
17.3
12.4
3.0
▲15.8
▲7.9
▲12.3
▲10.8
▲7.3
▲10.4
▲13.6
▲10.1
▲8.5
▲22.4
▲2.1
22.1
130.9
44.5
▲8.0
▲4.7
▲23.0
▲15.2
▲3.4
6.2
0.3
3.3
▲12.7
▲15.3
▲25.2
▲8.9
15.2
171.2
74.9
▲0.2
6.7
▲10.6
▲3.7
3.3
4.8
9.4
12.6
▲28.5
▲37.1
▲51.2
▲31.5
22.2
389.0
147.0
▲8.1
5.1
▲26.9
▲25.0
0.2
13.4
29.4
31.6
▲14.2
▲14.2
▲25.1
▲12.7
2.8
141.5
20.6
▲9.0
▲6.9
▲14.6
▲7.9
▲4.0
▲1.6
▲4.1
▲0.2
▲0.0
▲0.0
▲0.3
▲3.8
1.3
13.3
12.1
▲0.0
0.3
▲0.3
0.7
▲0.0
▲0.0
▲0.0
▲0.0
▲6.9
▲6.7
▲6.9
▲6.2
▲5.8
▲5.4
▲5.8
▲6.2
▲6.4
▲6.8
▲3.6
▲3.3
▲3.9
▲3.8
▲3.7
▲4.0
▲4.0
▲4.0
▲3.5
▲4.5
▲3.7
▲3.8
▲3.7
▲3.8
▲3.8
▲1.7
▲2.1
▲2.0
▲2.3
▲2.2
▲8.8
▲8.3
▲25.1
▲6.0
26.7
167.4
68.5
3.1
9.7
▲7.6
▲1.0
6.0
11.8
12.6
18.9
▲10.5
▲10.6
▲27.5
▲7.0
25.4
164.0
64.5
1.3
6.4
▲9.4
▲1.5
3.9
9.4
10.9
18.2
Nov
Dec
Jan
Feb
Mar
Apr
May
Jun
Jul
Aug
Sep
Oct
Nov
Dec
Jan
2020
12.6
▲4.9
2.2
▲5.4
▲19.9
3.2
2.4
▲26.9
8.1
▲2.2
▲40.7
0.5
▲9.7
▲19.9
▲1.3
▲0.0
▲1.9
1.7
▲3.4
▲4.7
▲3.2
▲0.5
▲0.5
▲1.1
2.4
▲20.6
10.5
▲0.6 C Y
▲23.5
7.1
2019
2020
2021
▲19.2
12.8
2.7
▲6.4
▲7.5
▲16.7
3.5
▲1.6
▲25.6
▲2.8
▲6.8
▲42.8
▲4.7
▲11.1
▲18.8
▲0.1
0.1
▲2.3
▲3.2
▲4.3
▲4.1
▲0.8
▲0.5
▲1.1
1.9
▲0.9
▲19.3
0.4 F Y
▲4.0
▲22.2
2018
2019
2020
11.9
27.5
10.5
▲12.0
▲9.1
▲2.6
0.0
35.9
▲12.0
1.6
▲8.8
▲6.2
53.6
▲1.3
6.5
▲28.5
▲25.9
74.8
▲14.7
15.3
▲12.6
▲9.0
18.1
▲8.1
▲2.7
0.4
▲1.0
8.3
0.0
0.0
▲4.7
▲4.1
▲4.6
▲3.0
▲3.2
▲0.5
▲1.1
▲1.0
▲0.9
▲1.1
▲5.5
▲4.0
49.9
1.3
10.3
▲9.1
▲6.9
44.8
▲1.9
7.7
Q4
Q1
Q2
Q3
Q4
2020
2021
▲11.0
37.1
49.7
14.0
21.0
17.6
12.6
3.1
▲15.7
▲7.9
▲12.3
▲10.7
▲7.2
▲10.3
▲13.6
▲8.3
▲6.6
▲20.0
0.5
25.8
133.7
46.6
▲6.1
▲2.1
▲20.0
▲14.9
▲2.9
6.7
1.0
4.3
▲11.5
▲14.2
▲24.1
▲7.7
17.0
174.4
77.2
1.2
8.1
▲8.9
▲3.5
3.6
5.1
9.8
13.1
▲27.5
▲36.2
▲50.4
▲30.5
24.6
398.2
151.7
▲6.5
6.8
▲25.2
▲24.6
0.9
14.2
30.4
32.8
▲12.7
▲12.4
▲23.8
▲11.3
4.5
145.2
22.5
▲7.8
▲5.7
▲13.6
▲7.5
▲3.6
▲1.1
▲3.6
0.2
▲0.1
0.0
▲0.2
▲3.9
0.9
13.5
12.6
▲0.1
0.1
▲0.6
0.5
0.0
0.1
0.0
▲0.0
▲4.9
▲4.7
▲4.8
▲4.6
▲4.1
▲3.8
▲4.2
▲4.6
▲4.8
▲5.2
▲3.0
▲2.8
▲3.3
▲3.2
▲3.0
▲0.5
▲0.5
▲0.5
▲0.6
▲1.1
▲0.9
▲1.0
▲1.0
▲0.9
▲0.9
▲0.9
▲0.9
▲0.8
▲1.1
▲1.0
▲9.1
▲8.7
▲25.2
▲5.9
27.0
168.6
69.1
3.2
9.9
▲6.4
▲1.2
5.9
11.7
12.4
19.0
▲12.4
▲12.7
▲28.3
▲8.3
23.5
164.0
59.4
▲0.0
6.4
▲9.4
▲2.9
3.9
9.4
9.9
16.4
Nov
Dec
Jan
Feb
Mar
Apr
May
Jun
Jul
Aug
Sep
Oct
Nov
Dec
Jan
2020
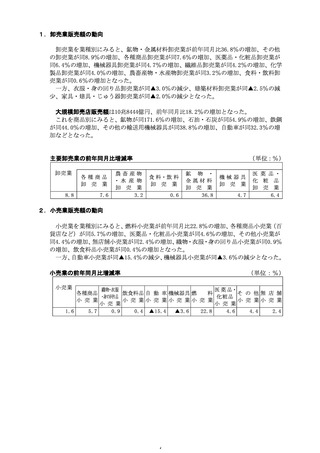
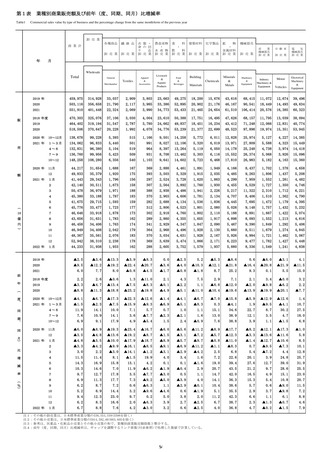
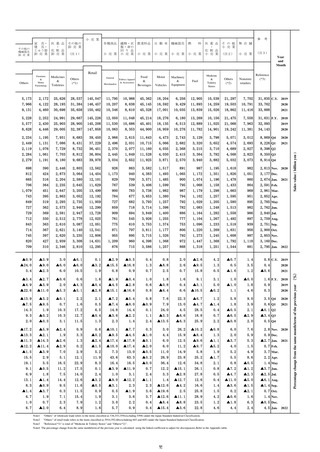
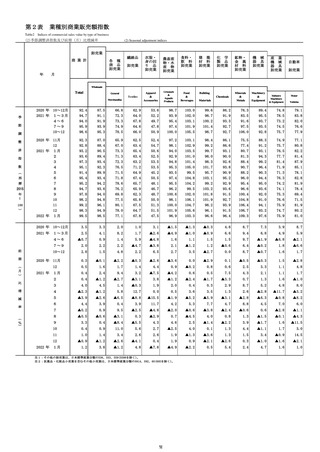
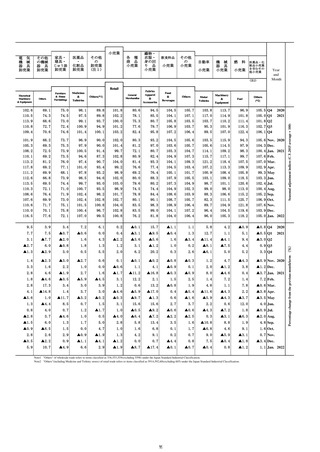
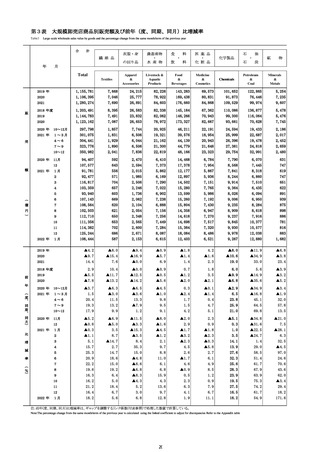
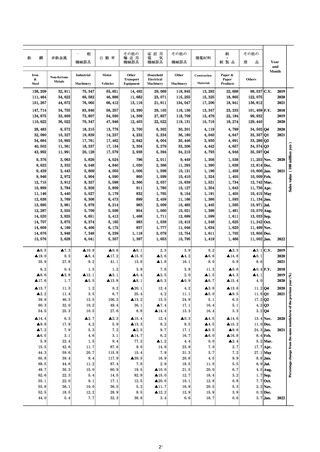
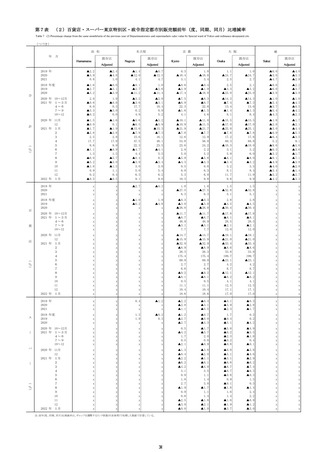
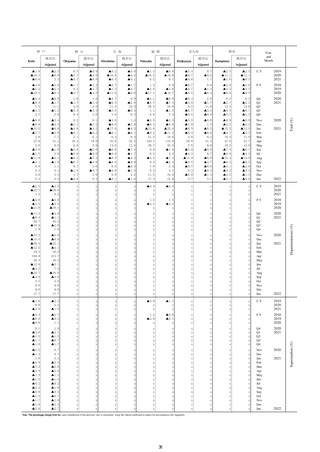
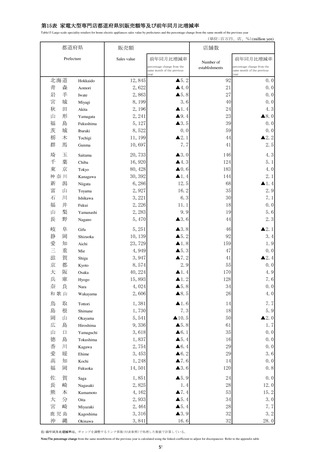
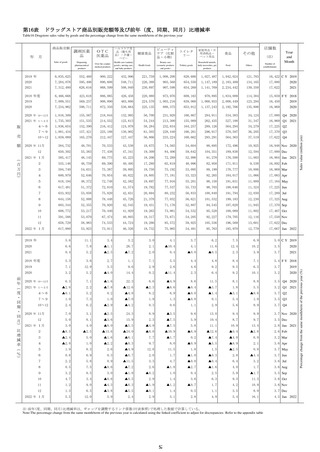
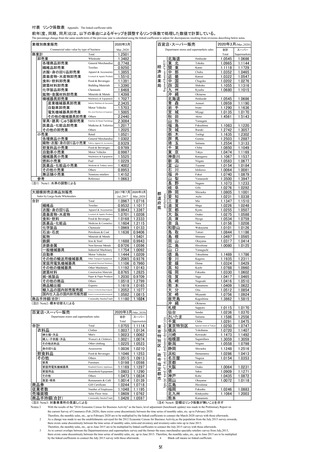
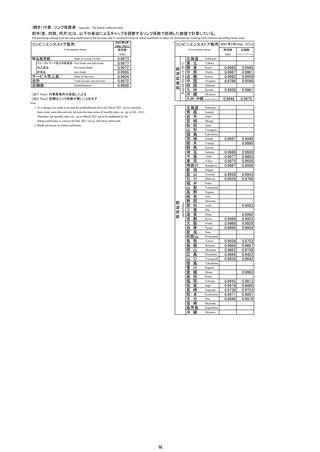
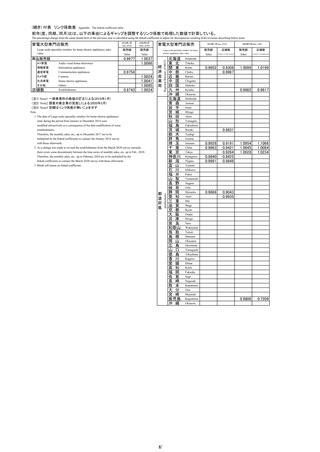
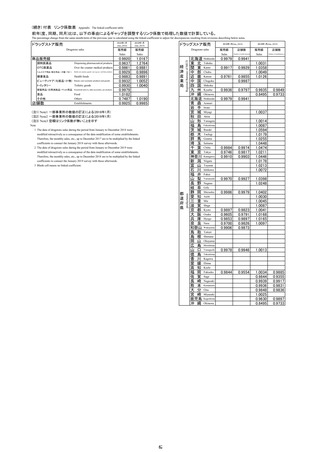
Note1 Yearly and quarterly data of number of establishments, number of employees and sales floor area are calculated at the end of term.
Note2 Yearly and quarterly data of sales per employee and sales per floor area (㎡) are average of that term.
Note3:Growth rates of number of establishments that showed at "Percentage change from the same month/term of the previous year after number of establisments have been adjusted " column are calculated by figures that showed "sales value" column.
Note4 Sales per ㎡ are calculated excluding sales value of restaurant and café.
25
2021
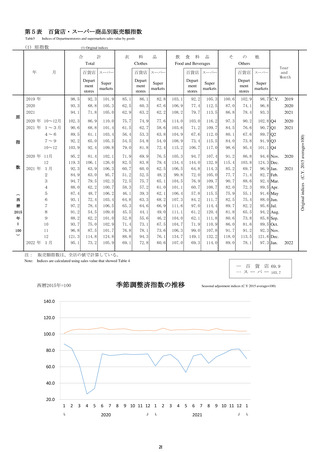
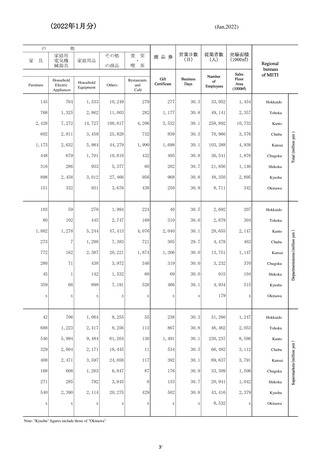
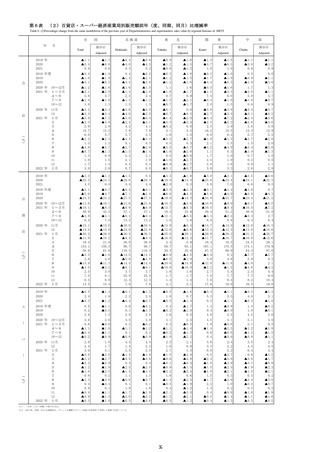
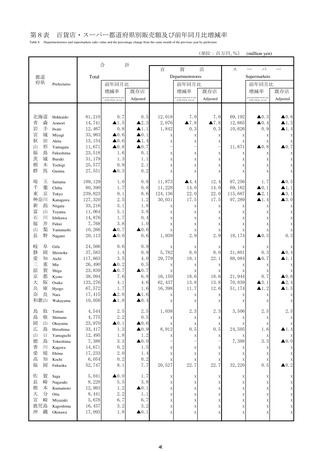
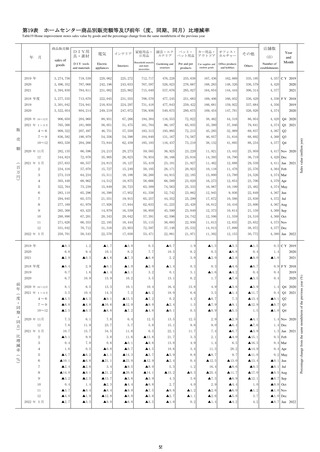
Sales value (million yen)
その他
2022
2021
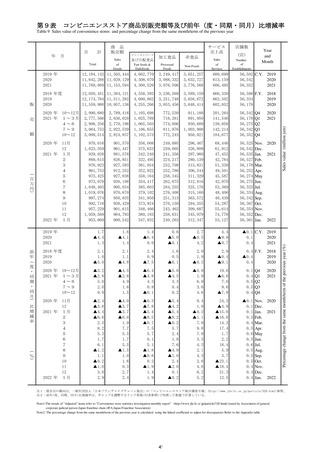
Percentage change from the same month/term of the previous year (%)
家庭用品
2022
2021
2022
Percentage change from the same month/term of the previous year
after number of establishments have been adjusted(%).
他
家庭用
電気機
械器具
Electric
Appliances
Household
Equipment
食
堂
・
の商品
Others
喫
商
品
券
営業日数
(日)
従業者数
(人)
売場面積
(1000㎡)
従 業 者
一人当た
り販売額
(万円)
売場面積
1㎡ 当た
り販売額
(万円)
Business
Days
Number
of
Employees
Sales Floor
Area
(1000㎡)
Sales per
Employee
(10000yen)
Sales per ㎡
茶
Restaurants
and
Café
Gift Certificate
Year
and
Month
(10000 yen)
20,707
19,643
20,064
167,044
130,656
132,463
1,446,576
1,045,290
1,118,713
152,049
88,293
87,532
131,083
103,373
100,997
362.0
355.6
361.8
68,774
64,156
61,699
5,605
5,382
5,261
8,907.0
7,132.3
7,872.1
107.7 C Y
84.1
90.9
2019
2020
2021
18,064
20,304
20,811
176,104
159,451
129,685
1,426,101
1,392,949
1,023,110
155,958
143,695
80,451
143,542
126,835
101,245
362.0
362.6
354.8
71,217
66,550
62,672
5,743
5,547
5,299
8,705.3
8,679.1
7,045.1
107.0 F Y
104.4
82.7
2018
2019
2020
6,444
5,427
4,522
4,258
5,857
39,779
33,844
28,715
29,737
40,166
318,934
271,622
242,878
265,758
338,456
25,820
21,048
17,010
19,910
29,564
37,021
18,108
23,348
23,714
35,828
91.8
88.6
90.1
91.3
91.8
64,156
62,672
62,041
62,234
61,699
5,382
5,299
5,291
5,282
5,261
2,307.4
1,856.7
1,672.8
1,797.9
2,548.6
27.1
21.6
19.4
20.6
29.4
Q4
Q1
Q2
Q3
Q4
2020
2021
2,812
1,999
2,022
1,799
1,605
1,398
1,558
1,566
1,352
1,422
1,485
1,456
2,608
1,792
1,747
11,995
16,113
10,761
10,103
12,980
10,165
7,793
10,757
11,576
8,453
9,708
11,268
12,736
16,162
11,111
101,953
123,622
82,145
84,748
104,729
86,647
65,829
90,402
97,813
78,763
89,182
96,395
106,814
135,246
92,455
8,529
8,773
6,078
6,524
8,446
6,288
4,462
6,260
8,020
5,921
5,970
8,535
9,673
11,356
7,997
13,101
17,838
4,867
4,982
8,258
6,264
4,912
12,172
12,926
5,700
5,087
5,837
12,890
17,100
4,855
29.9
31.0
30.1
27.6
30.9
29.8
30.5
29.8
30.9
30.5
29.9
30.9
29.9
31.0
30.1
64,303
64,156
63,714
63,244
62,672
62,565
62,291
62,041
61,738
61,234
62,234
62,154
61,809
61,699
61,336
5,375
5,382
5,377
5,367
5,299
5,293
5,290
5,291
5,288
5,287
5,282
5,264
5,266
5,261
5,258
719.8
940.4
570.6
566.3
721.1
565.1
444.4
663.7
722.0
506.6
568.7
686.3
805.0
1,058.7
678.7
8.5
11.0
6.6
6.6
8.4
6.6
5.1
7.7
8.3
5.8
6.6
7.9
9.3
12.2
7.8
Nov
Dec
Jan
Feb
Mar
Apr
May
Jun
Jul
Aug
Sep
Oct
Nov
Dec
Jan
2020
12.0
▲5.1
2.1
▲7.3
▲21.8
1.4
1.5
▲27.7
7.0
▲3.3
▲41.9
▲0.9
▲10.3
▲21.1
▲2.3
▲0.0
▲1.8
1.7
▲5.7
▲6.7
▲3.8
▲3.9
▲4.0
▲2.3
2.8
▲19.9
10.4
0.9 C Y
▲21.9
8.1
2019
2020
2021
▲20.0
12.4
2.5
▲7.4
▲9.5
▲18.7
2.1
▲2.3
▲26.6
▲4.4
▲7.9
▲44.0
▲6.0
▲11.6
▲20.2
▲0.1
0.2
▲2.2
▲4.5
▲6.6
▲5.8
▲3.7
▲3.4
▲4.5
2.4
▲0.3
▲18.8
2.1 F Y
▲2.4
▲20.8
2018
2019
2020
11.7
27.4
10.3
▲12.1
▲9.1
▲4.5
▲2.8
33.6
▲14.0
1.0
▲10.0
▲7.5
51.7
▲2.4
6.1
▲29.5
▲27.1
71.8
▲15.9
14.5
▲14.2
▲10.5
16.5
▲9.1
▲3.2
0.4
▲0.9
8.2
0.2
▲0.0
▲6.7
▲5.8
▲6.2
▲3.6
▲3.8
▲4.0
▲4.5
▲3.7
▲1.7
▲2.3
▲5.1
▲4.1
49.5
0.9
10.5
▲7.5
▲5.7
45.9
▲1.4
8.5
Q4
Q1
Q2
Q3
Q4
2020
2021
▲11.2
36.9
49.4
13.9
21.0
17.3
12.4
3.0
▲15.8
▲7.9
▲12.3
▲10.8
▲7.3
▲10.4
▲13.6
▲10.1
▲8.5
▲22.4
▲2.1
22.1
130.9
44.5
▲8.0
▲4.7
▲23.0
▲15.2
▲3.4
6.2
0.3
3.3
▲12.7
▲15.3
▲25.2
▲8.9
15.2
171.2
74.9
▲0.2
6.7
▲10.6
▲3.7
3.3
4.8
9.4
12.6
▲28.5
▲37.1
▲51.2
▲31.5
22.2
389.0
147.0
▲8.1
5.1
▲26.9
▲25.0
0.2
13.4
29.4
31.6
▲14.2
▲14.2
▲25.1
▲12.7
2.8
141.5
20.6
▲9.0
▲6.9
▲14.6
▲7.9
▲4.0
▲1.6
▲4.1
▲0.2
▲0.0
▲0.0
▲0.3
▲3.8
1.3
13.3
12.1
▲0.0
0.3
▲0.3
0.7
▲0.0
▲0.0
▲0.0
▲0.0
▲6.9
▲6.7
▲6.9
▲6.2
▲5.8
▲5.4
▲5.8
▲6.2
▲6.4
▲6.8
▲3.6
▲3.3
▲3.9
▲3.8
▲3.7
▲4.0
▲4.0
▲4.0
▲3.5
▲4.5
▲3.7
▲3.8
▲3.7
▲3.8
▲3.8
▲1.7
▲2.1
▲2.0
▲2.3
▲2.2
▲8.8
▲8.3
▲25.1
▲6.0
26.7
167.4
68.5
3.1
9.7
▲7.6
▲1.0
6.0
11.8
12.6
18.9
▲10.5
▲10.6
▲27.5
▲7.0
25.4
164.0
64.5
1.3
6.4
▲9.4
▲1.5
3.9
9.4
10.9
18.2
Nov
Dec
Jan
Feb
Mar
Apr
May
Jun
Jul
Aug
Sep
Oct
Nov
Dec
Jan
2020
12.6
▲4.9
2.2
▲5.4
▲19.9
3.2
2.4
▲26.9
8.1
▲2.2
▲40.7
0.5
▲9.7
▲19.9
▲1.3
▲0.0
▲1.9
1.7
▲3.4
▲4.7
▲3.2
▲0.5
▲0.5
▲1.1
2.4
▲20.6
10.5
▲0.6 C Y
▲23.5
7.1
2019
2020
2021
▲19.2
12.8
2.7
▲6.4
▲7.5
▲16.7
3.5
▲1.6
▲25.6
▲2.8
▲6.8
▲42.8
▲4.7
▲11.1
▲18.8
▲0.1
0.1
▲2.3
▲3.2
▲4.3
▲4.1
▲0.8
▲0.5
▲1.1
1.9
▲0.9
▲19.3
0.4 F Y
▲4.0
▲22.2
2018
2019
2020
11.9
27.5
10.5
▲12.0
▲9.1
▲2.6
0.0
35.9
▲12.0
1.6
▲8.8
▲6.2
53.6
▲1.3
6.5
▲28.5
▲25.9
74.8
▲14.7
15.3
▲12.6
▲9.0
18.1
▲8.1
▲2.7
0.4
▲1.0
8.3
0.0
0.0
▲4.7
▲4.1
▲4.6
▲3.0
▲3.2
▲0.5
▲1.1
▲1.0
▲0.9
▲1.1
▲5.5
▲4.0
49.9
1.3
10.3
▲9.1
▲6.9
44.8
▲1.9
7.7
Q4
Q1
Q2
Q3
Q4
2020
2021
▲11.0
37.1
49.7
14.0
21.0
17.6
12.6
3.1
▲15.7
▲7.9
▲12.3
▲10.7
▲7.2
▲10.3
▲13.6
▲8.3
▲6.6
▲20.0
0.5
25.8
133.7
46.6
▲6.1
▲2.1
▲20.0
▲14.9
▲2.9
6.7
1.0
4.3
▲11.5
▲14.2
▲24.1
▲7.7
17.0
174.4
77.2
1.2
8.1
▲8.9
▲3.5
3.6
5.1
9.8
13.1
▲27.5
▲36.2
▲50.4
▲30.5
24.6
398.2
151.7
▲6.5
6.8
▲25.2
▲24.6
0.9
14.2
30.4
32.8
▲12.7
▲12.4
▲23.8
▲11.3
4.5
145.2
22.5
▲7.8
▲5.7
▲13.6
▲7.5
▲3.6
▲1.1
▲3.6
0.2
▲0.1
0.0
▲0.2
▲3.9
0.9
13.5
12.6
▲0.1
0.1
▲0.6
0.5
0.0
0.1
0.0
▲0.0
▲4.9
▲4.7
▲4.8
▲4.6
▲4.1
▲3.8
▲4.2
▲4.6
▲4.8
▲5.2
▲3.0
▲2.8
▲3.3
▲3.2
▲3.0
▲0.5
▲0.5
▲0.5
▲0.6
▲1.1
▲0.9
▲1.0
▲1.0
▲0.9
▲0.9
▲0.9
▲0.9
▲0.8
▲1.1
▲1.0
▲9.1
▲8.7
▲25.2
▲5.9
27.0
168.6
69.1
3.2
9.9
▲6.4
▲1.2
5.9
11.7
12.4
19.0
▲12.4
▲12.7
▲28.3
▲8.3
23.5
164.0
59.4
▲0.0
6.4
▲9.4
▲2.9
3.9
9.4
9.9
16.4
Nov
Dec
Jan
Feb
Mar
Apr
May
Jun
Jul
Aug
Sep
Oct
Nov
Dec
Jan
2020
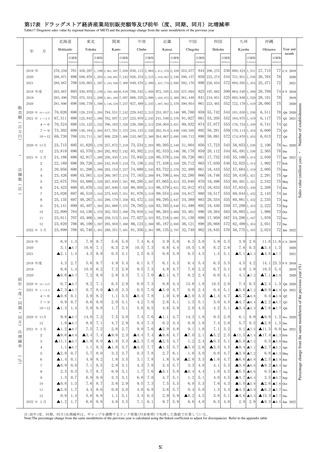
Note1 Yearly and quarterly data of number of establishments, number of employees and sales floor area are calculated at the end of term.
Note2 Yearly and quarterly data of sales per employee and sales per floor area (㎡) are average of that term.
Note3:Growth rates of number of establishments that showed at "Percentage change from the same month/term of the previous year after number of establisments have been adjusted " column are calculated by figures that showed "sales value" column.
Note4 Sales per ㎡ are calculated excluding sales value of restaurant and café.
25
2021
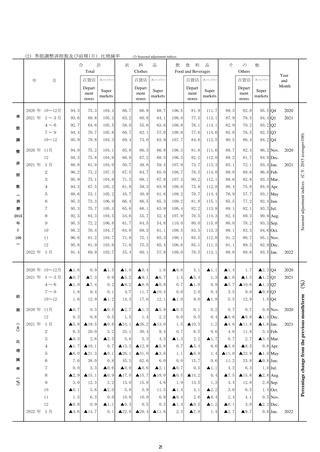
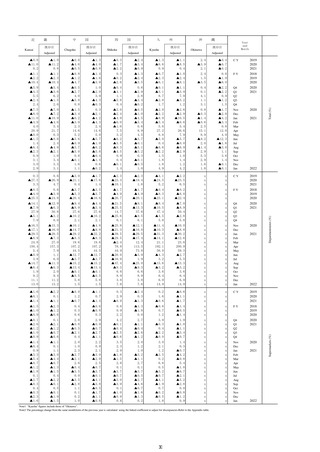
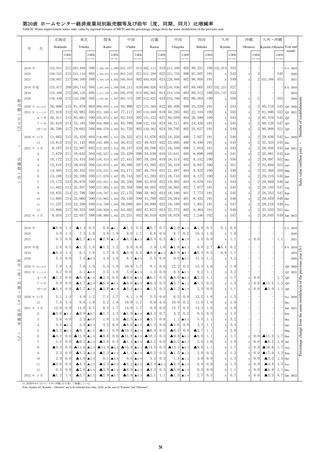
Sales value (million yen)
その他
2022
2021
Percentage change from the same month/term of the previous year (%)
家庭用品
2022
2021
2022
Percentage change from the same month/term of the previous year
after number of establishments have been adjusted(%).
他
家庭用
電気機
械器具