
よむ、つかう、まなぶ。
商業動態統計速報 2022年4月分 (52 ページ)
出典
| 公開元URL | https://www.meti.go.jp/statistics/tyo/syoudou/result/sokuho_2.html |
| 出典情報 | 商業動態統計速報 2022年4月分(5/31)《経済産業省》 |
ページ画像
ダウンロードした画像を利用する際は「出典情報」を明記してください。
低解像度画像をダウンロード
プレーンテキスト
資料テキストはコンピュータによる自動処理で生成されており、完全に資料と一致しない場合があります。
テキストをコピーしてご利用いただく際は資料と付け合わせてご確認ください。
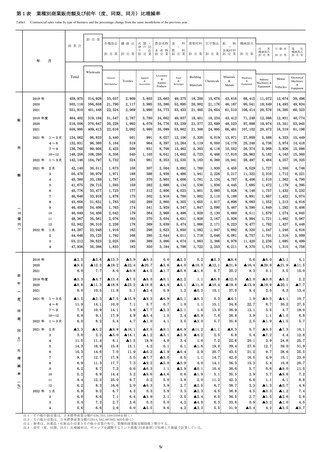
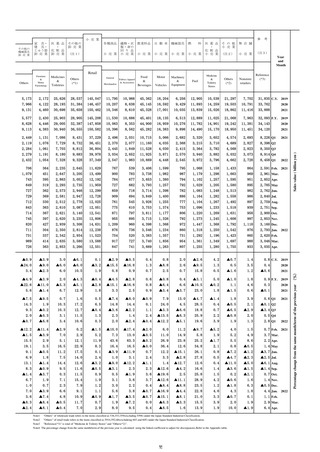
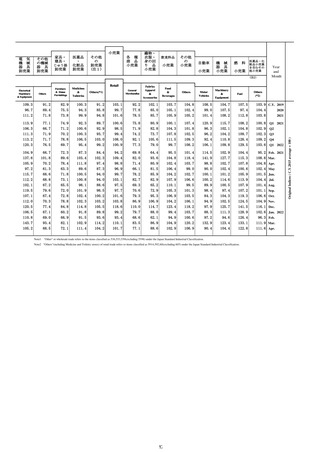
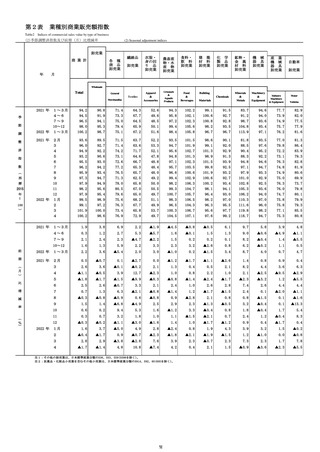
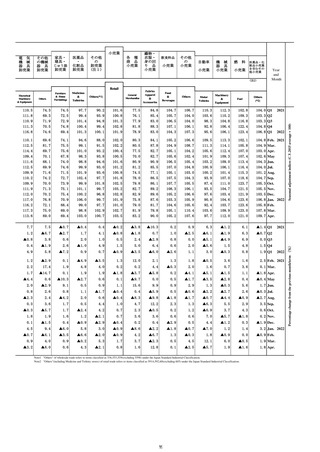
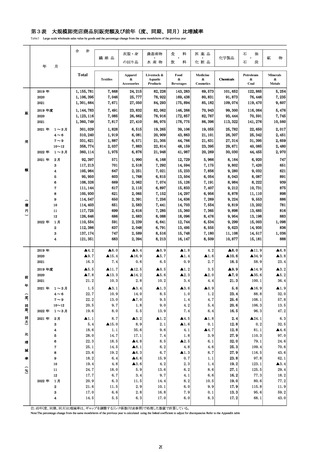
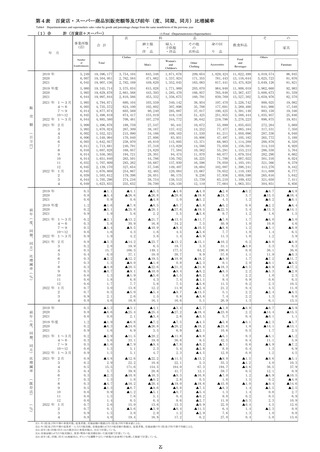
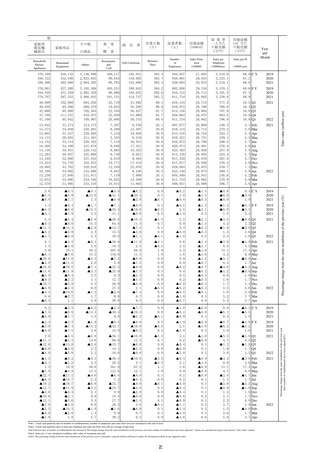
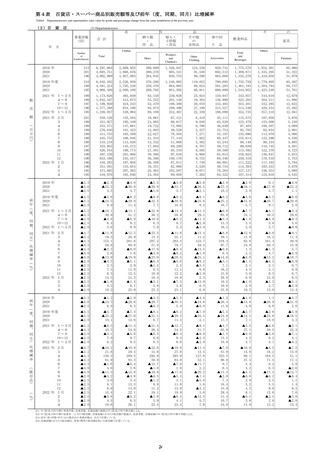
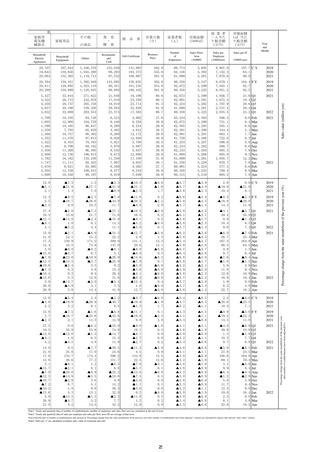
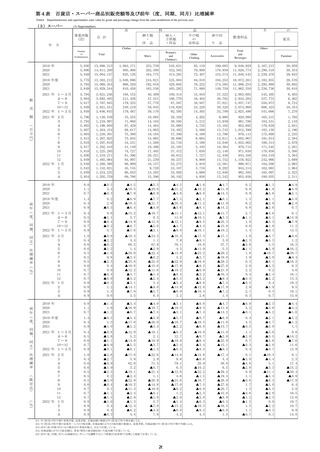
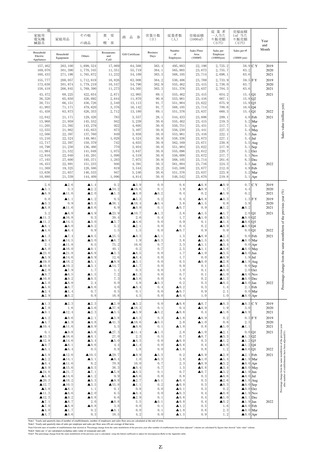
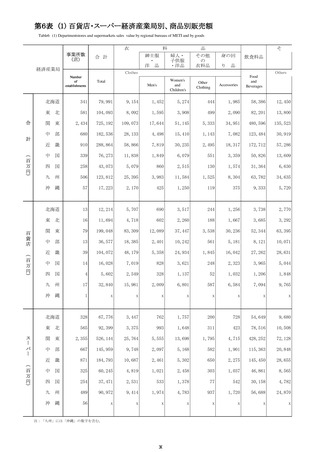
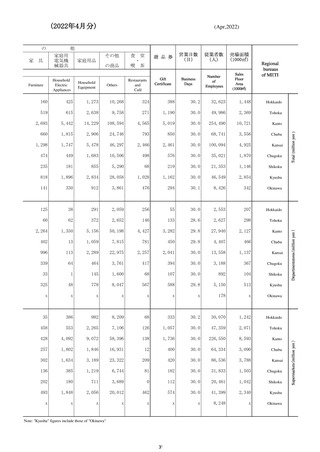
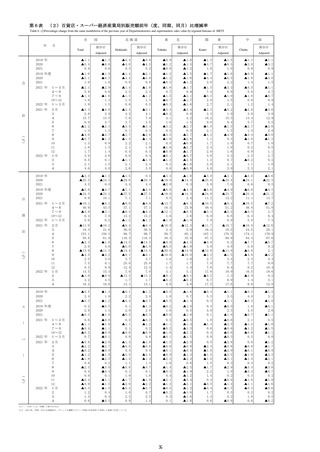
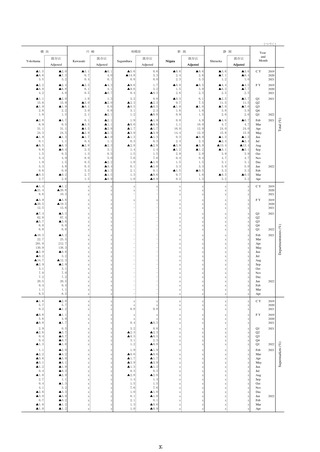
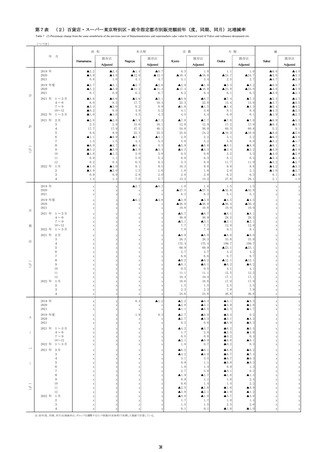
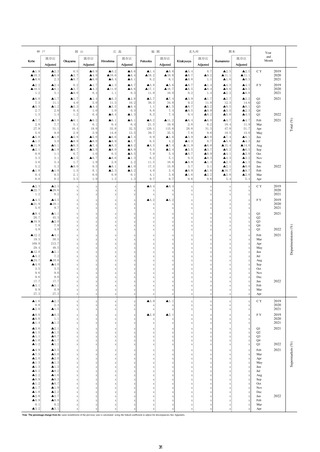
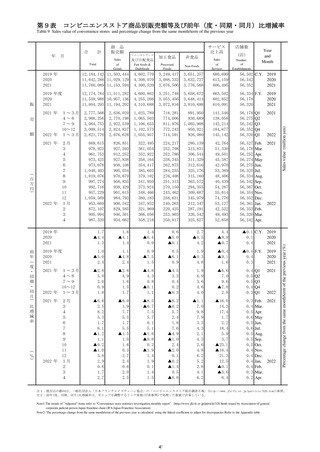
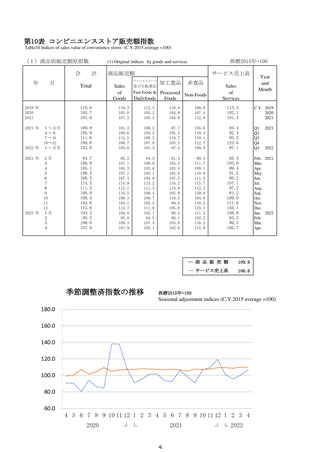
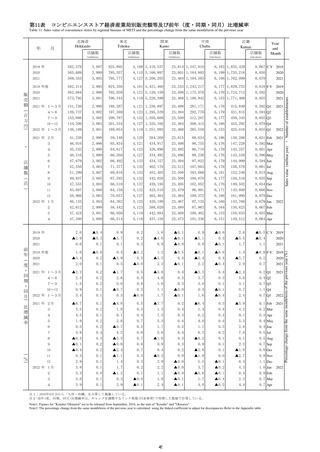
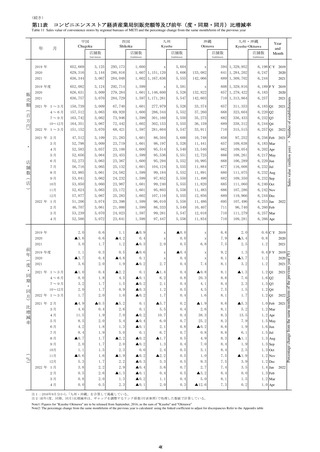
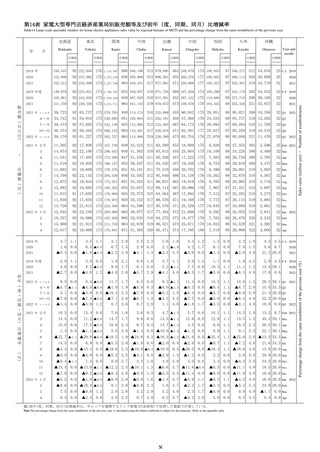
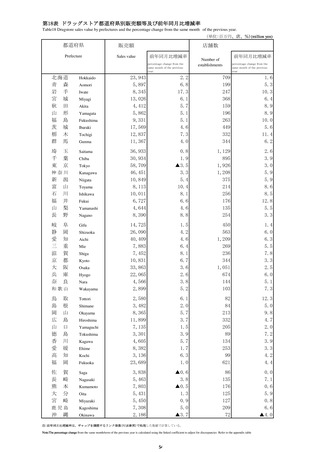
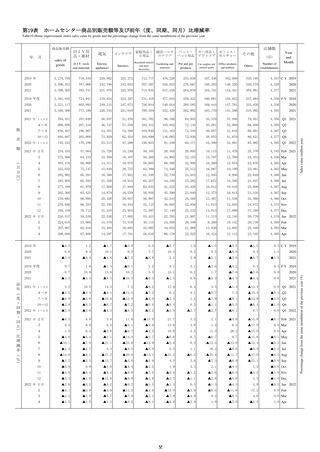
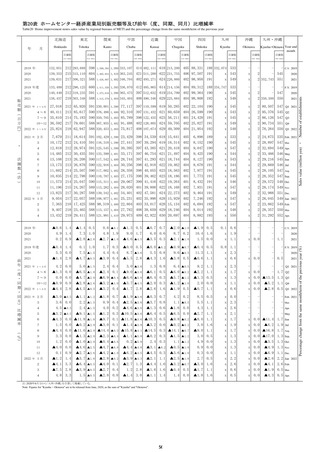
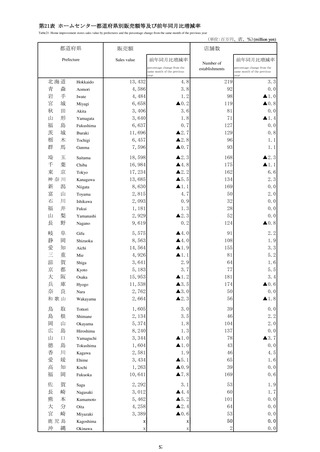
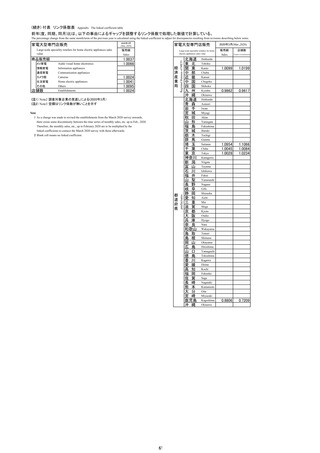
第16表
ドラッグストア商品別販売額等及び前年(度、同期、同月)比増減率
Table16 Drugstore sales value by goods and the percentage change from the same month/term of the previous year
月
Sales of goods
ヘルスケア用
品(衛生用
品)・介護・
ベビー
健康食品
ビューティ
ケア(化粧
品・小物)
トイレタ
リー
家庭用品・日
用消耗品・
ペット用品
食品
その他
Dispensing
pharmaceutical
products
Over the counter
medical products
Health care (sanitary
goods), nursing care,
and baby products
Health foods
Beauty care
(cosmetic products
and goods)
Toiletry goods
Household utensils,
daily necessities, pet
products
Food
Others
(店)
Number of
establishments
Year
and
Month
2019 年
6,835,625
552,460
900,222
432,996
221,759
1,008,208
628,686
1,027,487
1,942,024
121,783
16,422 C Y 2019
2020
7,284,078
595,498
890,608
548,711
226,388
903,560
654,550
1,147,189
2,183,409
134,165
17,000
2020
2021
7,306,578
629,166
868,192
506,220
231,004
905,749
654,044
1,139,957
2,233,844
138,402
17,622
2021
2019 年度
7,009,551
569,237
908,890
463,886
224,578
1,003,216
639,068
1,068,933
2,008,449
123,294
16,450 F Y 2019
2020
7,234,182
599,159
872,678
530,124
225,105
887,914
653,447
1,136,842
2,193,027
135,886
16,967
2020
2021
7,392,237
644,530
871,298
513,186
232,259
913,824
654,585
1,151,617
2,268,544
142,394
17,816
2021
1~3月
1,734,523
151,983
214,880
125,073
54,214
212,839
154,624
262,034
527,449
31,427
16,967 Q1 2021
4~6
1,834,917
153,128
216,068
124,127
58,288
232,288
164,513
288,572
564,158
33,775
17,234 Q2
7~9
1,880,083
158,079
225,119
130,146
61,646
227,849
166,515
296,474
578,340
35,915
17,375 Q3
10~12
1,857,055
165,976
212,125
126,874
56,856
232,773
168,392
292,877
563,897
37,285
17,622 Q4
1~3月
1,820,182
167,347
217,986
132,039
55,469
220,914
155,165
273,694
562,149
35,419
17,816 Q1 2022
16,891 Feb 2021
2021 年
販
売
2022 年
額
2021 年 2月
555,309
49,168
69,676
40,252
17,278
65,780
48,771
82,750
172,028
9,606
3
595,098
55,099
75,515
39,654
18,756
75,132
52,984
88,099
178,946
10,913
16,967 Mar
4
600,191
53,009
70,689
40,544
18,776
77,005
53,250
92,070
183,935
10,913
17,085 Apr
5
617,765
48,498
72,656
42,318
19,711
77,819
55,334
97,997
191,709
11,723
17,172 May
6
616,961
51,621
72,723
41,265
19,801
77,464
55,929
98,505
188,514
11,139
17,234 Jun
7
633,371
53,314
75,736
42,327
20,730
80,086
56,989
100,652
191,639
11,898
17,296 Jul
8
643,558
52,151
78,464
45,507
21,435
76,740
56,686
101,367
199,085
12,123
17,331 Aug
9
603,154
52,614
70,919
42,312
19,481
71,023
52,840
94,455
187,616
11,894
17,375 Sep
10
608,052
53,528
70,325
41,664
19,275
73,813
54,499
95,378
187,935
11,635
17,472 Oct
11
590,880
53,465
67,364
40,543
18,322
73,545
54,092
92,072
179,423
12,054
17,555 Nov
12
658,123
58,983
74,436
44,667
19,259
85,415
59,801
105,427
196,539
13,596
17,622 Dec
617,500
53,889
73,916
46,391
18,722
75,813
54,443
95,657
185,929
12,740
17,667 Jan 2022
2
580,203
52,774
67,519
43,126
17,892
67,149
49,592
86,463
184,385
11,303
17,706 Feb
3
622,479
60,684
76,551
42,522
18,855
77,952
51,130
91,574
191,835
11,376
17,816 Mar
4
619,186
56,669
72,591
41,667
18,967
81,128
49,963
93,374
193,088
11,739
17,919 Apr
2019 年
5.6
11.1
3.4
3.2
3.0
4.1
3.7
6.2
7.5
6.9
2020
6.6
7.8
▲1.1
26.7
2.1
▲10.4
4.1
11.6
12.4
10.2
3.5
2020
2021
0.3
5.7
▲2.5
▲7.7
2.0
0.2
▲0.1
▲0.6
2.3
3.2
3.7
2021
2019 年度
7.1
12.9
3.5
9.6
2.9
2.6
4.6
9.2
9.5
6.3
3.7 F Y 2019
2020
3.2
5.3
▲4.0
14.3
0.2
▲11.5
2.2
6.4
9.2
10.2
3.1
2020
2021
2.2
7.6
▲0.2
▲3.2
3.2
2.9
0.2
1.3
3.4
4.8
5.0
2021
1~3月
▲2.8
2.5
▲7.7
▲12.9
▲2.3
▲6.8
▲0.7
▲3.8
1.9
5.8
3.1 Q1 2021
4~6
▲0.2
5.7
0.1
▲5.4
8.2
6.8
0.1
▲1.6
▲3.1
▲2.1
3.7 Q2
7~9
1.9
7.7
0.9
▲7.6
2.2
1.0
▲0.7
▲0.0
5.3
0.2
3.5 Q3
10~12
2.2
6.7
▲3.1
▲4.6
0.3
0.4
0.9
2.8
5.5
9.3
3.7 Q4
1~3月
4.9
10.1
1.4
5.6
2.3
3.8
0.3
4.4
6.6
12.7
5.0 Q1 2022
2.6 Feb 2021
(
百
万
円
)
2022 年 1月
前
年
(
度
・
同
期
・
同
月
)
比
増
減
率
(
%
)
OTC
医薬品
2021 年
2022 年
2021 年 2月
5.0 C Y 2019
▲8.4
▲1.7
▲13.2
▲24.5
▲8.8
▲11.0
▲7.3
▲12.8
▲0.3
▲2.1
3
▲2.4
5.9
▲1.5
▲6.7
7.7
▲1.7
▲0.1
▲7.5
▲3.9
7.0
3.1 Mar
4
▲3.0
1.7
▲2.4
▲1.0
9.5
7.7
▲1.0
▲5.7
▲9.0
0.7
3.6 Apr
5
1.8
8.5
2.4
▲5.5
12.8
11.4
2.1
1.4
▲2.5
▲0.6
3.8 May
6
0.8
7.5
0.2
▲9.4
2.9
1.6
▲0.7
▲0.5
2.7
▲6.0
3.7 Jun
7
2.1
6.3
0.7
▲12.2
3.5
4.5
0.2
▲0.6
6.3
2.0
3.6 Jul
8
0.4
7.8
▲0.6
▲7.6
2.8
▲2.2
▲2.6
▲1.7
4.0
0.8
3.6 Aug
9
3.2
9.0
3.0
▲2.3
0.1
0.8
0.5
2.4
5.9
▲2.1
3.5 Sep
10
4.6
4.0
▲0.8
▲1.1
3.0
1.2
3.6
6.1
9.2
9.7
3.6 Oct
11
1.1
9.8
▲4.5
▲6.9
▲1.9
▲1.4
▲0.9
1.5
4.0
10.3
3.6 Nov
12
1.2
6.5
▲3.9
▲5.6
▲0.3
1.2
0.3
1.0
3.5
8.0
3.7 Dec
5.7
12.9
6.1
2.7
3.0
5.4
3.0
4.9
5.4
16.8
4.8 Jan 2022
2
4.5
7.3
▲3.1
7.1
3.6
2.1
1.7
4.5
7.2
17.7
4.8 Feb
3
4.6
10.1
1.4
7.2
0.5
3.8
▲3.5
3.9
7.2
4.2
5.0 Mar
4
3.2
6.9
2.7
2.8
1.0
5.4
▲6.2
1.4
5.0
7.6
4.9 Apr
2022 年 1月
注:前年(度、同期、同月)比増減率は、ギャップを調整するリンク係数(付表参照)で処理した数値で計算している。
Note:The percentage change from the same month/term of the previous year is calculated using the linked coefficient to adjust for discrepancies Refer to the appendix table
52
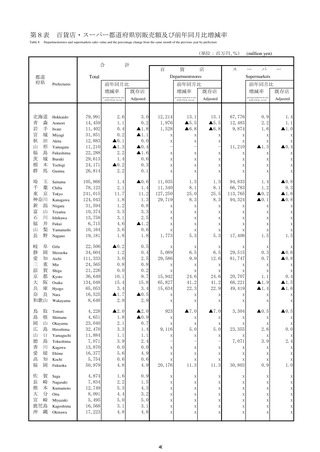
Sales value (million yen)
年
店舗数
調剤医薬
品
Percentage change from the same month/term of the previous year (%)
商品販売額
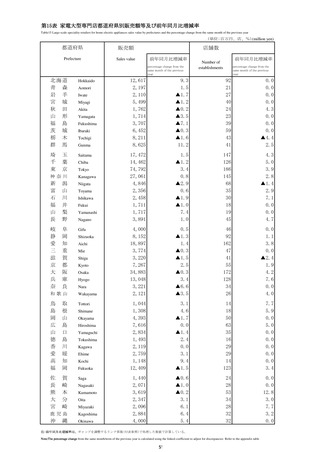
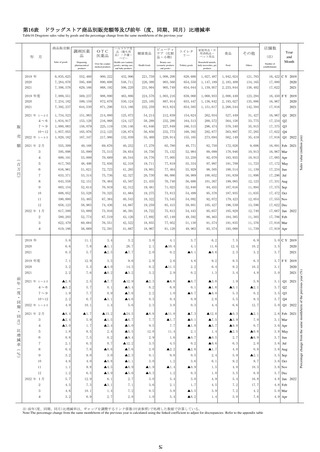
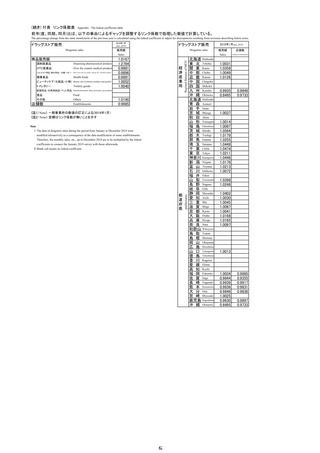
ドラッグストア商品別販売額等及び前年(度、同期、同月)比増減率
Table16 Drugstore sales value by goods and the percentage change from the same month/term of the previous year
月
Sales of goods
ヘルスケア用
品(衛生用
品)・介護・
ベビー
健康食品
ビューティ
ケア(化粧
品・小物)
トイレタ
リー
家庭用品・日
用消耗品・
ペット用品
食品
その他
Dispensing
pharmaceutical
products
Over the counter
medical products
Health care (sanitary
goods), nursing care,
and baby products
Health foods
Beauty care
(cosmetic products
and goods)
Toiletry goods
Household utensils,
daily necessities, pet
products
Food
Others
(店)
Number of
establishments
Year
and
Month
2019 年
6,835,625
552,460
900,222
432,996
221,759
1,008,208
628,686
1,027,487
1,942,024
121,783
16,422 C Y 2019
2020
7,284,078
595,498
890,608
548,711
226,388
903,560
654,550
1,147,189
2,183,409
134,165
17,000
2020
2021
7,306,578
629,166
868,192
506,220
231,004
905,749
654,044
1,139,957
2,233,844
138,402
17,622
2021
2019 年度
7,009,551
569,237
908,890
463,886
224,578
1,003,216
639,068
1,068,933
2,008,449
123,294
16,450 F Y 2019
2020
7,234,182
599,159
872,678
530,124
225,105
887,914
653,447
1,136,842
2,193,027
135,886
16,967
2020
2021
7,392,237
644,530
871,298
513,186
232,259
913,824
654,585
1,151,617
2,268,544
142,394
17,816
2021
1~3月
1,734,523
151,983
214,880
125,073
54,214
212,839
154,624
262,034
527,449
31,427
16,967 Q1 2021
4~6
1,834,917
153,128
216,068
124,127
58,288
232,288
164,513
288,572
564,158
33,775
17,234 Q2
7~9
1,880,083
158,079
225,119
130,146
61,646
227,849
166,515
296,474
578,340
35,915
17,375 Q3
10~12
1,857,055
165,976
212,125
126,874
56,856
232,773
168,392
292,877
563,897
37,285
17,622 Q4
1~3月
1,820,182
167,347
217,986
132,039
55,469
220,914
155,165
273,694
562,149
35,419
17,816 Q1 2022
16,891 Feb 2021
2021 年
販
売
2022 年
額
2021 年 2月
555,309
49,168
69,676
40,252
17,278
65,780
48,771
82,750
172,028
9,606
3
595,098
55,099
75,515
39,654
18,756
75,132
52,984
88,099
178,946
10,913
16,967 Mar
4
600,191
53,009
70,689
40,544
18,776
77,005
53,250
92,070
183,935
10,913
17,085 Apr
5
617,765
48,498
72,656
42,318
19,711
77,819
55,334
97,997
191,709
11,723
17,172 May
6
616,961
51,621
72,723
41,265
19,801
77,464
55,929
98,505
188,514
11,139
17,234 Jun
7
633,371
53,314
75,736
42,327
20,730
80,086
56,989
100,652
191,639
11,898
17,296 Jul
8
643,558
52,151
78,464
45,507
21,435
76,740
56,686
101,367
199,085
12,123
17,331 Aug
9
603,154
52,614
70,919
42,312
19,481
71,023
52,840
94,455
187,616
11,894
17,375 Sep
10
608,052
53,528
70,325
41,664
19,275
73,813
54,499
95,378
187,935
11,635
17,472 Oct
11
590,880
53,465
67,364
40,543
18,322
73,545
54,092
92,072
179,423
12,054
17,555 Nov
12
658,123
58,983
74,436
44,667
19,259
85,415
59,801
105,427
196,539
13,596
17,622 Dec
617,500
53,889
73,916
46,391
18,722
75,813
54,443
95,657
185,929
12,740
17,667 Jan 2022
2
580,203
52,774
67,519
43,126
17,892
67,149
49,592
86,463
184,385
11,303
17,706 Feb
3
622,479
60,684
76,551
42,522
18,855
77,952
51,130
91,574
191,835
11,376
17,816 Mar
4
619,186
56,669
72,591
41,667
18,967
81,128
49,963
93,374
193,088
11,739
17,919 Apr
2019 年
5.6
11.1
3.4
3.2
3.0
4.1
3.7
6.2
7.5
6.9
2020
6.6
7.8
▲1.1
26.7
2.1
▲10.4
4.1
11.6
12.4
10.2
3.5
2020
2021
0.3
5.7
▲2.5
▲7.7
2.0
0.2
▲0.1
▲0.6
2.3
3.2
3.7
2021
2019 年度
7.1
12.9
3.5
9.6
2.9
2.6
4.6
9.2
9.5
6.3
3.7 F Y 2019
2020
3.2
5.3
▲4.0
14.3
0.2
▲11.5
2.2
6.4
9.2
10.2
3.1
2020
2021
2.2
7.6
▲0.2
▲3.2
3.2
2.9
0.2
1.3
3.4
4.8
5.0
2021
1~3月
▲2.8
2.5
▲7.7
▲12.9
▲2.3
▲6.8
▲0.7
▲3.8
1.9
5.8
3.1 Q1 2021
4~6
▲0.2
5.7
0.1
▲5.4
8.2
6.8
0.1
▲1.6
▲3.1
▲2.1
3.7 Q2
7~9
1.9
7.7
0.9
▲7.6
2.2
1.0
▲0.7
▲0.0
5.3
0.2
3.5 Q3
10~12
2.2
6.7
▲3.1
▲4.6
0.3
0.4
0.9
2.8
5.5
9.3
3.7 Q4
1~3月
4.9
10.1
1.4
5.6
2.3
3.8
0.3
4.4
6.6
12.7
5.0 Q1 2022
2.6 Feb 2021
(
百
万
円
)
2022 年 1月
前
年
(
度
・
同
期
・
同
月
)
比
増
減
率
(
%
)
OTC
医薬品
2021 年
2022 年
2021 年 2月
5.0 C Y 2019
▲8.4
▲1.7
▲13.2
▲24.5
▲8.8
▲11.0
▲7.3
▲12.8
▲0.3
▲2.1
3
▲2.4
5.9
▲1.5
▲6.7
7.7
▲1.7
▲0.1
▲7.5
▲3.9
7.0
3.1 Mar
4
▲3.0
1.7
▲2.4
▲1.0
9.5
7.7
▲1.0
▲5.7
▲9.0
0.7
3.6 Apr
5
1.8
8.5
2.4
▲5.5
12.8
11.4
2.1
1.4
▲2.5
▲0.6
3.8 May
6
0.8
7.5
0.2
▲9.4
2.9
1.6
▲0.7
▲0.5
2.7
▲6.0
3.7 Jun
7
2.1
6.3
0.7
▲12.2
3.5
4.5
0.2
▲0.6
6.3
2.0
3.6 Jul
8
0.4
7.8
▲0.6
▲7.6
2.8
▲2.2
▲2.6
▲1.7
4.0
0.8
3.6 Aug
9
3.2
9.0
3.0
▲2.3
0.1
0.8
0.5
2.4
5.9
▲2.1
3.5 Sep
10
4.6
4.0
▲0.8
▲1.1
3.0
1.2
3.6
6.1
9.2
9.7
3.6 Oct
11
1.1
9.8
▲4.5
▲6.9
▲1.9
▲1.4
▲0.9
1.5
4.0
10.3
3.6 Nov
12
1.2
6.5
▲3.9
▲5.6
▲0.3
1.2
0.3
1.0
3.5
8.0
3.7 Dec
5.7
12.9
6.1
2.7
3.0
5.4
3.0
4.9
5.4
16.8
4.8 Jan 2022
2
4.5
7.3
▲3.1
7.1
3.6
2.1
1.7
4.5
7.2
17.7
4.8 Feb
3
4.6
10.1
1.4
7.2
0.5
3.8
▲3.5
3.9
7.2
4.2
5.0 Mar
4
3.2
6.9
2.7
2.8
1.0
5.4
▲6.2
1.4
5.0
7.6
4.9 Apr
2022 年 1月
注:前年(度、同期、同月)比増減率は、ギャップを調整するリンク係数(付表参照)で処理した数値で計算している。
Note:The percentage change from the same month/term of the previous year is calculated using the linked coefficient to adjust for discrepancies Refer to the appendix table
52
Sales value (million yen)
年
店舗数
調剤医薬
品
Percentage change from the same month/term of the previous year (%)
商品販売額