
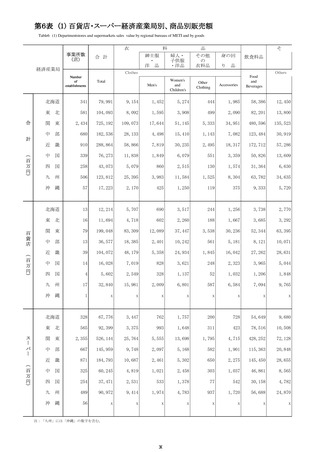

よむ、つかう、まなぶ。
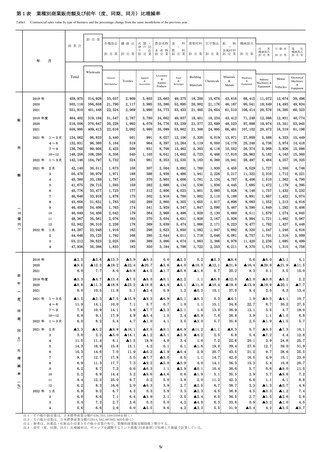
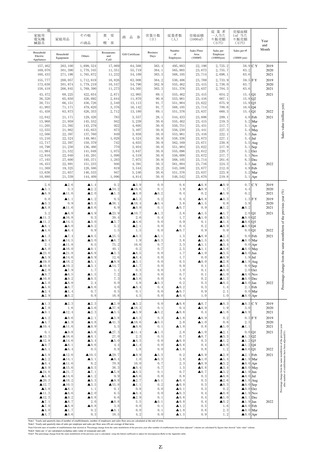
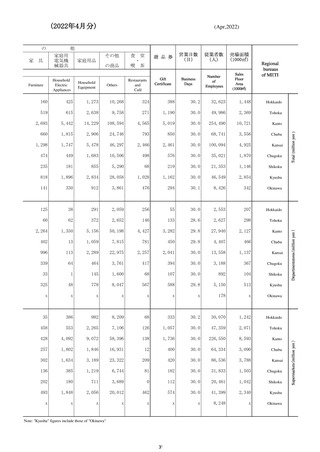
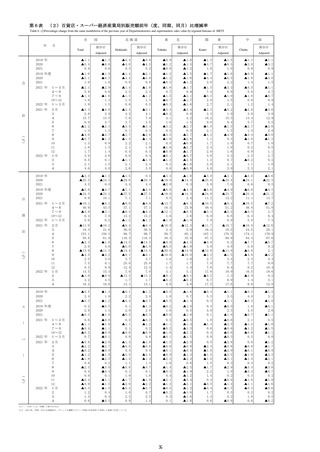
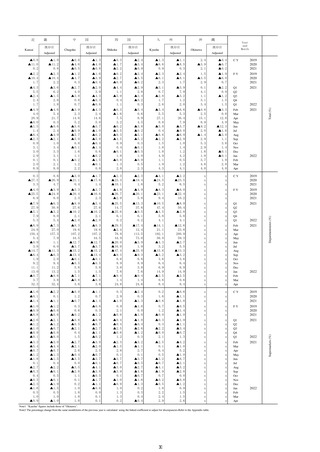
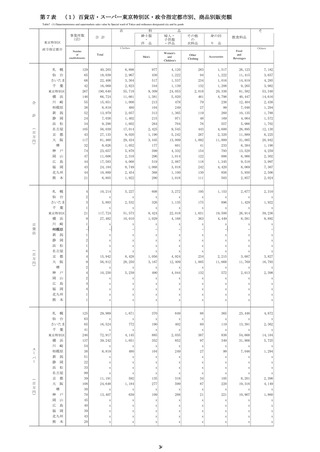
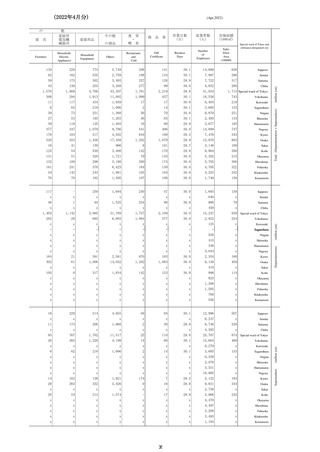
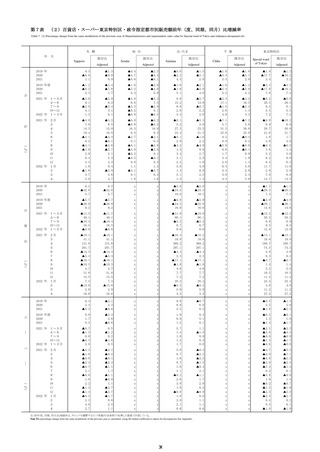
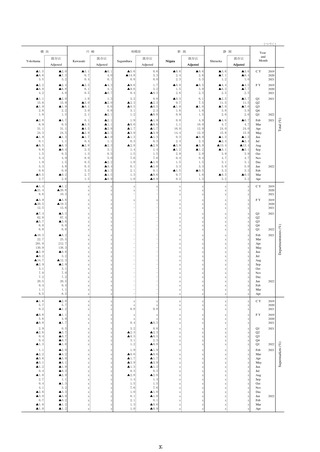
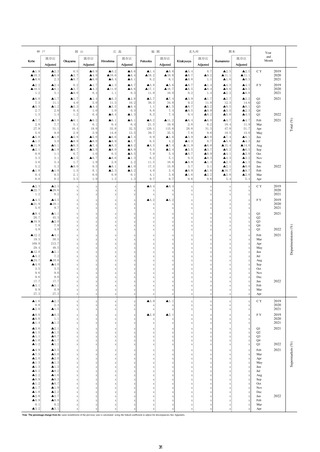
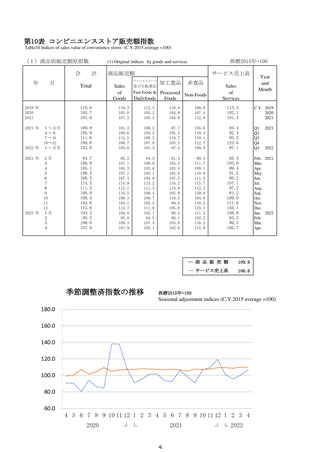
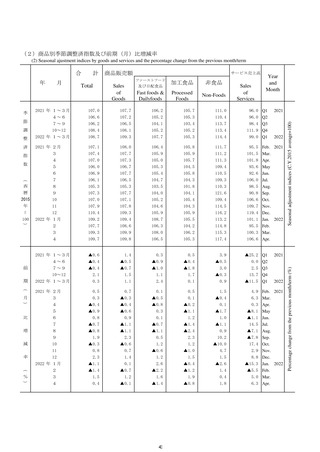
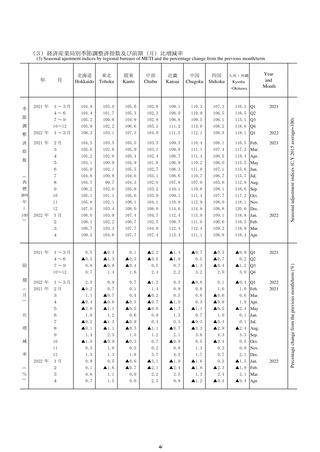
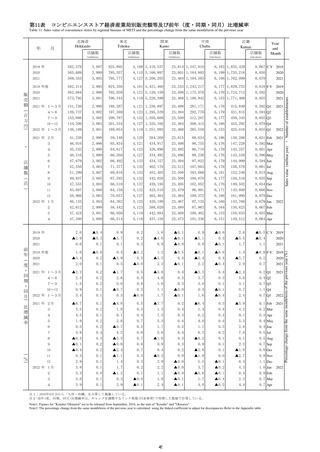
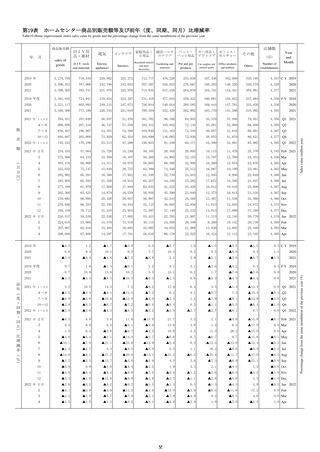
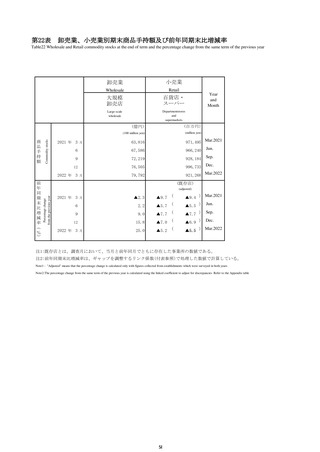
商業動態統計速報 2022年4月分 (23 ページ)
出典
| 公開元URL | https://www.meti.go.jp/statistics/tyo/syoudou/result/sokuho_2.html |
| 出典情報 | 商業動態統計速報 2022年4月分(5/31)《経済産業省》 |
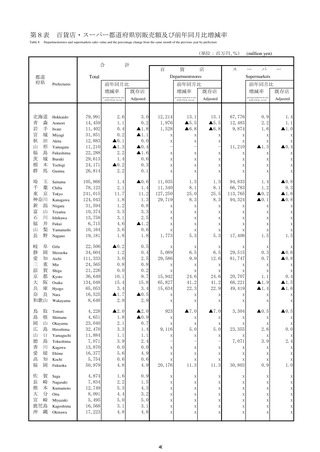
ページ画像
ダウンロードした画像を利用する際は「出典情報」を明記してください。
低解像度画像をダウンロード
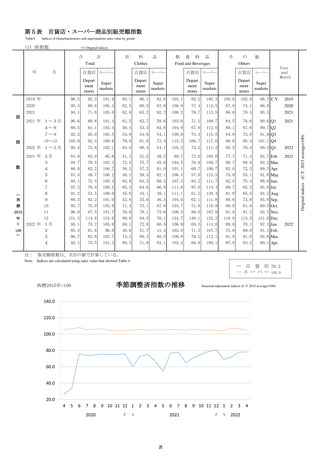
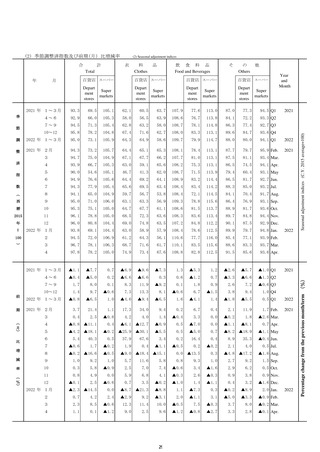
プレーンテキスト
資料テキストはコンピュータによる自動処理で生成されており、完全に資料と一致しない場合があります。
テキストをコピーしてご利用いただく際は資料と付け合わせてご確認ください。
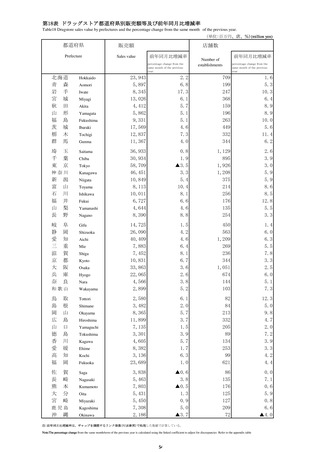
Household
Electric
Appliances
Household
Equipment
食
堂
・
の商品
Others
喫
商
品
券
営業日数
(日)
従業者数
(人)
売場面積
(1000㎡)
従 業 者
一人当た
り販売額
(万円)
売場面積
1㎡ 当た
り販売額
(万円)
Business
Days
Number
of
Employees
Sales Floor
Area
(1000㎡)
Sales per
Employee
(10000yen)
(10000 yen)
茶
Restaurants
and
Café
Gift Certificate
Year
and
Month
Sales per ㎡
178,169
188,722
180,496
430,143
432,046
403,660
3,146,099
2,823,635
2,884,385
169,117
99,644
98,763
195,651
159,092
155,096
363.4
363.7
363.3
564,657
630,061
629,804
27,803
29,055
28,975
3,518.0
3,233.1
3,219.1
68.8 C Y
67.2
68.6
2019
2020
2021
176,081
194,448
178,707
427,508
431,559
397,533
3,105,568
2,802,329
2,900,035
160,521
90,998
101,131
189,843
156,035
154,747
364.2
362.6
363.2
602,956
618,134
611,734
29,316
28,714
28,862
3,478.1
3,191.3
3,238.6
68.6 F Y
67.3
68.9
2019
2020
2021
48,899
40,848
42,990
47,760
47,109
102,069
94,366
95,888
111,337
95,942
694,256
669,570
702,484
818,075
709,907
23,719
19,655
22,450
32,939
26,086
31,092
35,208
36,827
51,969
30,743
89.1
90.8
91.7
91.7
89.0
618,134
616,072
614,138
629,804
611,734
28,714
28,706
28,904
28,975
28,862
777.4
768.8
787.8
884.5
796.9
16.5
16.4
16.8
18.9
16.8
Q1
Q2
Q3
Q4
Q1
2021
13,842
15,573
12,602
14,113
14,132
16,568
14,138
12,283
13,440
15,424
18,895
18,199
13,239
15,672
12,570
31,274
34,939
31,557
29,655
33,154
34,100
30,851
30,937
32,800
34,776
43,762
34,002
27,946
33,995
31,895
214,173
250,281
229,926
211,481
228,162
247,674
229,142
225,668
237,443
252,015
328,618
243,688
211,671
254,548
243,516
7,307
9,389
7,210
5,335
7,110
9,048
6,663
6,740
9,610
10,771
12,559
8,943
7,119
10,025
10,014
8,539
13,497
10,858
8,319
16,031
17,451
10,355
9,021
9,484
17,410
25,076
9,246
7,909
13,589
11,863
28.1
30.6
30.0
30.8
30.0
30.8
30.9
30.0
30.8
30.0
30.9
30.3
28.1
30.6
30.0
607,677
618,134
613,316
618,521
616,072
620,074
623,403
614,138
617,339
617,817
629,804
623,140
604,409
611,734
608,857
28,969
28,714
28,724
28,731
28,706
28,961
28,958
28,904
28,876
28,938
28,975
28,974
28,931
28,862
28,888
246.3
270.2
253.1
249.1
266.5
276.4
257.9
253.4
267.6
276.4
339.7
269.1
248.8
278.8
266.7
5.1
5.8
5.4
5.3
5.7
5.9
5.5
5.4
5.7
5.9
7.3
5.8
5.2
5.9
5.6
Feb
Mar
Apr
May
Jun
Jul
Aug
Sep
Oct
Nov
Dec
Jan
Feb
Mar
Apr
2021
3.6
▲3.5
▲6.0
▲4.5
▲5.9
▲7.7
▲0.1
▲13.6
1.3
▲3.0
▲41.1
▲0.9
▲8.2
▲20.4
▲2.8
0.0
0.1
▲0.1
▲0.2
1.0
▲0.0
▲1.5
▲1.5
▲0.3
▲0.8
▲6.0
▲0.0
0.4 C Y
▲3.6
1.9
2019
2020
2021
1.3
▲0.2
▲8.1
▲4.4
▲6.0
▲7.9
▲1.7
▲13.5
3.5
▲7.1
▲43.4
11.1
▲9.6
▲19.6
▲0.8
0.2
▲0.5
0.2
▲0.5
2.5
▲1.0
▲1.3
▲2.1
0.5
▲1.4
▲6.0
1.5
▲0.1 F Y
▲3.2
2.4
2019
2020
2021
5.3
▲9.3
▲11.3
▲8.2
▲3.7
▲5.4
▲6.0
▲14.4
▲4.9
▲6.0
▲5.9
14.3
▲2.8
2.3
2.3
▲26.8
64.8
▲14.7
13.5
10.0
▲10.3
11.4
▲7.5
▲2.9
▲1.1
▲1.3
0.7
0.1
0.0
▲0.1
2.5
0.9
0.4
▲0.0
▲1.0
▲2.1
▲1.5
▲0.2
▲0.3
0.5
▲3.5
4.2
▲1.8
1.4
2.5
▲0.6
7.2
▲0.6
1.6
1.8
Q1
Q2
Q3
Q4
Q1
2021
0.1
1.5
3.6
▲6.1
▲20.8
▲5.0
▲18.0
▲11.0
▲3.0
▲9.3
▲10.7
▲6.6
▲4.4
0.6
▲0.3
▲5.3
▲3.8
10.1
▲5.6
▲17.8
▲11.5
▲19.5
▲11.9
▲6.4
▲2.2
▲5.9
▲5.2
▲10.6
▲2.7
1.1
▲9.1
3.8
40.2
15.3
▲4.3
2.0
▲7.1
▲3.3
2.3
1.1
3.3
6.0
▲1.2
1.7
5.9
▲30.9
18.5
297.8
119.6
▲7.5
5.9
▲25.3
▲23.9
0.3
12.7
26.9
27.3
▲2.6
6.8
38.9
▲11.0
2.5
66.0
11.3
▲8.9
▲7.3
▲9.8
▲5.3
▲2.4
▲1.5
▲4.0
2.1
▲7.4
0.7
9.3
▲3.1
▲0.3
1.0
1.0
0.0
0.0
0.0
0.3
0.0
0.0
0.0
▲0.3
0.0
0.0
0.0
0.6
2.5
2.3
1.6
0.9
0.9
▲0.2
0.4
0.5
0.2
▲0.0
▲0.2
▲0.5
▲1.0
▲0.7
▲1.4
▲2.1
▲1.6
▲1.6
▲1.5
▲0.7
▲0.7
▲0.2
▲0.3
▲0.3
▲0.3
▲0.2
▲0.1
0.5
0.6
▲3.9
0.3
13.1
4.3
▲3.1
0.4
▲4.6
▲1.2
0.8
1.6
1.7
3.2
1.0
3.2
5.4
▲1.9
5.5
17.4
6.0
▲0.0
1.7
▲5.2
▲0.0
1.8
1.7
1.4
3.6
2.0
1.7
3.7
Feb
Mar
Apr
May
Jun
Jul
Aug
Sep
Oct
Nov
Dec
Jan
Feb
Mar
Apr
2021
0.2
▲7.5
▲8.0
▲3.5
▲6.8
▲7.7
▲0.2
▲14.4
1.5
▲2.3
▲40.4
0.0
▲7.7
▲19.4
▲2.2
0.0
0.0
▲0.1
▲1.0
▲0.2
▲0.9
▲0.6
▲0.8
0.1
0.0
▲6.1
0.4
▲0.3 C Y
▲5.5
1.0
2019
2020
2021
▲2.4
▲3.8
▲9.6
▲3.3
▲7.4
▲7.5
▲1.9
▲14.2
3.6
▲6.5
▲42.7
12.0
▲8.9
▲18.8
▲0.2
0.3
▲0.5
0.2
▲1.9
2.1
▲2.0
▲0.9
▲1.0
0.5
▲0.7
▲6.2
2.0
▲1.0 F Y
▲5.2
1.6
2019
2020
2021
2.8
▲11.1
▲12.8
▲9.6
▲4.9
▲6.5
▲5.3
▲13.8
▲4.8
▲5.8
▲5.8
14.6
▲2.6
2.3
2.2
▲26.1
66.6
▲13.7
14.1
10.6
▲10.0
12.3
▲6.8
▲2.3
▲0.8
▲1.3
0.7
0.0
0.0
0.0
2.1
0.2
▲0.4
▲0.9
▲2.0
▲1.0
▲0.8
0.1
0.1
0.5
▲3.5
4.7
▲1.2
1.9
3.0
▲1.8
6.5
▲1.8
1.1
1.2
Q1
Q2
Q3
Q4
Q1
2021
▲1.5
▲0.1
1.3
▲7.8
▲22.4
▲6.5
▲19.2
▲12.7
▲4.6
▲10.6
▲12.1
▲7.8
▲5.5
▲0.8
▲1.9
▲8.2
▲2.5
10.8
▲4.9
▲17.2
▲10.7
▲18.7
▲11.9
▲6.4
▲2.1
▲5.6
▲4.8
▲10.3
▲2.8
1.0
▲9.3
4.5
40.6
15.5
▲4.0
2.3
▲6.6
▲3.5
2.1
0.9
3.4
6.0
▲1.0
1.4
5.7
▲30.5
20.2
301.9
121.8
▲6.4
7.2
▲23.7
▲23.7
0.8
13.4
27.7
28.3
▲1.6
6.9
39.2
▲10.8
3.1
67.2
12.1
▲8.0
▲6.4
▲9.0
▲4.8
▲2.0
▲0.9
▲3.4
2.6
▲6.9
0.7
9.2
▲3.3
▲0.3
1.1
1.0
0.1
0.0
▲0.1
0.2
0.0
0.0
0.1
▲0.1
0.1
0.1
0.0
▲0.4
2.1
1.6
0.9
0.2
0.2
▲0.9
▲0.4
▲0.4
▲0.6
▲0.9
▲1.1
▲1.4
▲2.0
▲1.6
▲0.9
▲1.0
▲0.9
▲0.8
▲0.8
0.1
0.1
0.1
0.1
0.2
0.1
0.2
0.2
0.5
0.6
▲4.4
0.9
13.7
4.7
▲2.4
1.1
▲3.8
▲0.9
1.2
2.1
2.3
3.7
1.5
3.6
5.8
▲3.8
3.6
17.4
6.0
▲1.7
1.7
▲5.2
▲1.9
1.8
1.7
0.0
1.8
▲0.0
1.7
3.7
Feb
Mar
Apr
May
Jun
Jul
Aug
Sep
Oct
Nov
Dec
Jan
Feb
Mar
Apr
2021
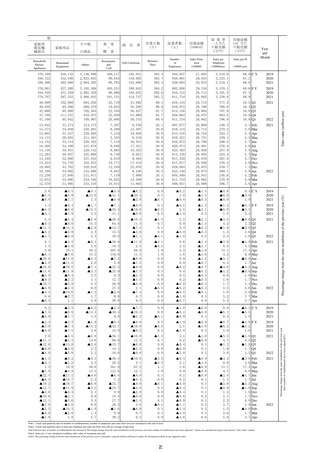
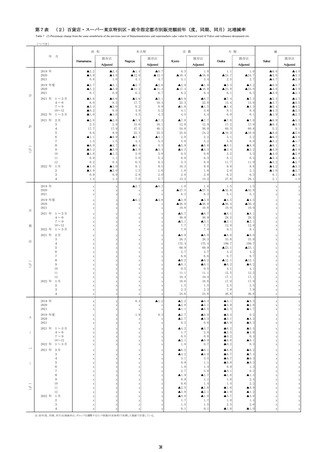
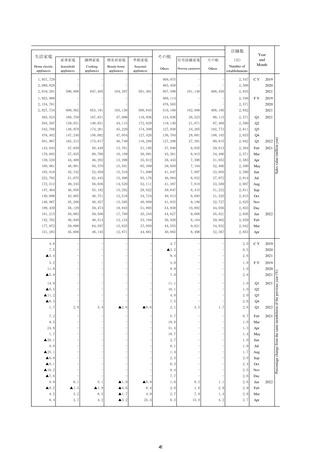
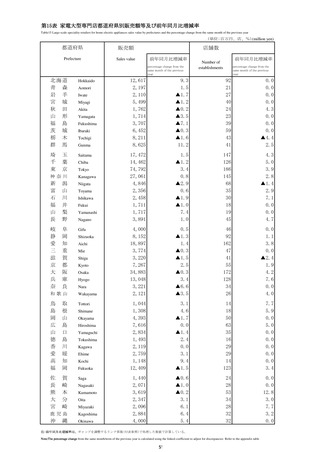
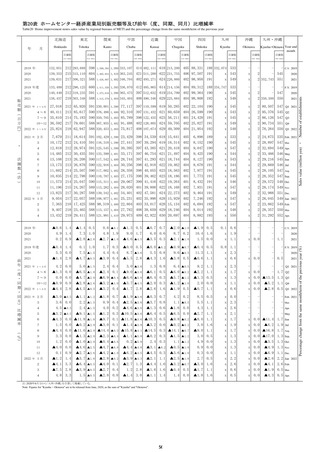
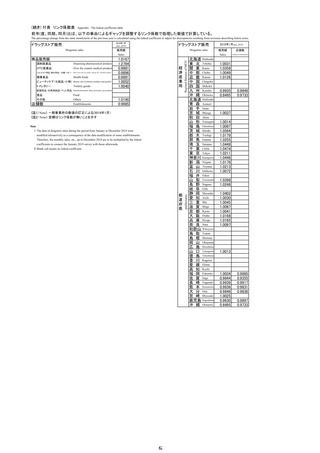
Note1 Yearly and quarterly data of number of establishments, number of employees and sales floor area are calculated at the end of term.
Note2 Yearly and quarterly data of sales per employee and sales per floor area (㎡) are average of that term.
Note3:Growth rates of number of establishments that showed at "Percentage change from the same month/term of the previous year after number of establisments have been adjusted " column are calculated by figures that showed "sales value" column.
Note4 Sales per ㎡ are calculated excluding sales value of restaurant and café.
Note5: The percentage change from the same month/term of the previous year is calculated using the linked coefficient to adjust for discrepancies.Refer to the Appendix table.
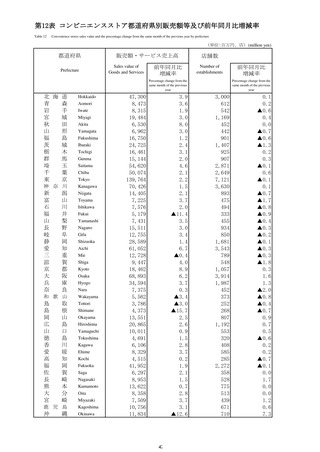
23
2022
Sales value (million yen)
その他
2022
2022
2022
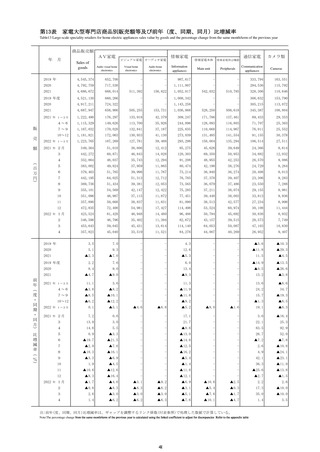
2022
2022
Percentage change from the same month/term of the previous year (%)
家庭用品
Percentage change from the same month/term of the previous year
after number of establishments have been adjusted(%).
他
家庭用
電気機
械器具
Electric
Appliances
Household
Equipment
食
堂
・
の商品
Others
喫
商
品
券
営業日数
(日)
従業者数
(人)
売場面積
(1000㎡)
従 業 者
一人当た
り販売額
(万円)
売場面積
1㎡ 当た
り販売額
(万円)
Business
Days
Number
of
Employees
Sales Floor
Area
(1000㎡)
Sales per
Employee
(10000yen)
(10000 yen)
茶
Restaurants
and
Café
Gift Certificate
Year
and
Month
Sales per ㎡
178,169
188,722
180,496
430,143
432,046
403,660
3,146,099
2,823,635
2,884,385
169,117
99,644
98,763
195,651
159,092
155,096
363.4
363.7
363.3
564,657
630,061
629,804
27,803
29,055
28,975
3,518.0
3,233.1
3,219.1
68.8 C Y
67.2
68.6
2019
2020
2021
176,081
194,448
178,707
427,508
431,559
397,533
3,105,568
2,802,329
2,900,035
160,521
90,998
101,131
189,843
156,035
154,747
364.2
362.6
363.2
602,956
618,134
611,734
29,316
28,714
28,862
3,478.1
3,191.3
3,238.6
68.6 F Y
67.3
68.9
2019
2020
2021
48,899
40,848
42,990
47,760
47,109
102,069
94,366
95,888
111,337
95,942
694,256
669,570
702,484
818,075
709,907
23,719
19,655
22,450
32,939
26,086
31,092
35,208
36,827
51,969
30,743
89.1
90.8
91.7
91.7
89.0
618,134
616,072
614,138
629,804
611,734
28,714
28,706
28,904
28,975
28,862
777.4
768.8
787.8
884.5
796.9
16.5
16.4
16.8
18.9
16.8
Q1
Q2
Q3
Q4
Q1
2021
13,842
15,573
12,602
14,113
14,132
16,568
14,138
12,283
13,440
15,424
18,895
18,199
13,239
15,672
12,570
31,274
34,939
31,557
29,655
33,154
34,100
30,851
30,937
32,800
34,776
43,762
34,002
27,946
33,995
31,895
214,173
250,281
229,926
211,481
228,162
247,674
229,142
225,668
237,443
252,015
328,618
243,688
211,671
254,548
243,516
7,307
9,389
7,210
5,335
7,110
9,048
6,663
6,740
9,610
10,771
12,559
8,943
7,119
10,025
10,014
8,539
13,497
10,858
8,319
16,031
17,451
10,355
9,021
9,484
17,410
25,076
9,246
7,909
13,589
11,863
28.1
30.6
30.0
30.8
30.0
30.8
30.9
30.0
30.8
30.0
30.9
30.3
28.1
30.6
30.0
607,677
618,134
613,316
618,521
616,072
620,074
623,403
614,138
617,339
617,817
629,804
623,140
604,409
611,734
608,857
28,969
28,714
28,724
28,731
28,706
28,961
28,958
28,904
28,876
28,938
28,975
28,974
28,931
28,862
28,888
246.3
270.2
253.1
249.1
266.5
276.4
257.9
253.4
267.6
276.4
339.7
269.1
248.8
278.8
266.7
5.1
5.8
5.4
5.3
5.7
5.9
5.5
5.4
5.7
5.9
7.3
5.8
5.2
5.9
5.6
Feb
Mar
Apr
May
Jun
Jul
Aug
Sep
Oct
Nov
Dec
Jan
Feb
Mar
Apr
2021
3.6
▲3.5
▲6.0
▲4.5
▲5.9
▲7.7
▲0.1
▲13.6
1.3
▲3.0
▲41.1
▲0.9
▲8.2
▲20.4
▲2.8
0.0
0.1
▲0.1
▲0.2
1.0
▲0.0
▲1.5
▲1.5
▲0.3
▲0.8
▲6.0
▲0.0
0.4 C Y
▲3.6
1.9
2019
2020
2021
1.3
▲0.2
▲8.1
▲4.4
▲6.0
▲7.9
▲1.7
▲13.5
3.5
▲7.1
▲43.4
11.1
▲9.6
▲19.6
▲0.8
0.2
▲0.5
0.2
▲0.5
2.5
▲1.0
▲1.3
▲2.1
0.5
▲1.4
▲6.0
1.5
▲0.1 F Y
▲3.2
2.4
2019
2020
2021
5.3
▲9.3
▲11.3
▲8.2
▲3.7
▲5.4
▲6.0
▲14.4
▲4.9
▲6.0
▲5.9
14.3
▲2.8
2.3
2.3
▲26.8
64.8
▲14.7
13.5
10.0
▲10.3
11.4
▲7.5
▲2.9
▲1.1
▲1.3
0.7
0.1
0.0
▲0.1
2.5
0.9
0.4
▲0.0
▲1.0
▲2.1
▲1.5
▲0.2
▲0.3
0.5
▲3.5
4.2
▲1.8
1.4
2.5
▲0.6
7.2
▲0.6
1.6
1.8
Q1
Q2
Q3
Q4
Q1
2021
0.1
1.5
3.6
▲6.1
▲20.8
▲5.0
▲18.0
▲11.0
▲3.0
▲9.3
▲10.7
▲6.6
▲4.4
0.6
▲0.3
▲5.3
▲3.8
10.1
▲5.6
▲17.8
▲11.5
▲19.5
▲11.9
▲6.4
▲2.2
▲5.9
▲5.2
▲10.6
▲2.7
1.1
▲9.1
3.8
40.2
15.3
▲4.3
2.0
▲7.1
▲3.3
2.3
1.1
3.3
6.0
▲1.2
1.7
5.9
▲30.9
18.5
297.8
119.6
▲7.5
5.9
▲25.3
▲23.9
0.3
12.7
26.9
27.3
▲2.6
6.8
38.9
▲11.0
2.5
66.0
11.3
▲8.9
▲7.3
▲9.8
▲5.3
▲2.4
▲1.5
▲4.0
2.1
▲7.4
0.7
9.3
▲3.1
▲0.3
1.0
1.0
0.0
0.0
0.0
0.3
0.0
0.0
0.0
▲0.3
0.0
0.0
0.0
0.6
2.5
2.3
1.6
0.9
0.9
▲0.2
0.4
0.5
0.2
▲0.0
▲0.2
▲0.5
▲1.0
▲0.7
▲1.4
▲2.1
▲1.6
▲1.6
▲1.5
▲0.7
▲0.7
▲0.2
▲0.3
▲0.3
▲0.3
▲0.2
▲0.1
0.5
0.6
▲3.9
0.3
13.1
4.3
▲3.1
0.4
▲4.6
▲1.2
0.8
1.6
1.7
3.2
1.0
3.2
5.4
▲1.9
5.5
17.4
6.0
▲0.0
1.7
▲5.2
▲0.0
1.8
1.7
1.4
3.6
2.0
1.7
3.7
Feb
Mar
Apr
May
Jun
Jul
Aug
Sep
Oct
Nov
Dec
Jan
Feb
Mar
Apr
2021
0.2
▲7.5
▲8.0
▲3.5
▲6.8
▲7.7
▲0.2
▲14.4
1.5
▲2.3
▲40.4
0.0
▲7.7
▲19.4
▲2.2
0.0
0.0
▲0.1
▲1.0
▲0.2
▲0.9
▲0.6
▲0.8
0.1
0.0
▲6.1
0.4
▲0.3 C Y
▲5.5
1.0
2019
2020
2021
▲2.4
▲3.8
▲9.6
▲3.3
▲7.4
▲7.5
▲1.9
▲14.2
3.6
▲6.5
▲42.7
12.0
▲8.9
▲18.8
▲0.2
0.3
▲0.5
0.2
▲1.9
2.1
▲2.0
▲0.9
▲1.0
0.5
▲0.7
▲6.2
2.0
▲1.0 F Y
▲5.2
1.6
2019
2020
2021
2.8
▲11.1
▲12.8
▲9.6
▲4.9
▲6.5
▲5.3
▲13.8
▲4.8
▲5.8
▲5.8
14.6
▲2.6
2.3
2.2
▲26.1
66.6
▲13.7
14.1
10.6
▲10.0
12.3
▲6.8
▲2.3
▲0.8
▲1.3
0.7
0.0
0.0
0.0
2.1
0.2
▲0.4
▲0.9
▲2.0
▲1.0
▲0.8
0.1
0.1
0.5
▲3.5
4.7
▲1.2
1.9
3.0
▲1.8
6.5
▲1.8
1.1
1.2
Q1
Q2
Q3
Q4
Q1
2021
▲1.5
▲0.1
1.3
▲7.8
▲22.4
▲6.5
▲19.2
▲12.7
▲4.6
▲10.6
▲12.1
▲7.8
▲5.5
▲0.8
▲1.9
▲8.2
▲2.5
10.8
▲4.9
▲17.2
▲10.7
▲18.7
▲11.9
▲6.4
▲2.1
▲5.6
▲4.8
▲10.3
▲2.8
1.0
▲9.3
4.5
40.6
15.5
▲4.0
2.3
▲6.6
▲3.5
2.1
0.9
3.4
6.0
▲1.0
1.4
5.7
▲30.5
20.2
301.9
121.8
▲6.4
7.2
▲23.7
▲23.7
0.8
13.4
27.7
28.3
▲1.6
6.9
39.2
▲10.8
3.1
67.2
12.1
▲8.0
▲6.4
▲9.0
▲4.8
▲2.0
▲0.9
▲3.4
2.6
▲6.9
0.7
9.2
▲3.3
▲0.3
1.1
1.0
0.1
0.0
▲0.1
0.2
0.0
0.0
0.1
▲0.1
0.1
0.1
0.0
▲0.4
2.1
1.6
0.9
0.2
0.2
▲0.9
▲0.4
▲0.4
▲0.6
▲0.9
▲1.1
▲1.4
▲2.0
▲1.6
▲0.9
▲1.0
▲0.9
▲0.8
▲0.8
0.1
0.1
0.1
0.1
0.2
0.1
0.2
0.2
0.5
0.6
▲4.4
0.9
13.7
4.7
▲2.4
1.1
▲3.8
▲0.9
1.2
2.1
2.3
3.7
1.5
3.6
5.8
▲3.8
3.6
17.4
6.0
▲1.7
1.7
▲5.2
▲1.9
1.8
1.7
0.0
1.8
▲0.0
1.7
3.7
Feb
Mar
Apr
May
Jun
Jul
Aug
Sep
Oct
Nov
Dec
Jan
Feb
Mar
Apr
2021
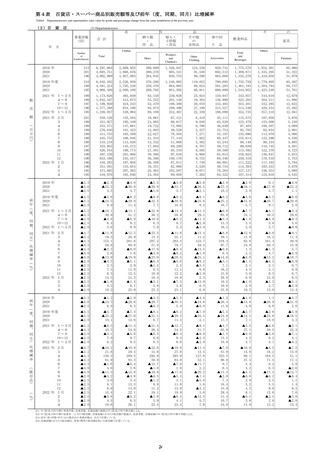
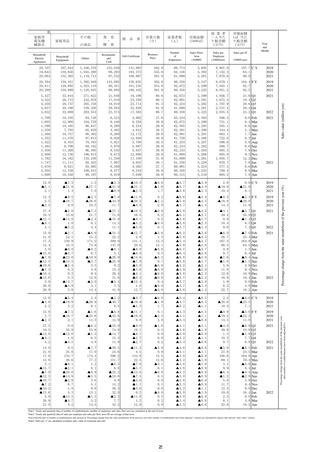
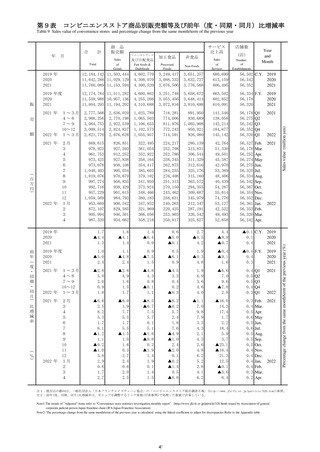
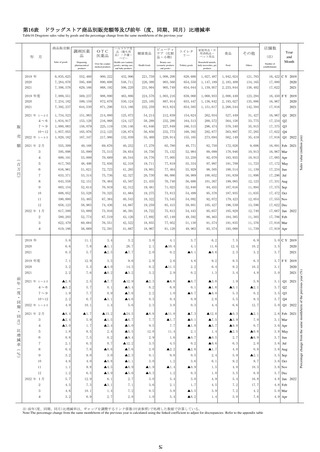
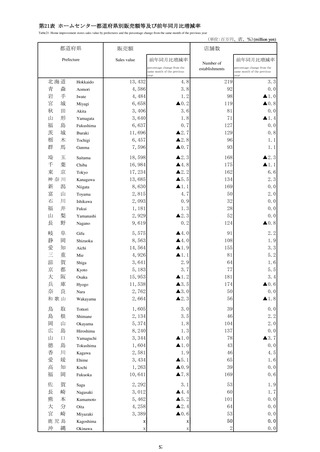
Note1 Yearly and quarterly data of number of establishments, number of employees and sales floor area are calculated at the end of term.
Note2 Yearly and quarterly data of sales per employee and sales per floor area (㎡) are average of that term.
Note3:Growth rates of number of establishments that showed at "Percentage change from the same month/term of the previous year after number of establisments have been adjusted " column are calculated by figures that showed "sales value" column.
Note4 Sales per ㎡ are calculated excluding sales value of restaurant and café.
Note5: The percentage change from the same month/term of the previous year is calculated using the linked coefficient to adjust for discrepancies.Refer to the Appendix table.
23
2022
Sales value (million yen)
その他
2022
2022
2022
2022
2022
Percentage change from the same month/term of the previous year (%)
家庭用品
Percentage change from the same month/term of the previous year
after number of establishments have been adjusted(%).
他
家庭用
電気機
械器具