

よむ、つかう、まなぶ。
商業動態統計速報 2022年4月分 (3 ページ)
出典
| 公開元URL | https://www.meti.go.jp/statistics/tyo/syoudou/result/sokuho_2.html |
| 出典情報 | 商業動態統計速報 2022年4月分(5/31)《経済産業省》 |
ページ画像
ダウンロードした画像を利用する際は「出典情報」を明記してください。
低解像度画像をダウンロード
プレーンテキスト
資料テキストはコンピュータによる自動処理で生成されており、完全に資料と一致しない場合があります。
テキストをコピーしてご利用いただく際は資料と付け合わせてご確認ください。
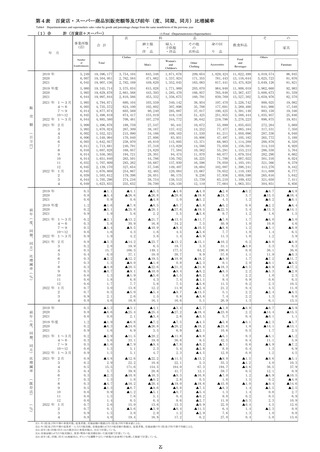
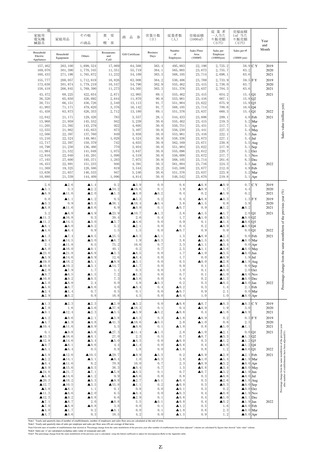
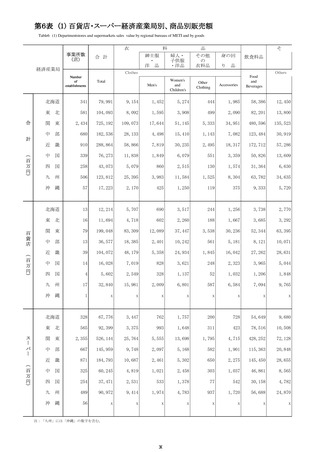
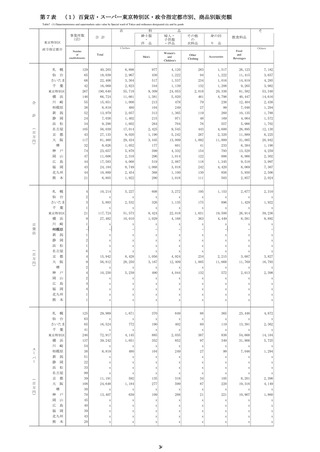
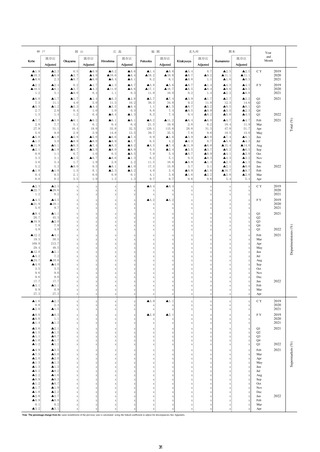
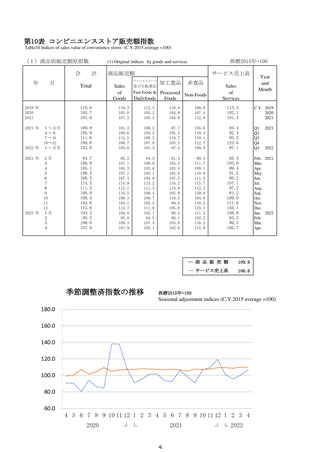
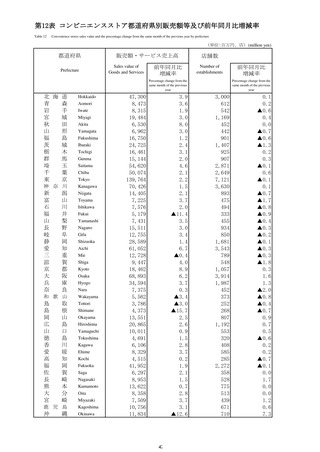
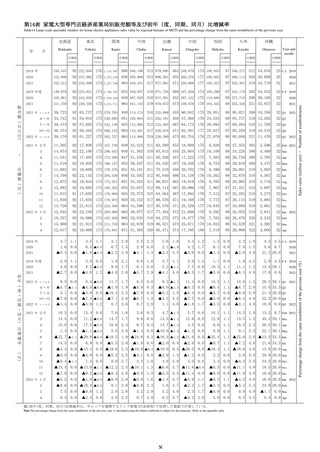
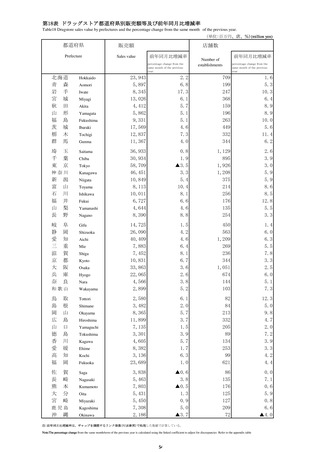
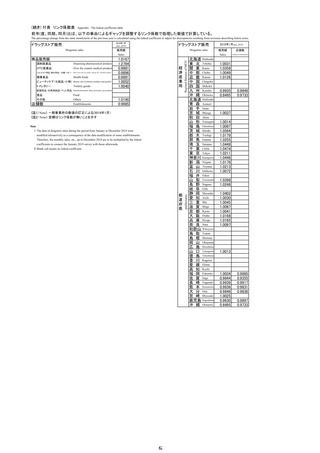
商業販売額の動向
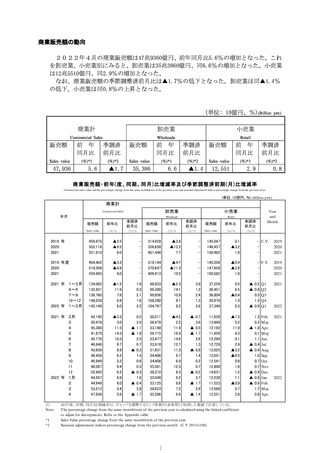
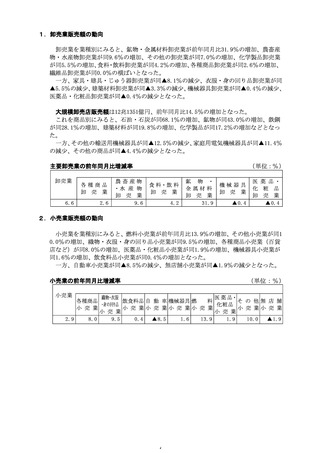
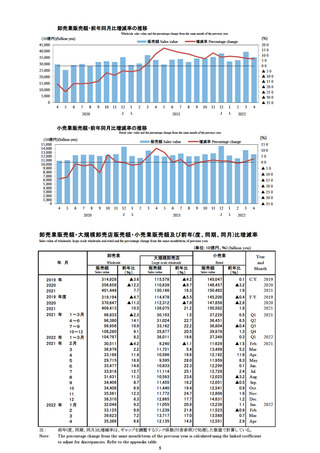
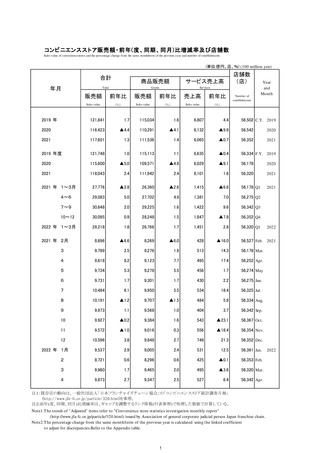
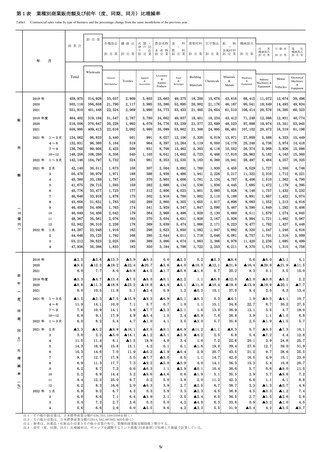
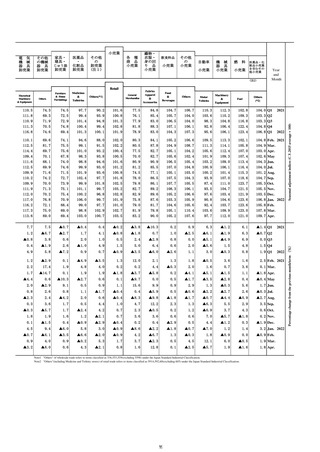
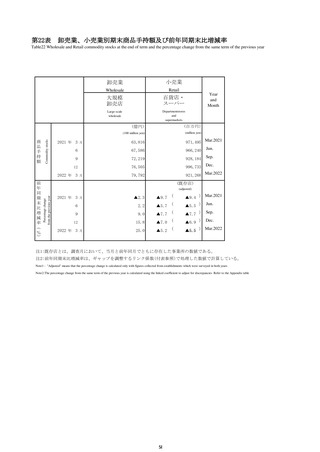
2022年4月の商業販売額は47兆9360億円、前年同月比5.6%の増加となった。これ
を卸売業、小売業別にみると、卸売業は35兆3860億円、同6.6%の増加となった。小売業
は12兆5510億円、同2.9%の増加となった。
なお、商業販売額の季節調整済前月比は▲1.7%の低下となった。卸売業は同▲1.4%
の低下、小売業は同0.8%の上昇となった。
(単位: 10億円、%)(Billion
商業計
卸売業
小売業
Commercial Sales
Wholesale
Retail
販売額
前 年
同月比
Sales value
(%)*1
47,936
5.6
季調済
前月比
(%)*2
▲1.7
販売額
前 年
同月比
Sales value
(%)*1
35,386
6.6
季調済
前月比
(%)*2
販売額
前 年
同月比
Sales value
▲1.4
季調済
前月比
(%)*1
12,551
yen)
(%)*2
2.9
0.8
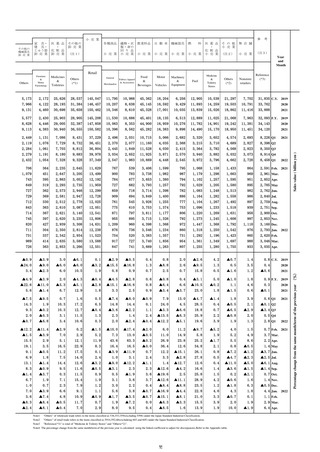
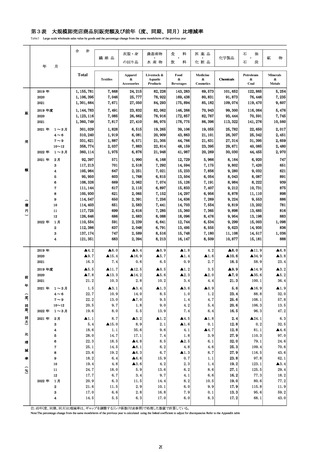
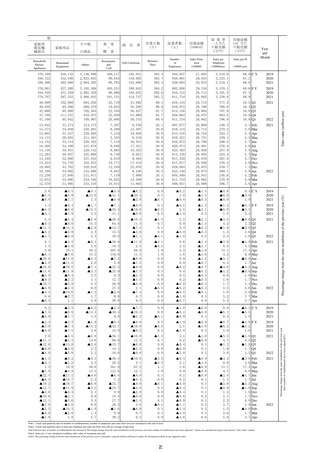
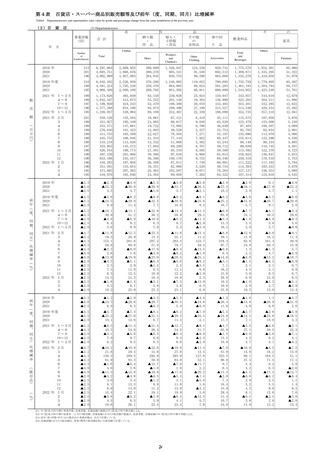
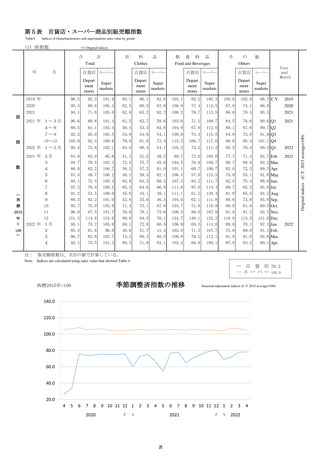
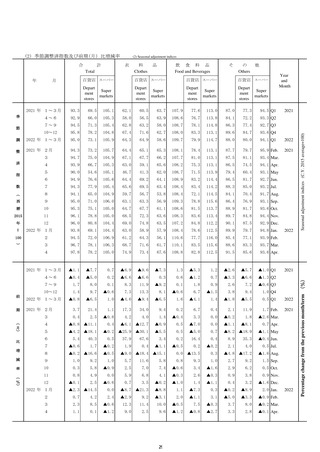
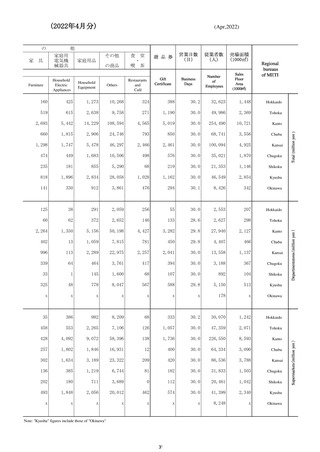
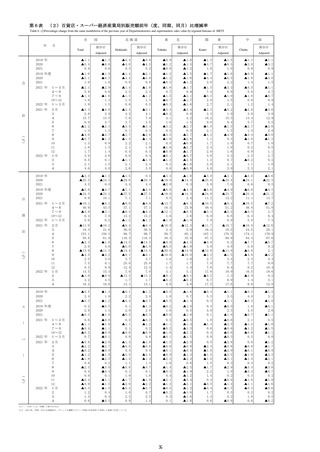
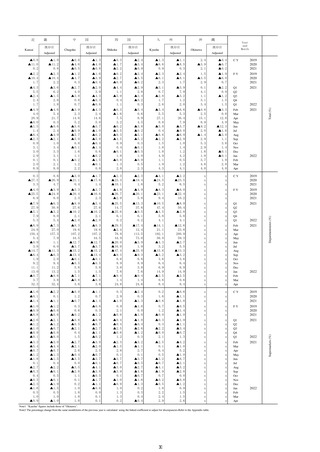
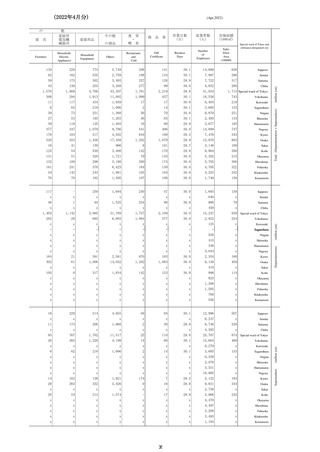
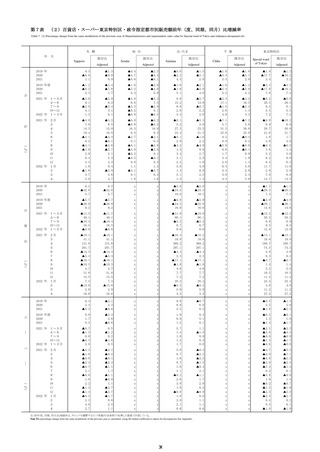
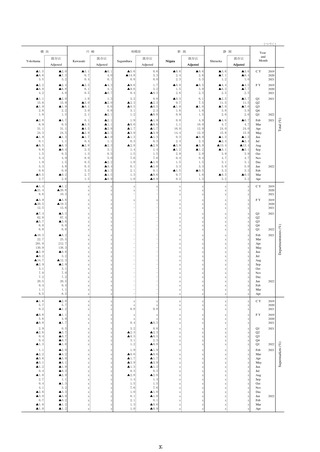
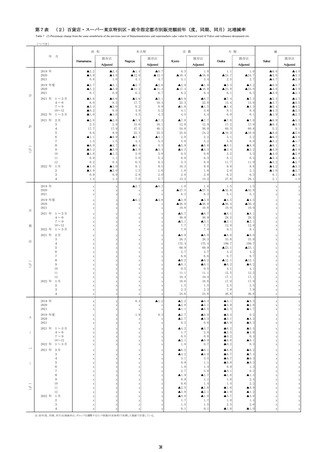
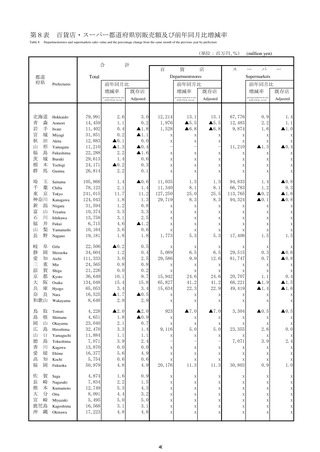
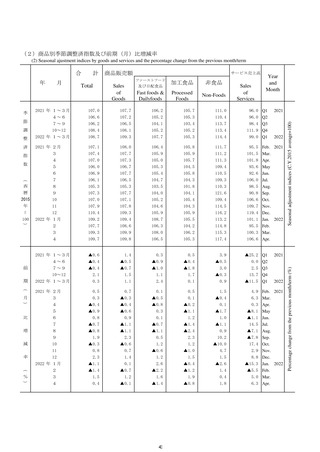
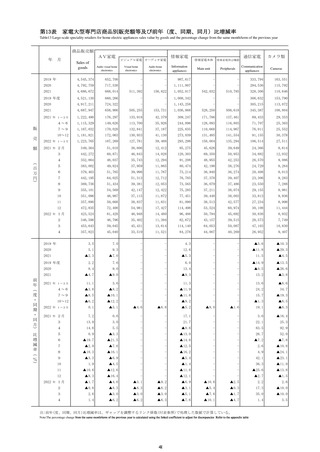
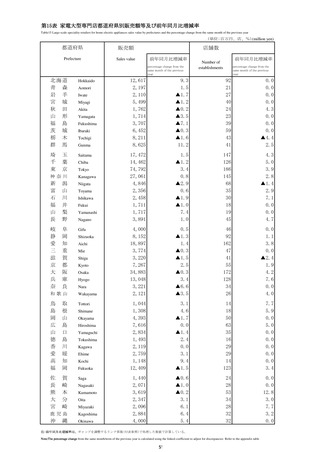
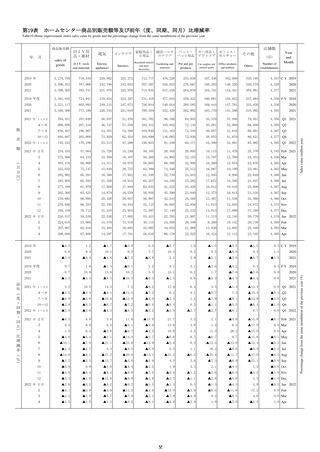
商業販売額・前年(度、同期、同月)比増減率及び季節調整済前期(月)比増減率
Commercial sales value and the percentage change from the same month/term of the previous y ear and seasonal adjustment indices percentage change from the previous term.
(単位: 10億円、%) (billion yen)
商業計
Commercial Sales
年月
小売業
Wholesale
Retail
販売額
前年比
季調済
前月比
販売額
前年比
季調済
前月比
販売額
前年比
季調済
前月比
Sales value
(%)*1
(%)*2
Sales value
(%)*1
(%)*2
Sales value
(%)*1
(%)*2
Year
and
Month
2019 年
2020
2021
459,975
503,116
551,910
▲2.5
▲9.5
6.0
-
314,928
356,658
401,448
▲3.6
▲12.2
7.7
-
145,047
146,457
150,462
0.1
▲3.2
1.9
- C.Y.
-
2019
2020
2021
2019 年度
2020
2021
464,402
518,506
559,995
▲3.3
▲8.8
8.0
-
319,194
370,647
409,413
▲4.7
▲11.3
10.5
-
145,208
147,858
150,582
▲0.4
▲2.8
1.8
- F.Y.
-
2019
2020
2021
2021 年 1~3月
4~6
7~9
10~12
2022 年 1~3月
134,062
132,831
136,760
148,258
142,146
▲1.5
11.9
7.6
6.9
6.0
1.9
0.3
2.1
1.6
2.2
96,833
96,380
99,956
108,280
104,797
▲2.3
14.1
10.9
9.1
8.2
3.8
1.2
2.4
1.3
3.6
37,229
36,451
36,804
39,978
37,349
0.5
6.5
▲0.4
1.3
0.3
▲ 0.2 Q1
▲ 0.8 Q2
0.5 Q3
1.5 Q4
▲ 0.9 Q1
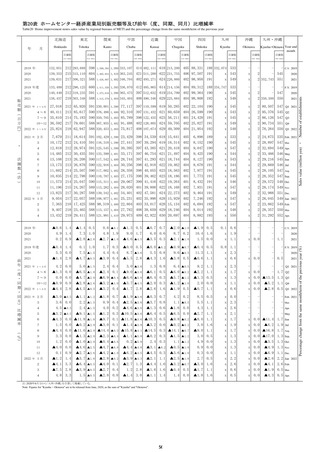
2021
42,140
50,478
45,380
41,675
45,776
46,646
43,656
46,458
46,949
48,367
52,942
44,287
44,648
53,212
47,936
▲3.3
3.0
11.5
14.3
10.3
9.7
6.9
6.2
5.2
9.4
6.2
6.9
6.0
5.4
5.6
0.5
2.6
1.1
1.8
2.5
0.7
0.3
1.5
0.6
0.3
0.3
1.6
0.4
2.8
1.7
30,511
36,979
33,188
29,715
33,477
33,918
31,631
34,406
34,408
35,561
38,310
32,048
33,125
39,623
35,386
▲4.2
2.2
11.4
16.9
14.6
12.7
11.3
8.7
6.9
12.3
8.3
9.2
8.6
7.2
6.6
▲ 0.7
3.6
▲ 0.5
▲ 1.7
2.6
1.3
▲ 0.8
1.4
0.2
0.7
▲ 0.2
3.7
▲ 1.7
2.9
▲ 1.4
11,629
13,499
12,192
11,959
12,299
12,728
12,025
12,051
12,541
12,806
14,631
12,238
11,523
13,588
12,551
▲1.5
5.2
11.9
8.3
0.1
2.4
▲3.2
▲0.5
0.9
1.9
1.2
1.1
▲0.9
0.7
2.9
1.3
0.2
1.8
0.1
1.1
0.4
0.4
1.0
0.7
0.7
0.4
0.9
0.9
1.7
0.8
2021
2021 年 2月
3
4
5
6
7
8
9
10
11
12
2022 年 1月
2
3
4
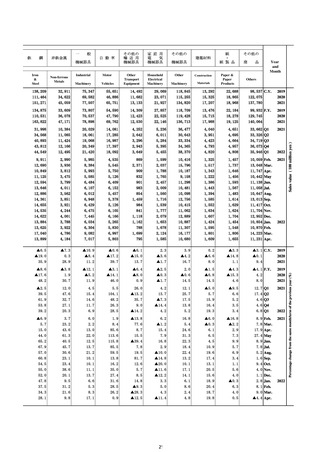
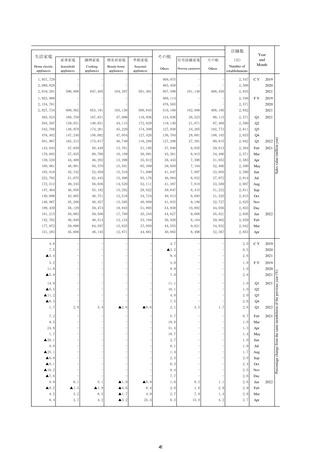
注:
Note:
*1
*2
卸売業
▲
▲
▲
▲
▲
▲
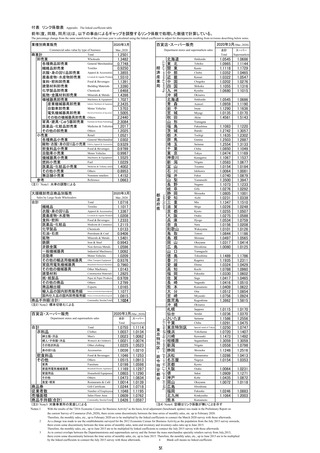
前年(度、同期、同月)比増減率は、ギャップを調整するリンク係数(付表参照)で処理した数値で計算している。
T he percentage change from the same month/term of the previous year is calculated using the linked coefficient
to adjust for discrepancies Refer to the Appendix table
Sales Value percentage change from the same month/term of the previous year
Seasonal adjustement indices percentage change from the previous month (C Y 2015=100)
3
▲
▲
▲
▲
▲
▲
Feb.
M ar.
Apr.
M ay
Jun.
Jul.
Aug.
Sep.
Oct.
Nov.
Dec.
Jan.
Feb.
M ar.
Apr.
2022
2022
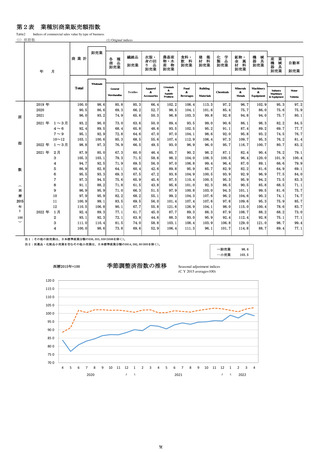
2022年4月の商業販売額は47兆9360億円、前年同月比5.6%の増加となった。これ
を卸売業、小売業別にみると、卸売業は35兆3860億円、同6.6%の増加となった。小売業
は12兆5510億円、同2.9%の増加となった。
なお、商業販売額の季節調整済前月比は▲1.7%の低下となった。卸売業は同▲1.4%
の低下、小売業は同0.8%の上昇となった。
(単位: 10億円、%)(Billion
商業計
卸売業
小売業
Commercial Sales
Wholesale
Retail
販売額
前 年
同月比
Sales value
(%)*1
47,936
5.6
季調済
前月比
(%)*2
▲1.7
販売額
前 年
同月比
Sales value
(%)*1
35,386
6.6
季調済
前月比
(%)*2
販売額
前 年
同月比
Sales value
▲1.4
季調済
前月比
(%)*1
12,551
yen)
(%)*2
2.9
0.8
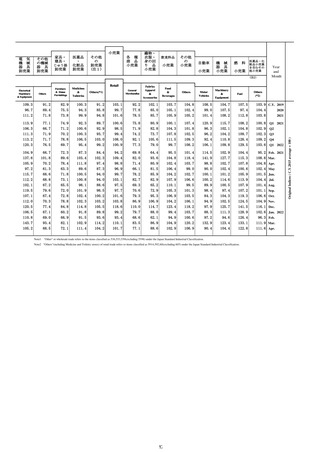
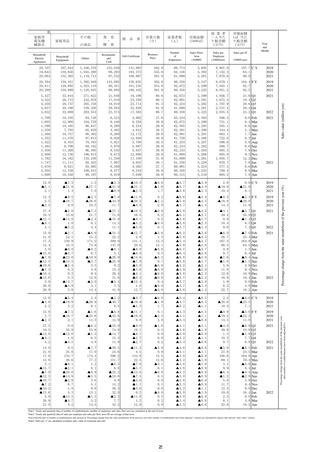
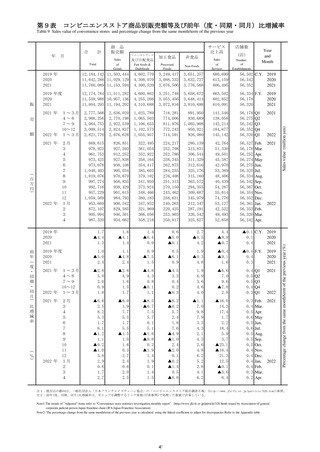
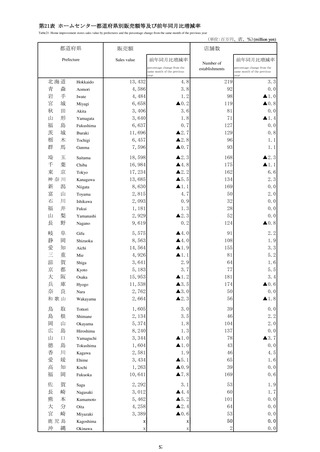
商業販売額・前年(度、同期、同月)比増減率及び季節調整済前期(月)比増減率
Commercial sales value and the percentage change from the same month/term of the previous y ear and seasonal adjustment indices percentage change from the previous term.
(単位: 10億円、%) (billion yen)
商業計
Commercial Sales
年月
小売業
Wholesale
Retail
販売額
前年比
季調済
前月比
販売額
前年比
季調済
前月比
販売額
前年比
季調済
前月比
Sales value
(%)*1
(%)*2
Sales value
(%)*1
(%)*2
Sales value
(%)*1
(%)*2
Year
and
Month
2019 年
2020
2021
459,975
503,116
551,910
▲2.5
▲9.5
6.0
-
314,928
356,658
401,448
▲3.6
▲12.2
7.7
-
145,047
146,457
150,462
0.1
▲3.2
1.9
- C.Y.
-
2019
2020
2021
2019 年度
2020
2021
464,402
518,506
559,995
▲3.3
▲8.8
8.0
-
319,194
370,647
409,413
▲4.7
▲11.3
10.5
-
145,208
147,858
150,582
▲0.4
▲2.8
1.8
- F.Y.
-
2019
2020
2021
2021 年 1~3月
4~6
7~9
10~12
2022 年 1~3月
134,062
132,831
136,760
148,258
142,146
▲1.5
11.9
7.6
6.9
6.0
1.9
0.3
2.1
1.6
2.2
96,833
96,380
99,956
108,280
104,797
▲2.3
14.1
10.9
9.1
8.2
3.8
1.2
2.4
1.3
3.6
37,229
36,451
36,804
39,978
37,349
0.5
6.5
▲0.4
1.3
0.3
▲ 0.2 Q1
▲ 0.8 Q2
0.5 Q3
1.5 Q4
▲ 0.9 Q1
2021
42,140
50,478
45,380
41,675
45,776
46,646
43,656
46,458
46,949
48,367
52,942
44,287
44,648
53,212
47,936
▲3.3
3.0
11.5
14.3
10.3
9.7
6.9
6.2
5.2
9.4
6.2
6.9
6.0
5.4
5.6
0.5
2.6
1.1
1.8
2.5
0.7
0.3
1.5
0.6
0.3
0.3
1.6
0.4
2.8
1.7
30,511
36,979
33,188
29,715
33,477
33,918
31,631
34,406
34,408
35,561
38,310
32,048
33,125
39,623
35,386
▲4.2
2.2
11.4
16.9
14.6
12.7
11.3
8.7
6.9
12.3
8.3
9.2
8.6
7.2
6.6
▲ 0.7
3.6
▲ 0.5
▲ 1.7
2.6
1.3
▲ 0.8
1.4
0.2
0.7
▲ 0.2
3.7
▲ 1.7
2.9
▲ 1.4
11,629
13,499
12,192
11,959
12,299
12,728
12,025
12,051
12,541
12,806
14,631
12,238
11,523
13,588
12,551
▲1.5
5.2
11.9
8.3
0.1
2.4
▲3.2
▲0.5
0.9
1.9
1.2
1.1
▲0.9
0.7
2.9
1.3
0.2
1.8
0.1
1.1
0.4
0.4
1.0
0.7
0.7
0.4
0.9
0.9
1.7
0.8
2021
2021 年 2月
3
4
5
6
7
8
9
10
11
12
2022 年 1月
2
3
4
注:
Note:
*1
*2
卸売業
▲
▲
▲
▲
▲
▲
前年(度、同期、同月)比増減率は、ギャップを調整するリンク係数(付表参照)で処理した数値で計算している。
T he percentage change from the same month/term of the previous year is calculated using the linked coefficient
to adjust for discrepancies Refer to the Appendix table
Sales Value percentage change from the same month/term of the previous year
Seasonal adjustement indices percentage change from the previous month (C Y 2015=100)
3
▲
▲
▲
▲
▲
▲
Feb.
M ar.
Apr.
M ay
Jun.
Jul.
Aug.
Sep.
Oct.
Nov.
Dec.
Jan.
Feb.
M ar.
Apr.
2022
2022