

よむ、つかう、まなぶ。
商業動態統計速報 2022年4月分 (41 ページ)
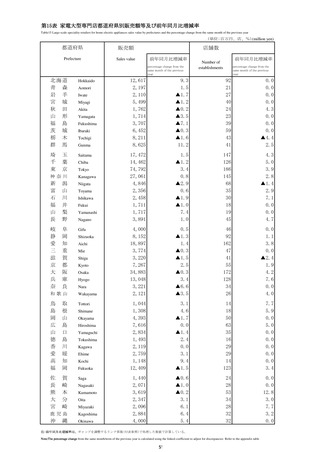
出典
| 公開元URL | https://www.meti.go.jp/statistics/tyo/syoudou/result/sokuho_2.html |
| 出典情報 | 商業動態統計速報 2022年4月分(5/31)《経済産業省》 |
ページ画像
ダウンロードした画像を利用する際は「出典情報」を明記してください。
低解像度画像をダウンロード
プレーンテキスト
資料テキストはコンピュータによる自動処理で生成されており、完全に資料と一致しない場合があります。
テキストをコピーしてご利用いただく際は資料と付け合わせてご確認ください。
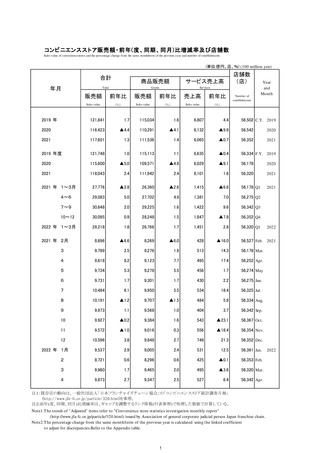
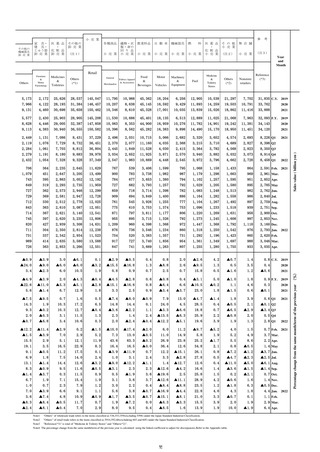
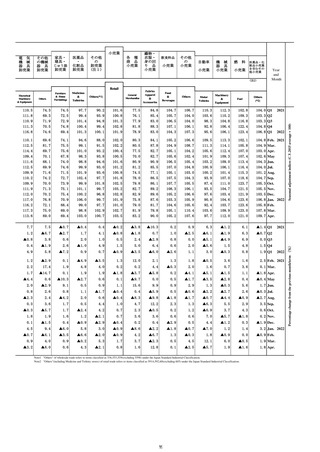
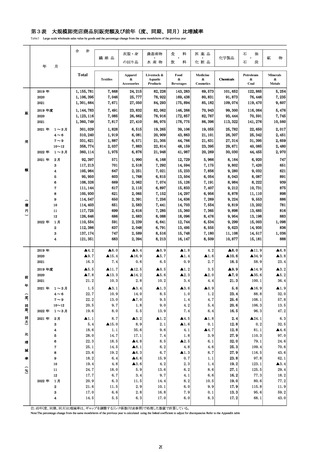
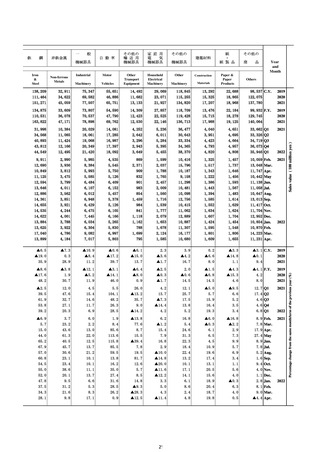
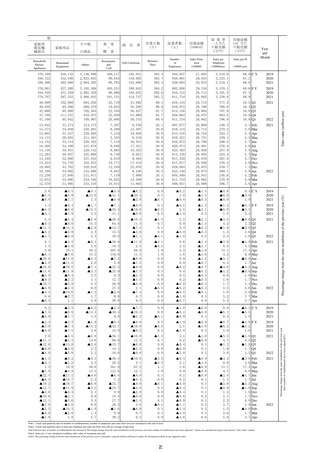
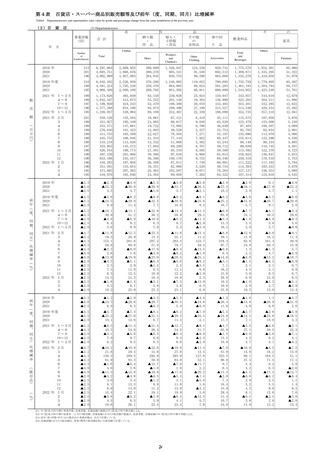
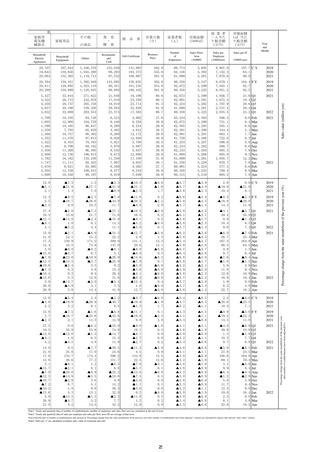
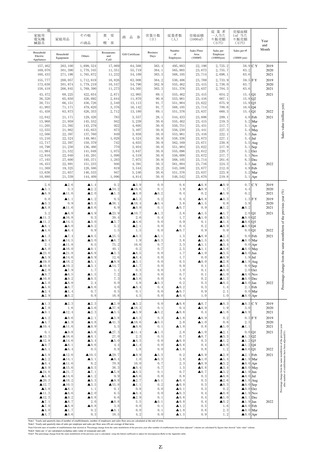
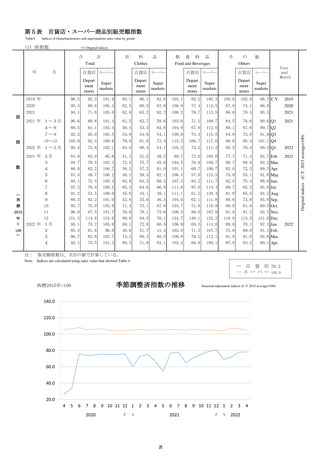
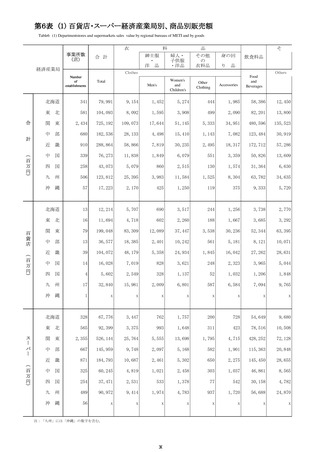
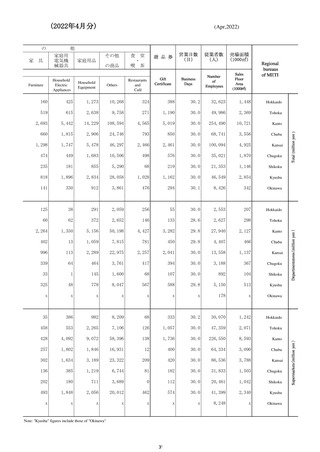
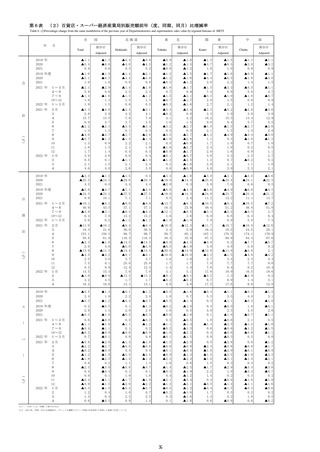
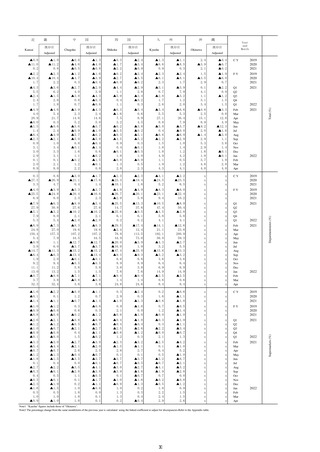
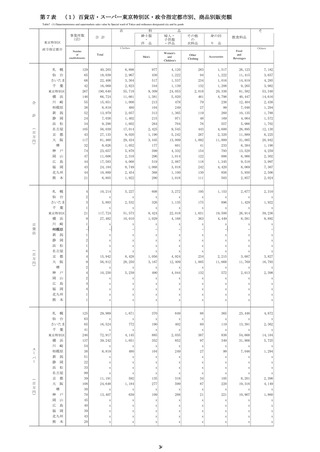
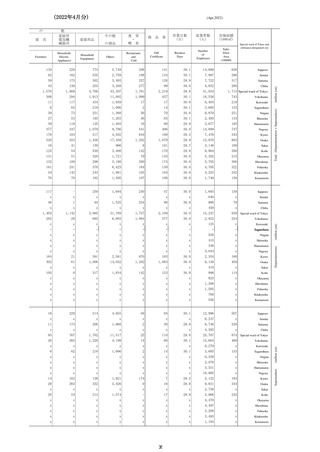
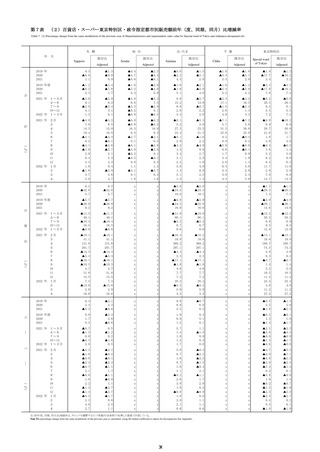
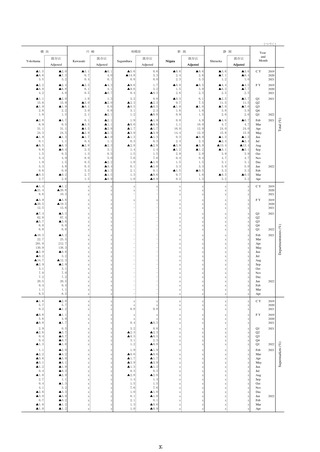
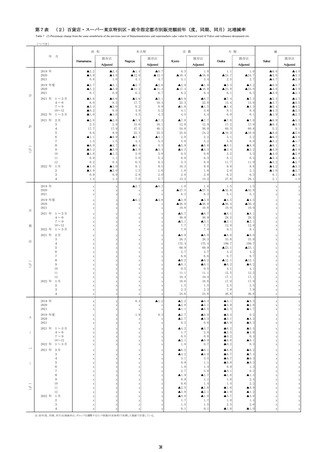
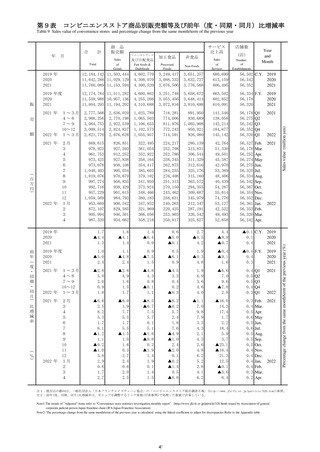
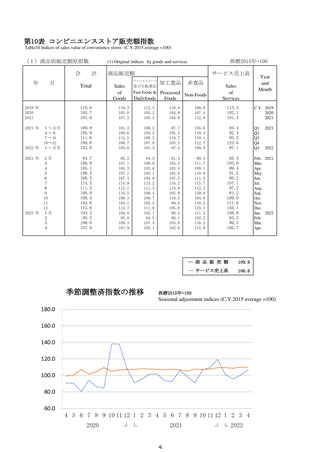
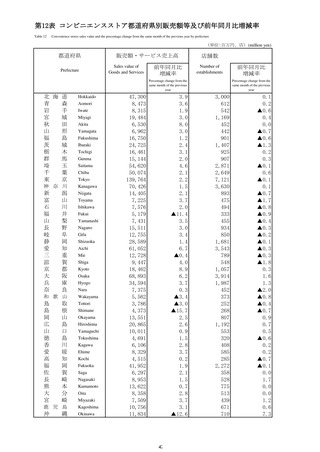
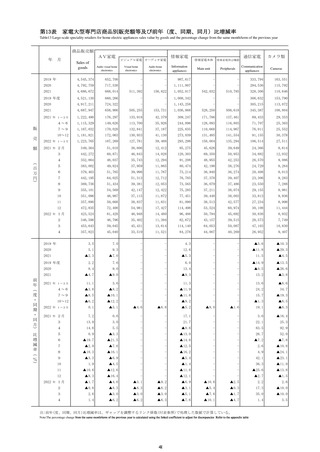
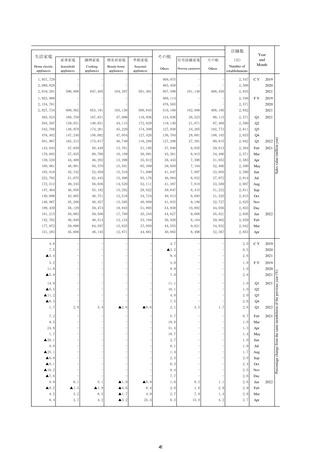
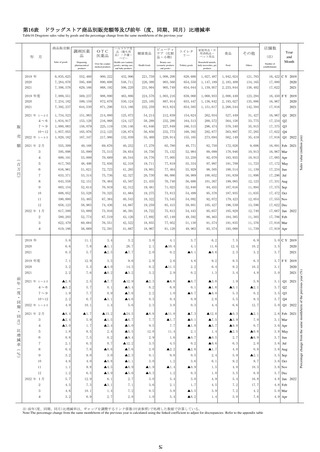
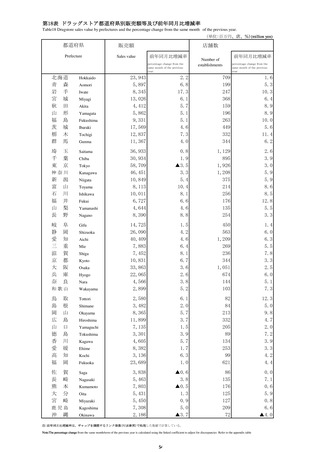
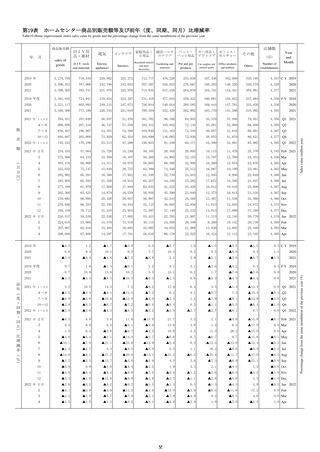
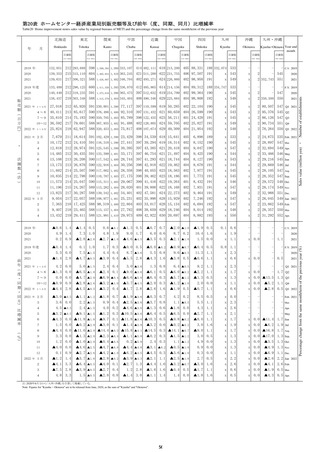
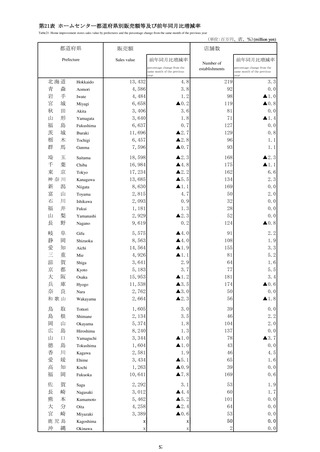
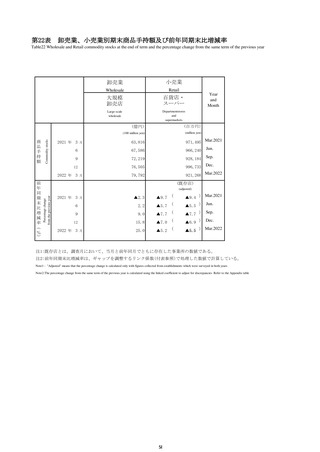
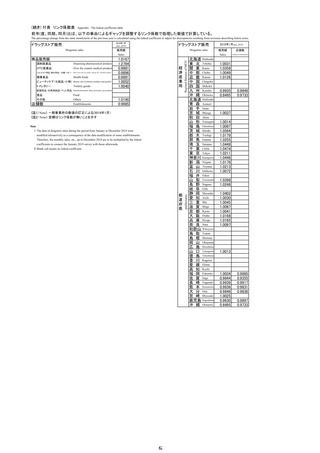
第9表
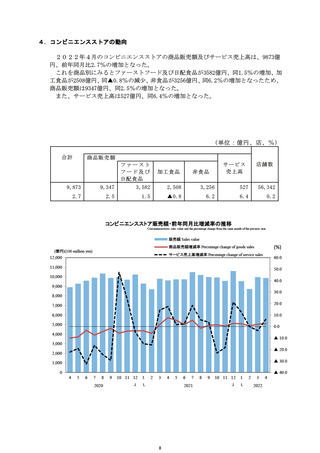
コンビニエンスストア商品別販売額等及び前年(度・同期・同月)比増減率
Table 9 Sales value of convenience stores and percentage change from the same month/term of the previous year
Total
販
売
額
(
百
万
円
)
前
年
(
度
・
同
期
・
同
月
)
比
増
減
率
(
%
)
商 品
販売額
ファーストフード
Sales
及び日配食品
of
Goods
Fast foods &
Dailyfoods
加工食品
非食品
Processed
Foods
Non-Foods
サービス
売上高
店舗数
Sales
Number
of
Establishments
of
Services
Year
and
Month
(店)
2019 年
2020
2021
12,184,143 11,503,444
11,642,288 11,029,129
11,760,089 11,153,594
4,602,770
4,308,070
4,300,520
3,249,417
3,088,332
3,076,506
3,651,257
3,632,727
3,776,568
680,699
613,159
606,495
56,502 C.Y. 2019
56,542
2020
56,352
2021
2019 年度
2020
2021
12,174,784 11,511,282
11,559,988 10,957,136
11,804,293 11,194,202
4,600,862
4,255,266
4,310,688
3,251,748
3,053,456
3,072,816
3,658,672
3,648,414
3,810,698
663,502
602,852
610,091
56,334 F.Y.
56,178
56,320
2019
2020
2021
2021
2021 年 1~3月
4~6
7~9
10~12
2022 年 1~3月
2,777,566
2,908,256
3,064,753
3,009,514
2,821,770
2,636,020
2,770,198
2,922,539
2,824,837
2,676,628
1,025,789
1,065,503
1,106,655
1,102,573
1,035,957
718,281
774,006
811,976
772,243
714,591
891,950
930,689
1,003,908
950,021
926,080
141,546
138,058
142,214
184,677
145,142
56,178
56,275
56,342
56,352
56,320
Q1
Q2
Q3
Q4
Q1
2021 年 2月
3
4
5
6
7
8
9
10
11
12
2022 年 1月
2
3
4
869,615
978,923
961,753
973,425
973,078
1,048,403
1,019,076
997,274
992,716
957,229
1,059,569
953,669
872,107
995,994
987,320
826,851
927,593
912,252
927,838
930,108
995,034
970,670
956,835
938,429
901,615
984,793
900,542
829,585
946,501
934,662
322,495
361,054
352,922
358,164
354,417
385,603
379,102
341,950
373,924
348,466
380,183
347,932
321,969
366,056
358,218
224,217
252,708
252,786
258,345
262,875
284,255
276,408
251,313
270,150
243,462
258,631
240,263
220,425
253,903
250,817
280,139
313,831
306,544
311,329
312,816
325,176
315,160
363,572
294,355
309,687
345,979
312,347
287,191
326,542
325,627
42,764
51,330
49,501
45,587
42,970
53,369
48,406
40,439
54,287
55,614
74,776
53,127
42,522
49,493
52,658
56,527
56,178
56,252
56,274
56,275
56,325
56,334
56,342
56,367
56,354
56,352
56,361
56,353
56,320
56,342
Feb. 2021
Mar.
Apr.
May
Jun.
Jul.
Aug.
Sep.
Oct.
Nov.
Dec.
Jan. 2022
Feb.
Mar.
Apr.
2019 年
2020
2021
1.7
▲4.4
1.3
1.6
▲4.1
1.4
1.4
▲6.4
0.0
0.6
▲5.0
▲0.1
2.7
▲0.5
4.2
4.4
▲9.9
▲0.7
▲0.1 C.Y. 2019
0.1
2020
0.4
2021
2019 年度
2020
2021
1.0
▲5.0
2.4
1.1
▲4.8
2.4
0.9
▲7.5
1.5
0.5
▲6.1
0.9
1.9
▲0.3
4.8
▲0.4
▲9.1
1.6
▲0.4 F.Y.
0.4
0.3
2021 年 1~3月
4~6
7~9
10~12
2022 年 1~3月
▲2.8
5.0
2.0
0.9
1.8
▲2.6
4.9
1.6
1.5
1.7
▲4.8
4.3
0.8
▲0.1
1.1
▲4.5
3.3
0.4
0.2
▲0.3
1.9
6.9
3.6
4.6
4.0
▲6.6
7.0
9.6
▲7.8
2.8
0.4
0.5
0.5
0.4
0.3
Q1
Q2
Q3
Q4
Q1
2021 年 2月
3
4
5
6
7
8
9
10
11
12
2022 年 1月
2
3
4
▲6.6
2.5
8.2
5.3
1.7
6.1
▲1.2
1.1
▲0.2
▲1.0
3.8
2.9
0.6
1.7
2.7
▲6.0
1.9
7.7
5.5
1.7
5.5
▲1.5
1.0
1.6
0.3
2.7
2.4
0.6
2.0
2.5
▲8.5
▲0.7
7.5
5.7
0.1
5.1
▲1.8
▲0.8
0.2
▲1.9
1.4
1.9
0.1
1.4
1.5
▲8.2
▲0.2
5.7
2.4
1.8
7.6
▲4.9
▲1.0
2.4
▲2.0
0.1
▲0.2
▲1.4
0.5
▲0.8
▲1.1
7.0
9.8
7.9
3.3
4.3
2.1
4.3
2.6
4.8
6.2
5.2
2.8
4.1
6.2
▲16.0
14.3
17.4
1.7
2.2
18.4
5.9
3.7
▲23.1
▲18.4
21.3
12.5
▲0.1
▲3.6
6.4
0.3
0.4
0.5
0.6
0.5
0.6
0.5
0.5
0.5
0.4
0.4
0.4
0.4
0.3
0.2
Feb. 2021
Mar.
Apr.
May
Jun.
Jul.
Aug.
Sep.
Oct.
Nov.
Dec.
Jan. 2022
Feb.
Mar.
Apr.
2022
2019
2020
2021
2021
2022
Sales value (million yen)
月
計
Percentage change from the same month/term of the previous year (%)
年
合
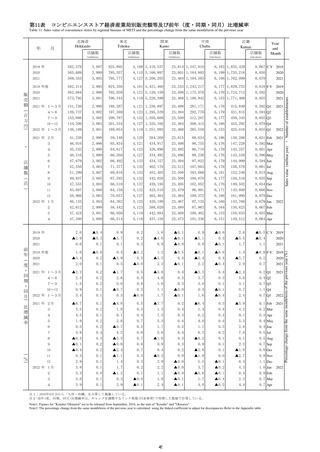
注1:既存店の動向は、一般社団法人「日本フランチャイズチェーン協会」の「コンビニエンスストア統計調査月報」(http://www.jfa-fc.or.jp/particle/320.html)参照。
注2:前年(度、同期、同月)比増減率は、ギャップを調整するリンク係数(付表参照)で処理した数値で計算している。
Note1:The trends of "Adjusted" items refer to "Convenience store statistics investigation monthly report" (http://www jfa-fc or jp/particle/320 html) issued by Association of general
corporate judicial person Japan franchise chain (JFA:Japan Franchise Association)
Note2: The percentage change from the same month/term of the previous year is calculated using the linked coefficient to adjust for discrepancies Refer to the Appendix table
41
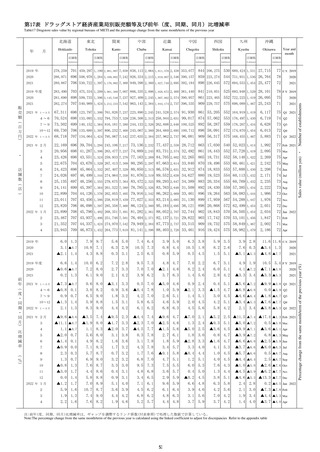
コンビニエンスストア商品別販売額等及び前年(度・同期・同月)比増減率
Table 9 Sales value of convenience stores and percentage change from the same month/term of the previous year
Total
販
売
額
(
百
万
円
)
前
年
(
度
・
同
期
・
同
月
)
比
増
減
率
(
%
)
商 品
販売額
ファーストフード
Sales
及び日配食品
of
Goods
Fast foods &
Dailyfoods
加工食品
非食品
Processed
Foods
Non-Foods
サービス
売上高
店舗数
Sales
Number
of
Establishments
of
Services
Year
and
Month
(店)
2019 年
2020
2021
12,184,143 11,503,444
11,642,288 11,029,129
11,760,089 11,153,594
4,602,770
4,308,070
4,300,520
3,249,417
3,088,332
3,076,506
3,651,257
3,632,727
3,776,568
680,699
613,159
606,495
56,502 C.Y. 2019
56,542
2020
56,352
2021
2019 年度
2020
2021
12,174,784 11,511,282
11,559,988 10,957,136
11,804,293 11,194,202
4,600,862
4,255,266
4,310,688
3,251,748
3,053,456
3,072,816
3,658,672
3,648,414
3,810,698
663,502
602,852
610,091
56,334 F.Y.
56,178
56,320
2019
2020
2021
2021
2021 年 1~3月
4~6
7~9
10~12
2022 年 1~3月
2,777,566
2,908,256
3,064,753
3,009,514
2,821,770
2,636,020
2,770,198
2,922,539
2,824,837
2,676,628
1,025,789
1,065,503
1,106,655
1,102,573
1,035,957
718,281
774,006
811,976
772,243
714,591
891,950
930,689
1,003,908
950,021
926,080
141,546
138,058
142,214
184,677
145,142
56,178
56,275
56,342
56,352
56,320
Q1
Q2
Q3
Q4
Q1
2021 年 2月
3
4
5
6
7
8
9
10
11
12
2022 年 1月
2
3
4
869,615
978,923
961,753
973,425
973,078
1,048,403
1,019,076
997,274
992,716
957,229
1,059,569
953,669
872,107
995,994
987,320
826,851
927,593
912,252
927,838
930,108
995,034
970,670
956,835
938,429
901,615
984,793
900,542
829,585
946,501
934,662
322,495
361,054
352,922
358,164
354,417
385,603
379,102
341,950
373,924
348,466
380,183
347,932
321,969
366,056
358,218
224,217
252,708
252,786
258,345
262,875
284,255
276,408
251,313
270,150
243,462
258,631
240,263
220,425
253,903
250,817
280,139
313,831
306,544
311,329
312,816
325,176
315,160
363,572
294,355
309,687
345,979
312,347
287,191
326,542
325,627
42,764
51,330
49,501
45,587
42,970
53,369
48,406
40,439
54,287
55,614
74,776
53,127
42,522
49,493
52,658
56,527
56,178
56,252
56,274
56,275
56,325
56,334
56,342
56,367
56,354
56,352
56,361
56,353
56,320
56,342
Feb. 2021
Mar.
Apr.
May
Jun.
Jul.
Aug.
Sep.
Oct.
Nov.
Dec.
Jan. 2022
Feb.
Mar.
Apr.
2019 年
2020
2021
1.7
▲4.4
1.3
1.6
▲4.1
1.4
1.4
▲6.4
0.0
0.6
▲5.0
▲0.1
2.7
▲0.5
4.2
4.4
▲9.9
▲0.7
▲0.1 C.Y. 2019
0.1
2020
0.4
2021
2019 年度
2020
2021
1.0
▲5.0
2.4
1.1
▲4.8
2.4
0.9
▲7.5
1.5
0.5
▲6.1
0.9
1.9
▲0.3
4.8
▲0.4
▲9.1
1.6
▲0.4 F.Y.
0.4
0.3
2021 年 1~3月
4~6
7~9
10~12
2022 年 1~3月
▲2.8
5.0
2.0
0.9
1.8
▲2.6
4.9
1.6
1.5
1.7
▲4.8
4.3
0.8
▲0.1
1.1
▲4.5
3.3
0.4
0.2
▲0.3
1.9
6.9
3.6
4.6
4.0
▲6.6
7.0
9.6
▲7.8
2.8
0.4
0.5
0.5
0.4
0.3
Q1
Q2
Q3
Q4
Q1
2021 年 2月
3
4
5
6
7
8
9
10
11
12
2022 年 1月
2
3
4
▲6.6
2.5
8.2
5.3
1.7
6.1
▲1.2
1.1
▲0.2
▲1.0
3.8
2.9
0.6
1.7
2.7
▲6.0
1.9
7.7
5.5
1.7
5.5
▲1.5
1.0
1.6
0.3
2.7
2.4
0.6
2.0
2.5
▲8.5
▲0.7
7.5
5.7
0.1
5.1
▲1.8
▲0.8
0.2
▲1.9
1.4
1.9
0.1
1.4
1.5
▲8.2
▲0.2
5.7
2.4
1.8
7.6
▲4.9
▲1.0
2.4
▲2.0
0.1
▲0.2
▲1.4
0.5
▲0.8
▲1.1
7.0
9.8
7.9
3.3
4.3
2.1
4.3
2.6
4.8
6.2
5.2
2.8
4.1
6.2
▲16.0
14.3
17.4
1.7
2.2
18.4
5.9
3.7
▲23.1
▲18.4
21.3
12.5
▲0.1
▲3.6
6.4
0.3
0.4
0.5
0.6
0.5
0.6
0.5
0.5
0.5
0.4
0.4
0.4
0.4
0.3
0.2
Feb. 2021
Mar.
Apr.
May
Jun.
Jul.
Aug.
Sep.
Oct.
Nov.
Dec.
Jan. 2022
Feb.
Mar.
Apr.
2022
2019
2020
2021
2021
2022
Sales value (million yen)
月
計
Percentage change from the same month/term of the previous year (%)
年
合
注1:既存店の動向は、一般社団法人「日本フランチャイズチェーン協会」の「コンビニエンスストア統計調査月報」(http://www.jfa-fc.or.jp/particle/320.html)参照。
注2:前年(度、同期、同月)比増減率は、ギャップを調整するリンク係数(付表参照)で処理した数値で計算している。
Note1:The trends of "Adjusted" items refer to "Convenience store statistics investigation monthly report" (http://www jfa-fc or jp/particle/320 html) issued by Association of general
corporate judicial person Japan franchise chain (JFA:Japan Franchise Association)
Note2: The percentage change from the same month/term of the previous year is calculated using the linked coefficient to adjust for discrepancies Refer to the Appendix table
41