

よむ、つかう、まなぶ。
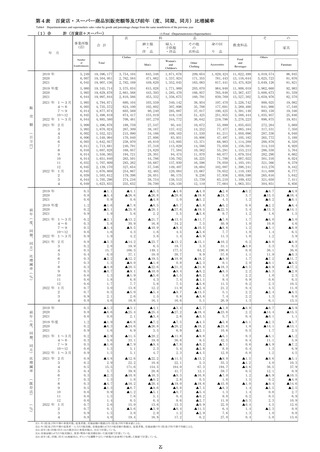
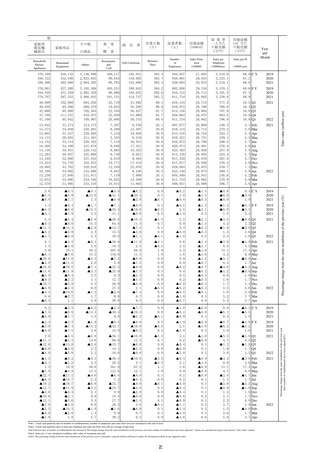
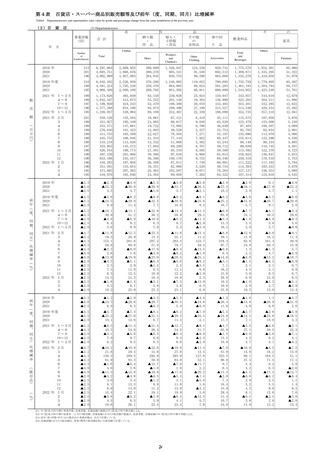
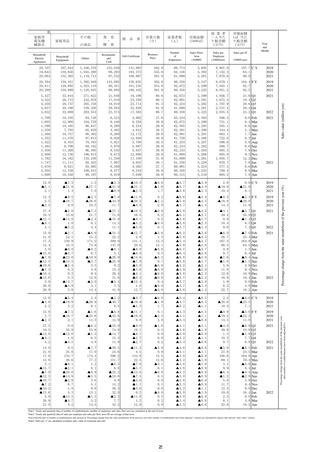
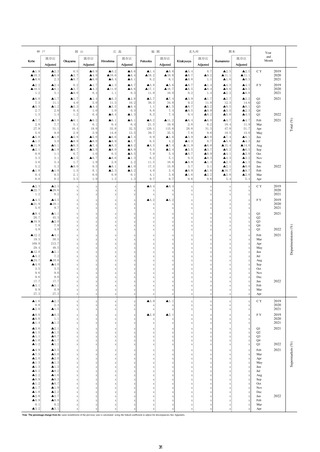
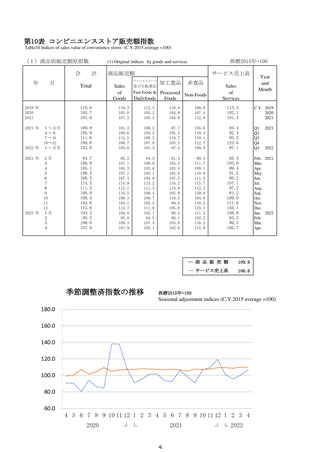
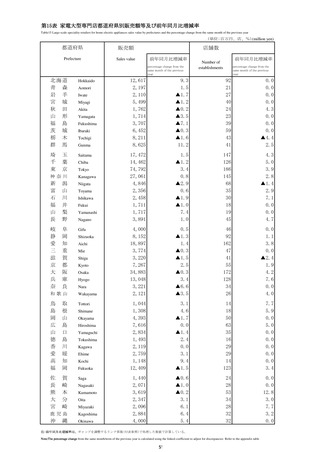
商業動態統計速報 2022年4月分 (27 ページ)
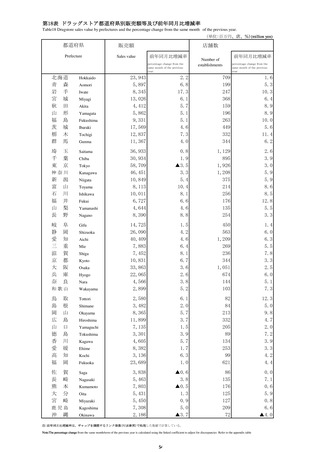
出典
| 公開元URL | https://www.meti.go.jp/statistics/tyo/syoudou/result/sokuho_2.html |
| 出典情報 | 商業動態統計速報 2022年4月分(5/31)《経済産業省》 |
ページ画像
ダウンロードした画像を利用する際は「出典情報」を明記してください。
低解像度画像をダウンロード
プレーンテキスト
資料テキストはコンピュータによる自動処理で生成されており、完全に資料と一致しない場合があります。
テキストをコピーしてご利用いただく際は資料と付け合わせてご確認ください。
Household
Electric
Appliances
Household
Equipment
食
堂
・
の商品
Others
喫
商
品
券
営業日数
(日)
従業者数
(人)
売場面積
(1000㎡)
従 業 者
一人当た
り販売額
(万円)
売場面積
1㎡ 当た
り販売額
(万円)
Business
Days
Number
of
Employees
Sales Floor
Area
(1000㎡)
Sales per
Employee
(10000yen)
(10000 yen)
茶
Restaurants
and
Café
Gift Certificate
Year
and
Month
Sales per ㎡
157,462
169,078
160,433
263,100
301,390
271,198
1,699,524
1,778,345
1,765,672
17,069
11,351
11,232
64,568
55,719
54,109
363.4
364.1
363.3
495,883
565,905
568,105
22,198
23,673
23,714
2,725.2
2,755.7
2,698.1
58.9 C Y
63.2
63.6
2019
2020
2021
155,777
173,638
158,418
268,057
301,874
266,845
1,712,619
1,779,219
1,769,390
16,826
10,547
11,273
63,008
54,790
54,305
364.2
362.9
363.3
536,406
555,462
551,376
23,769
23,415
23,637
2,733.9
2,738.0
2,704.3
59.5 F Y
63.7
63.6
2019
2020
2021
43,472
36,326
38,731
41,903
41,458
68,225
65,650
66,151
71,171
63,873
422,634
426,692
436,726
479,620
426,353
2,671
2,644
2,540
3,376
2,712
12,985
11,870
13,113
16,142
13,180
89.1
90.8
91.7
91.7
89.1
555,462
553,981
551,904
568,105
551,376
23,415
23,416
23,622
23,714
23,637
654.2
667.1
675.9
700.6
660.3
15.4
15.8
15.9
16.6
15.4
Q1
Q2
Q3
Q4
Q1
2021
12,042
13,968
11,205
12,555
12,566
15,216
12,717
10,798
11,984
12,816
17,103
16,453
11,369
13,636
10,880
21,171
21,959
21,392
21,862
22,397
22,524
22,397
21,230
21,532
22,040
27,600
22,891
19,325
21,657
21,339
129,426
145,552
143,279
145,653
137,760
149,861
150,379
136,486
141,048
145,201
193,371
151,233
128,586
146,533
144,409
783
942
922
873
849
1,028
742
770
1,075
1,098
1,203
946
819
947
1,096
3,557
5,239
4,605
3,407
3,858
4,524
4,655
3,934
3,647
4,519
7,975
4,391
3,544
5,246
4,814
28.1
30.6
30.0
30.8
30.0
30.8
30.9
30.0
30.8
30.0
30.9
30.3
28.2
30.6
30.0
544,433
555,462
550,751
556,230
553,981
558,336
562,169
551,904
555,096
556,008
568,105
561,804
543,508
551,376
548,542
23,606
23,415
23,431
23,441
23,416
23,673
23,671
23,622
23,612
23,672
23,714
23,716
23,677
23,637
23,670
209.1
219.3
217.7
227.3
222.1
227.1
230.8
217.9
220.7
217.7
261.6
224.3
212.0
223.8
219.8
4.8
5.2
5.1
5.4
5.3
5.4
5.5
5.1
5.2
5.1
6.3
5.3
4.9
5.2
5.1
Feb
Mar
Apr
May
Jun
Jul
Aug
Sep
Oct
Nov
Dec
Jan
Feb
Mar
Apr
2021
2.6
▲3.1
▲6.9
▲2.6
3.3
▲11.6
▲1.4
▲2.2
▲2.0
0.2
▲34.2
▲1.3
▲3.9
▲18.6
▲4.0
0.0
0.1
▲0.2
0.6
1.9
0.4
▲0.8
▲0.9
0.2
▲0.9
1.7
▲1.9
0.7 C Y
4.4
0.2
2019
2020
2021
0.0
▲0.3
▲8.8
▲1.1
0.9
▲11.6
▲1.2
▲3.5
▲0.6
0.5
▲38.1
6.9
▲5.3
▲18.4
▲0.9
0.2
▲0.4
0.1
0.4
3.6
▲0.7
▲0.8
▲1.5
0.9
▲0.3
0.8
▲1.2
1.3 F Y
3.9
▲0.2
2019
2020
2021
3.2
▲11.3
▲11.2
▲8.1
▲4.6
▲6.8
▲16.8
▲14.5
▲8.0
▲6.4
▲4.9
0.3
▲3.0
▲0.2
0.9
▲23.9
30.4
▲3.7
5.2
1.5
▲10.7
2.6
▲4.6
▲2.1
1.5
▲1.3
0.4
0.0
0.0
0.0
3.6
1.7
0.9
0.4
▲0.7
▲1.5
▲1.0
0.1
0.2
0.9
▲1.7
▲3.5
▲1.4
▲0.9
0.9
2.0
▲0.0
▲0.6
▲0.0
0.0
Q1
Q2
Q3
Q4
Q1
2021
▲1.3
▲0.4
2.1
▲8.0
▲23.0
▲3.9
▲19.0
▲10.8
▲2.0
▲9.7
▲10.8
▲5.8
▲5.6
▲2.4
▲2.9
▲7.4
▲14.5
▲11.8
▲16.0
▲21.8
▲14.6
▲18.2
▲10.2
▲7.9
▲6.5
▲9.2
▲8.8
▲8.7
▲1.4
▲0.2
▲9.5
▲3.0
8.5
▲0.1
▲6.8
▲0.9
▲5.1
▲3.1
1.7
▲1.5
▲0.5
2.4
▲0.6
0.7
0.8
▲25.5
▲6.7
75.2
40.1
▲3.3
12.6
▲9.8
▲14.7
1.1
7.2
7.3
0.0
4.6
0.5
18.8
▲9.3
1.9
16.6
0.2
▲8.5
▲8.4
▲3.1
▲1.7
0.3
▲1.3
▲3.6
4.8
▲0.4
0.1
4.5
▲3.1
▲0.3
0.7
0.7
0.0
0.0
0.0
0.0
0.0
0.0
0.0
▲0.3
0.4
0.0
0.0
1.5
3.6
3.3
2.5
1.7
1.7
0.5
0.9
1.0
0.7
0.4
0.2
▲0.2
▲0.7
▲0.4
▲0.9
▲1.5
▲1.1
▲1.1
▲1.0
0.0
▲0.0
0.1
0.1
0.1
0.2
0.3
0.3
0.9
1.0
▲2.3
▲5.6
▲3.4
▲3.6
▲3.5
▲0.9
▲2.8
▲0.5
▲0.0
▲1.0
▲1.3
▲0.5
1.4
2.1
1.0
0.0
▲0.0
0.0
▲0.0
▲0.0
1.9
▲1.8
0.0
2.0
▲0.0
▲0.0
▲0.0
2.1
0.0
▲0.0
Feb
Mar
Apr
May
Jun
Jul
Aug
Sep
Oct
Nov
Dec
Jan
Feb
Mar
Apr
2021
▲1.3
▲7.8
▲9.1
▲2.3
1.6
▲12.4
▲2.3
▲3.6
▲2.3
▲2.9
▲37.8
▲3.5
▲3.2
▲18.3
▲3.9
0.0
0.1
▲0.2
▲0.6
0.4
▲0.6
▲0.7
▲0.9
0.4
▲0.3
1.9
▲1.8
▲0.3 C Y
3.0
▲0.9
2019
2020
2021
▲4.2
▲4.7
▲10.4
▲0.6
▲1.9
▲11.6
▲2.1
▲4.8
▲0.9
▲3.8
▲41.3
5.5
▲4.3
▲18.6
▲0.6
0.3
▲0.5
0.1
▲1.6
2.8
▲1.8
▲0.9
▲1.0
0.8
0.2
0.8
▲1.0
0.3 F Y
2.3
▲1.1
2019
2020
2021
0.1
▲13.3
▲12.9
▲9.7
▲6.1
▲9.8
▲16.6
▲14.6
▲8.1
▲6.4
▲5.6
▲0.1
▲3.4
▲0.6
0.5
▲27.3
27.0
▲5.0
4.4
0.8
▲11.4
2.3
▲4.3
▲1.4
1.8
▲1.3
0.5
0.0
0.0
0.0
2.8
0.7
▲0.0
▲0.6
▲1.8
▲1.0
▲0.7
0.3
0.4
0.8
▲2.1
▲3.3
▲1.2
▲0.6
1.2
0.0
▲1.3
▲1.2
▲1.2
▲0.6
Q1
Q2
Q3
Q4
Q1
2021
▲3.8
▲2.2
▲0.4
▲9.9
▲24.8
▲5.6
▲20.3
▲12.7
▲3.8
▲11.3
▲12.3
▲7.1
▲7.0
▲4.0
▲4.7
▲12.6
▲14.1
▲11.6
▲15.6
▲21.7
▲14.6
▲18.2
▲10.5
▲8.1
▲6.6
▲9.2
▲8.7
▲8.8
▲1.7
▲0.6
▲10.5
▲3.1
8.2
▲0.5
▲7.1
▲1.2
▲5.3
▲3.5
1.1
▲2.0
▲0.8
2.0
▲0.8
0.2
0.3
▲29.7
▲9.4
70.8
36.3
▲5.8
9.9
▲9.8
▲15.8
0.1
6.5
6.6
▲0.8
3.8
▲0.1
18.5
▲9.9
1.0
16.0
▲0.4
▲8.5
▲8.6
▲2.7
▲1.1
0.8
▲0.4
▲2.9
5.5
0.0
0.0
4.2
▲3.3
▲0.3
0.7
0.7
0.1
0.0
▲0.1
0.2
0.0
0.0
0.1
▲0.1
0.1
0.1
0.0
0.2
2.8
2.3
1.5
0.7
0.8
▲0.4
▲0.0
▲0.1
▲0.3
▲0.6
▲0.8
▲1.2
▲1.8
▲1.5
▲0.9
▲1.0
▲0.9
▲0.8
▲0.7
0.3
0.3
0.3
0.3
0.4
0.4
0.4
0.5
0.8
0.9
▲2.8
▲5.4
▲3.2
▲3.4
▲3.2
▲0.6
▲2.6
▲0.3
0.2
▲0.8
▲1.0
▲0.2
1.6
2.3
1.2
▲2.1
▲1.9
▲0.0
▲0.0
▲1.9
▲0.0
▲1.8
▲0.0
▲0.0
▲1.9
▲3.1
▲1.9
▲0.0
▲0.0
▲0.0
Feb
Mar
Apr
May
Jun
Jul
Aug
Sep
Oct
Nov
Dec
Jan
Feb
Mar
Apr
2021
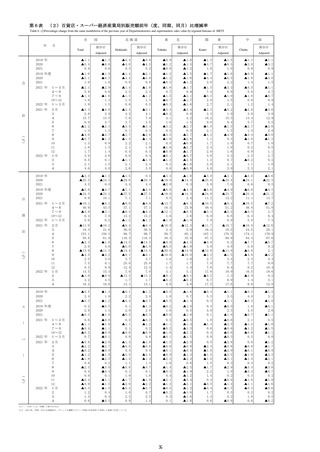
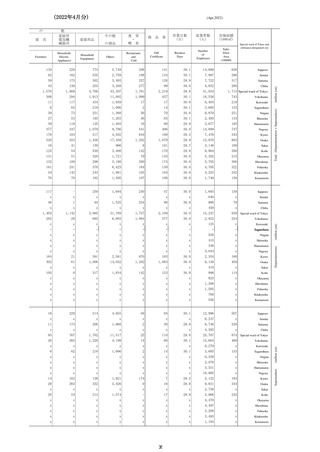
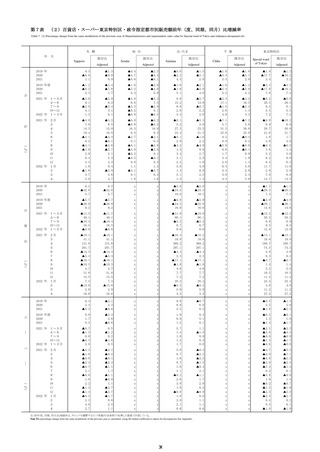
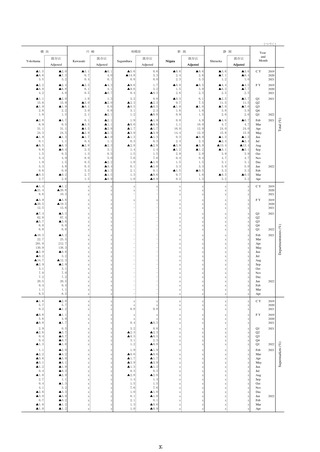
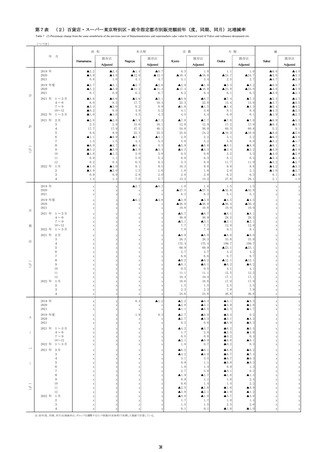
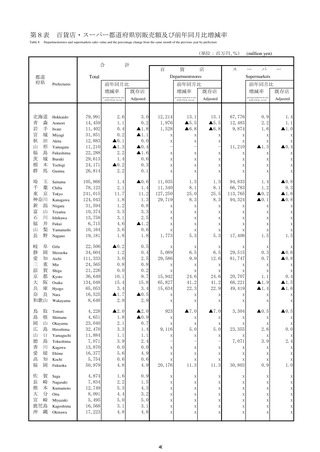
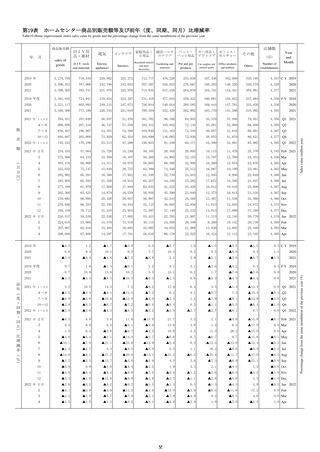
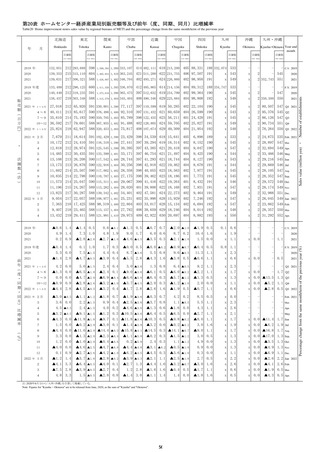
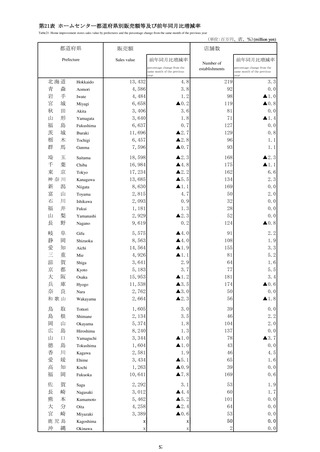
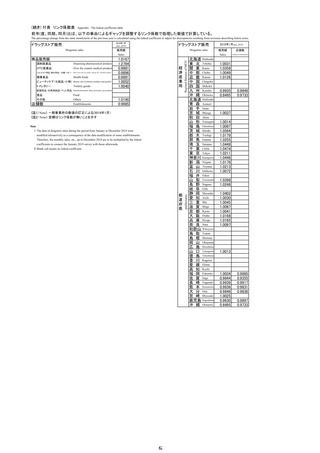
Note1 Yearly and quarterly data of number of establishments, number of employees and sales floor area are calculated at the end of term.
Note2 Yearly and quarterly data of sales per employee and sales per floor area (㎡) are average of that term.
Note3:Growth rates of number of establishments that showed at "Percentage change from the same month/term of the previous year after number of establisments have been adjusted " column are calculated by figures that showed "sales value" column.
Note4 Sales per ㎡ are calculated excluding sales value of restaurant and café.
Note5: The percentage change from the same month/term of the previous year is calculated using the linked coefficient to adjust for discrepancies.Refer to the Appendix table.
27
2022
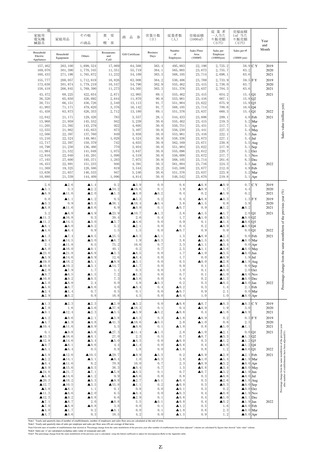
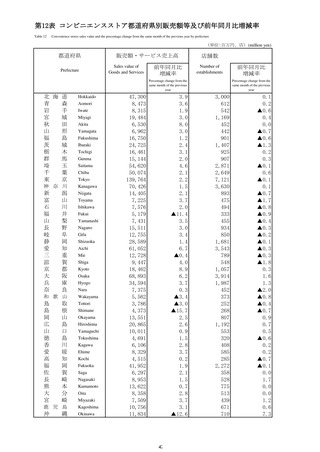
Sales value (million yen)
その他
2022
2022
2022
2022
2022
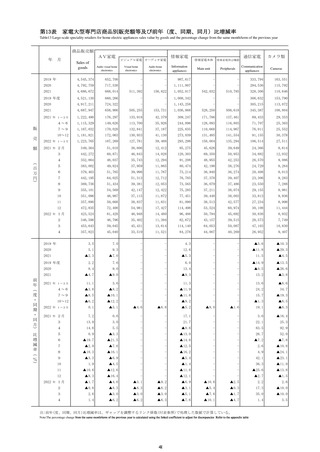
Percentage change from the same month/term of the previous year (%)
家庭用品
Percentage change from the same month/term of the previous year
after number of establishments have been adjusted(%).
他
家庭用
電気機
械器具
Electric
Appliances
Household
Equipment
食
堂
・
の商品
Others
喫
商
品
券
営業日数
(日)
従業者数
(人)
売場面積
(1000㎡)
従 業 者
一人当た
り販売額
(万円)
売場面積
1㎡ 当た
り販売額
(万円)
Business
Days
Number
of
Employees
Sales Floor
Area
(1000㎡)
Sales per
Employee
(10000yen)
(10000 yen)
茶
Restaurants
and
Café
Gift Certificate
Year
and
Month
Sales per ㎡
157,462
169,078
160,433
263,100
301,390
271,198
1,699,524
1,778,345
1,765,672
17,069
11,351
11,232
64,568
55,719
54,109
363.4
364.1
363.3
495,883
565,905
568,105
22,198
23,673
23,714
2,725.2
2,755.7
2,698.1
58.9 C Y
63.2
63.6
2019
2020
2021
155,777
173,638
158,418
268,057
301,874
266,845
1,712,619
1,779,219
1,769,390
16,826
10,547
11,273
63,008
54,790
54,305
364.2
362.9
363.3
536,406
555,462
551,376
23,769
23,415
23,637
2,733.9
2,738.0
2,704.3
59.5 F Y
63.7
63.6
2019
2020
2021
43,472
36,326
38,731
41,903
41,458
68,225
65,650
66,151
71,171
63,873
422,634
426,692
436,726
479,620
426,353
2,671
2,644
2,540
3,376
2,712
12,985
11,870
13,113
16,142
13,180
89.1
90.8
91.7
91.7
89.1
555,462
553,981
551,904
568,105
551,376
23,415
23,416
23,622
23,714
23,637
654.2
667.1
675.9
700.6
660.3
15.4
15.8
15.9
16.6
15.4
Q1
Q2
Q3
Q4
Q1
2021
12,042
13,968
11,205
12,555
12,566
15,216
12,717
10,798
11,984
12,816
17,103
16,453
11,369
13,636
10,880
21,171
21,959
21,392
21,862
22,397
22,524
22,397
21,230
21,532
22,040
27,600
22,891
19,325
21,657
21,339
129,426
145,552
143,279
145,653
137,760
149,861
150,379
136,486
141,048
145,201
193,371
151,233
128,586
146,533
144,409
783
942
922
873
849
1,028
742
770
1,075
1,098
1,203
946
819
947
1,096
3,557
5,239
4,605
3,407
3,858
4,524
4,655
3,934
3,647
4,519
7,975
4,391
3,544
5,246
4,814
28.1
30.6
30.0
30.8
30.0
30.8
30.9
30.0
30.8
30.0
30.9
30.3
28.2
30.6
30.0
544,433
555,462
550,751
556,230
553,981
558,336
562,169
551,904
555,096
556,008
568,105
561,804
543,508
551,376
548,542
23,606
23,415
23,431
23,441
23,416
23,673
23,671
23,622
23,612
23,672
23,714
23,716
23,677
23,637
23,670
209.1
219.3
217.7
227.3
222.1
227.1
230.8
217.9
220.7
217.7
261.6
224.3
212.0
223.8
219.8
4.8
5.2
5.1
5.4
5.3
5.4
5.5
5.1
5.2
5.1
6.3
5.3
4.9
5.2
5.1
Feb
Mar
Apr
May
Jun
Jul
Aug
Sep
Oct
Nov
Dec
Jan
Feb
Mar
Apr
2021
2.6
▲3.1
▲6.9
▲2.6
3.3
▲11.6
▲1.4
▲2.2
▲2.0
0.2
▲34.2
▲1.3
▲3.9
▲18.6
▲4.0
0.0
0.1
▲0.2
0.6
1.9
0.4
▲0.8
▲0.9
0.2
▲0.9
1.7
▲1.9
0.7 C Y
4.4
0.2
2019
2020
2021
0.0
▲0.3
▲8.8
▲1.1
0.9
▲11.6
▲1.2
▲3.5
▲0.6
0.5
▲38.1
6.9
▲5.3
▲18.4
▲0.9
0.2
▲0.4
0.1
0.4
3.6
▲0.7
▲0.8
▲1.5
0.9
▲0.3
0.8
▲1.2
1.3 F Y
3.9
▲0.2
2019
2020
2021
3.2
▲11.3
▲11.2
▲8.1
▲4.6
▲6.8
▲16.8
▲14.5
▲8.0
▲6.4
▲4.9
0.3
▲3.0
▲0.2
0.9
▲23.9
30.4
▲3.7
5.2
1.5
▲10.7
2.6
▲4.6
▲2.1
1.5
▲1.3
0.4
0.0
0.0
0.0
3.6
1.7
0.9
0.4
▲0.7
▲1.5
▲1.0
0.1
0.2
0.9
▲1.7
▲3.5
▲1.4
▲0.9
0.9
2.0
▲0.0
▲0.6
▲0.0
0.0
Q1
Q2
Q3
Q4
Q1
2021
▲1.3
▲0.4
2.1
▲8.0
▲23.0
▲3.9
▲19.0
▲10.8
▲2.0
▲9.7
▲10.8
▲5.8
▲5.6
▲2.4
▲2.9
▲7.4
▲14.5
▲11.8
▲16.0
▲21.8
▲14.6
▲18.2
▲10.2
▲7.9
▲6.5
▲9.2
▲8.8
▲8.7
▲1.4
▲0.2
▲9.5
▲3.0
8.5
▲0.1
▲6.8
▲0.9
▲5.1
▲3.1
1.7
▲1.5
▲0.5
2.4
▲0.6
0.7
0.8
▲25.5
▲6.7
75.2
40.1
▲3.3
12.6
▲9.8
▲14.7
1.1
7.2
7.3
0.0
4.6
0.5
18.8
▲9.3
1.9
16.6
0.2
▲8.5
▲8.4
▲3.1
▲1.7
0.3
▲1.3
▲3.6
4.8
▲0.4
0.1
4.5
▲3.1
▲0.3
0.7
0.7
0.0
0.0
0.0
0.0
0.0
0.0
0.0
▲0.3
0.4
0.0
0.0
1.5
3.6
3.3
2.5
1.7
1.7
0.5
0.9
1.0
0.7
0.4
0.2
▲0.2
▲0.7
▲0.4
▲0.9
▲1.5
▲1.1
▲1.1
▲1.0
0.0
▲0.0
0.1
0.1
0.1
0.2
0.3
0.3
0.9
1.0
▲2.3
▲5.6
▲3.4
▲3.6
▲3.5
▲0.9
▲2.8
▲0.5
▲0.0
▲1.0
▲1.3
▲0.5
1.4
2.1
1.0
0.0
▲0.0
0.0
▲0.0
▲0.0
1.9
▲1.8
0.0
2.0
▲0.0
▲0.0
▲0.0
2.1
0.0
▲0.0
Feb
Mar
Apr
May
Jun
Jul
Aug
Sep
Oct
Nov
Dec
Jan
Feb
Mar
Apr
2021
▲1.3
▲7.8
▲9.1
▲2.3
1.6
▲12.4
▲2.3
▲3.6
▲2.3
▲2.9
▲37.8
▲3.5
▲3.2
▲18.3
▲3.9
0.0
0.1
▲0.2
▲0.6
0.4
▲0.6
▲0.7
▲0.9
0.4
▲0.3
1.9
▲1.8
▲0.3 C Y
3.0
▲0.9
2019
2020
2021
▲4.2
▲4.7
▲10.4
▲0.6
▲1.9
▲11.6
▲2.1
▲4.8
▲0.9
▲3.8
▲41.3
5.5
▲4.3
▲18.6
▲0.6
0.3
▲0.5
0.1
▲1.6
2.8
▲1.8
▲0.9
▲1.0
0.8
0.2
0.8
▲1.0
0.3 F Y
2.3
▲1.1
2019
2020
2021
0.1
▲13.3
▲12.9
▲9.7
▲6.1
▲9.8
▲16.6
▲14.6
▲8.1
▲6.4
▲5.6
▲0.1
▲3.4
▲0.6
0.5
▲27.3
27.0
▲5.0
4.4
0.8
▲11.4
2.3
▲4.3
▲1.4
1.8
▲1.3
0.5
0.0
0.0
0.0
2.8
0.7
▲0.0
▲0.6
▲1.8
▲1.0
▲0.7
0.3
0.4
0.8
▲2.1
▲3.3
▲1.2
▲0.6
1.2
0.0
▲1.3
▲1.2
▲1.2
▲0.6
Q1
Q2
Q3
Q4
Q1
2021
▲3.8
▲2.2
▲0.4
▲9.9
▲24.8
▲5.6
▲20.3
▲12.7
▲3.8
▲11.3
▲12.3
▲7.1
▲7.0
▲4.0
▲4.7
▲12.6
▲14.1
▲11.6
▲15.6
▲21.7
▲14.6
▲18.2
▲10.5
▲8.1
▲6.6
▲9.2
▲8.7
▲8.8
▲1.7
▲0.6
▲10.5
▲3.1
8.2
▲0.5
▲7.1
▲1.2
▲5.3
▲3.5
1.1
▲2.0
▲0.8
2.0
▲0.8
0.2
0.3
▲29.7
▲9.4
70.8
36.3
▲5.8
9.9
▲9.8
▲15.8
0.1
6.5
6.6
▲0.8
3.8
▲0.1
18.5
▲9.9
1.0
16.0
▲0.4
▲8.5
▲8.6
▲2.7
▲1.1
0.8
▲0.4
▲2.9
5.5
0.0
0.0
4.2
▲3.3
▲0.3
0.7
0.7
0.1
0.0
▲0.1
0.2
0.0
0.0
0.1
▲0.1
0.1
0.1
0.0
0.2
2.8
2.3
1.5
0.7
0.8
▲0.4
▲0.0
▲0.1
▲0.3
▲0.6
▲0.8
▲1.2
▲1.8
▲1.5
▲0.9
▲1.0
▲0.9
▲0.8
▲0.7
0.3
0.3
0.3
0.3
0.4
0.4
0.4
0.5
0.8
0.9
▲2.8
▲5.4
▲3.2
▲3.4
▲3.2
▲0.6
▲2.6
▲0.3
0.2
▲0.8
▲1.0
▲0.2
1.6
2.3
1.2
▲2.1
▲1.9
▲0.0
▲0.0
▲1.9
▲0.0
▲1.8
▲0.0
▲0.0
▲1.9
▲3.1
▲1.9
▲0.0
▲0.0
▲0.0
Feb
Mar
Apr
May
Jun
Jul
Aug
Sep
Oct
Nov
Dec
Jan
Feb
Mar
Apr
2021
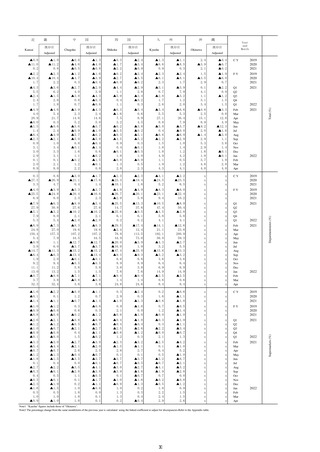
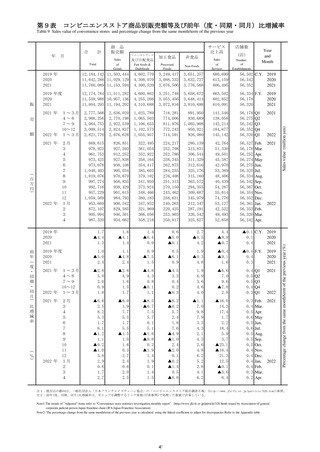
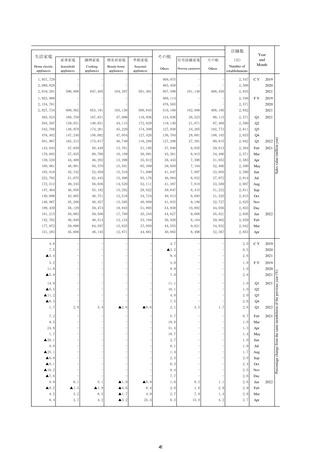
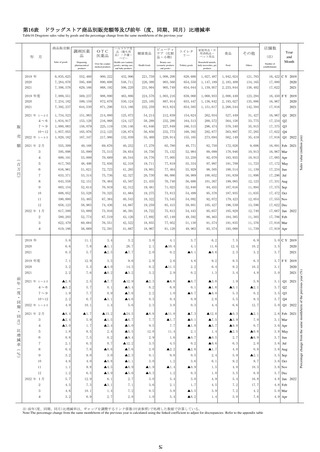
Note1 Yearly and quarterly data of number of establishments, number of employees and sales floor area are calculated at the end of term.
Note2 Yearly and quarterly data of sales per employee and sales per floor area (㎡) are average of that term.
Note3:Growth rates of number of establishments that showed at "Percentage change from the same month/term of the previous year after number of establisments have been adjusted " column are calculated by figures that showed "sales value" column.
Note4 Sales per ㎡ are calculated excluding sales value of restaurant and café.
Note5: The percentage change from the same month/term of the previous year is calculated using the linked coefficient to adjust for discrepancies.Refer to the Appendix table.
27
2022
Sales value (million yen)
その他
2022
2022
2022
2022
2022
Percentage change from the same month/term of the previous year (%)
家庭用品
Percentage change from the same month/term of the previous year
after number of establishments have been adjusted(%).
他
家庭用
電気機
械器具