

よむ、つかう、まなぶ。
商業動態統計速報 2022年4月分 (45 ページ)
出典
| 公開元URL | https://www.meti.go.jp/statistics/tyo/syoudou/result/sokuho_2.html |
| 出典情報 | 商業動態統計速報 2022年4月分(5/31)《経済産業省》 |
ページ画像
ダウンロードした画像を利用する際は「出典情報」を明記してください。
低解像度画像をダウンロード
プレーンテキスト
資料テキストはコンピュータによる自動処理で生成されており、完全に資料と一致しない場合があります。
テキストをコピーしてご利用いただく際は資料と付け合わせてご確認ください。
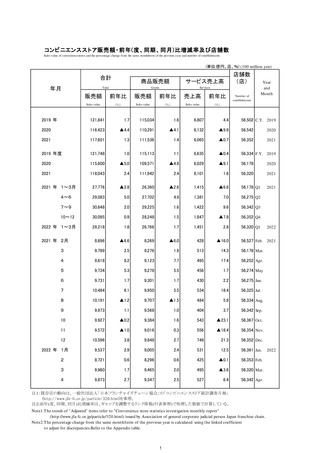
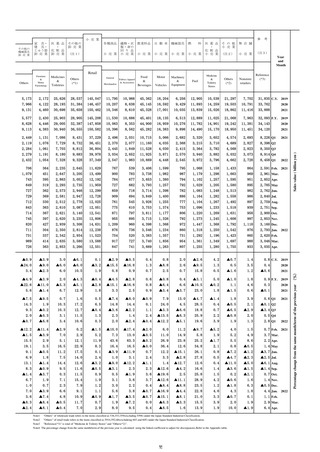
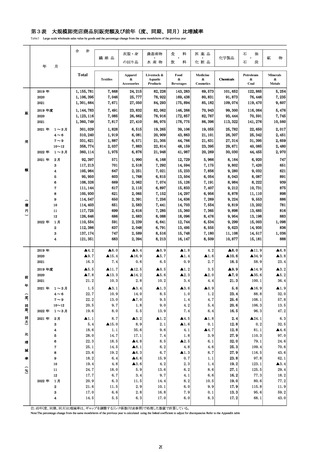
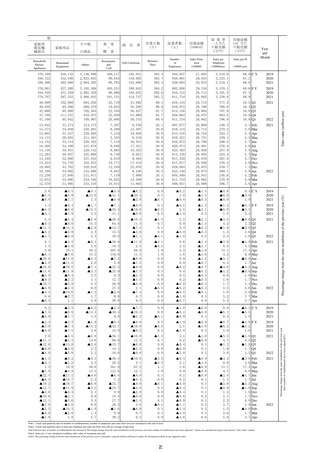
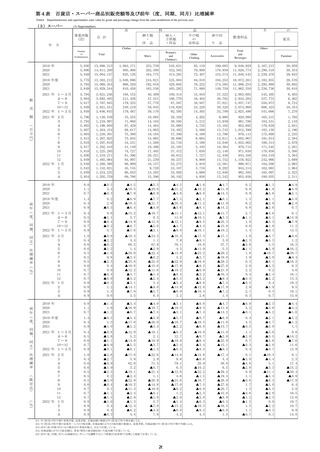
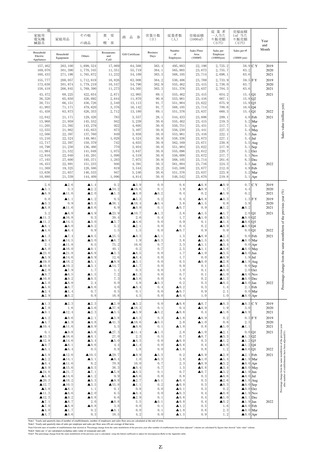
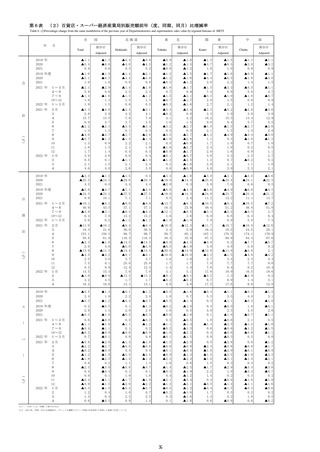
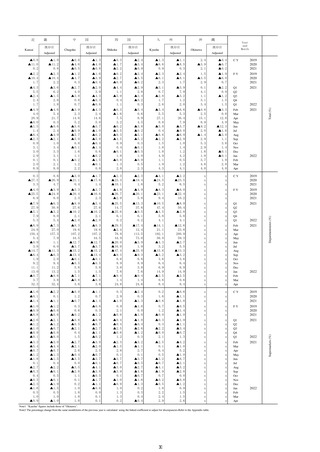
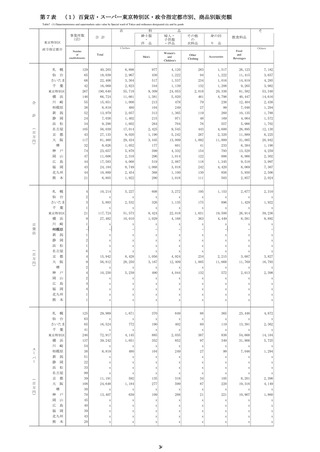
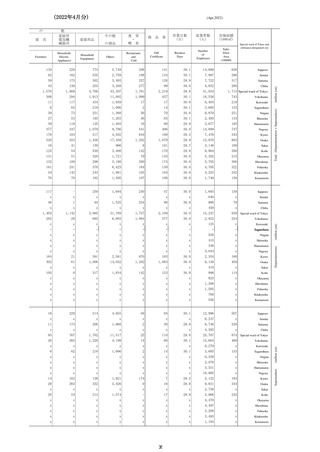
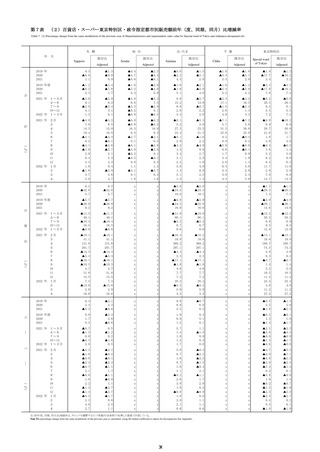
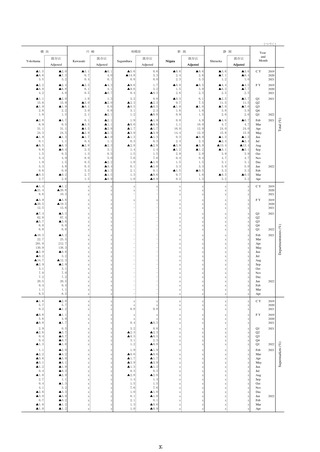
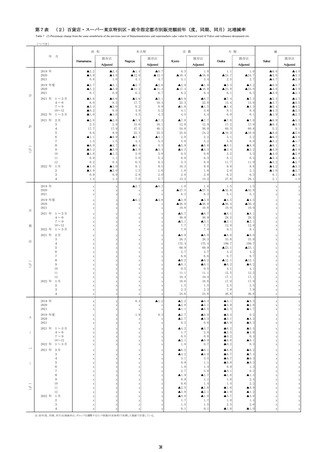
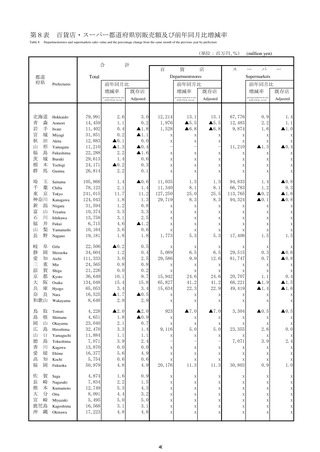
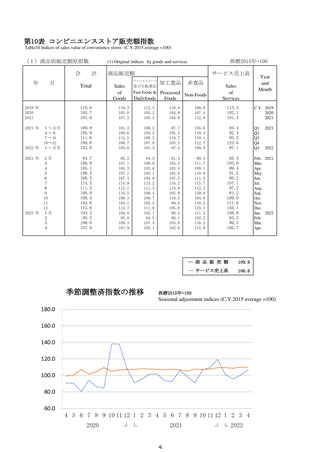
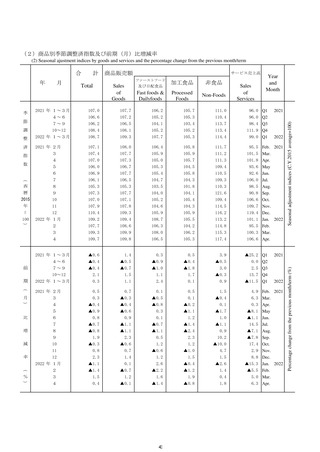
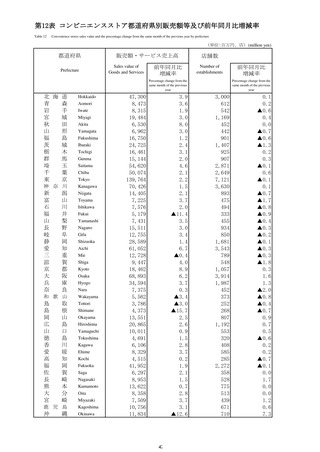
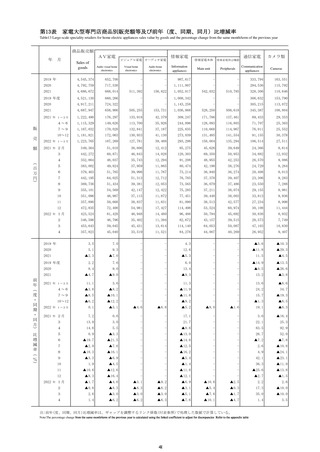
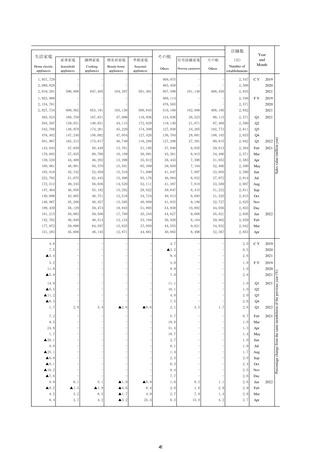
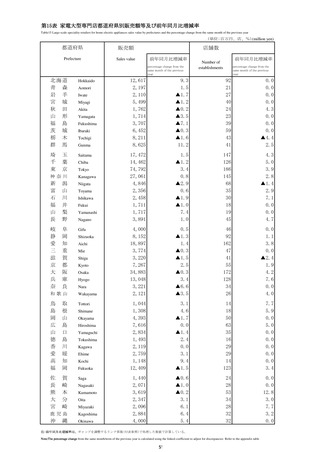
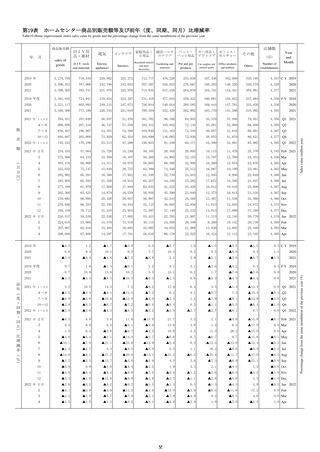
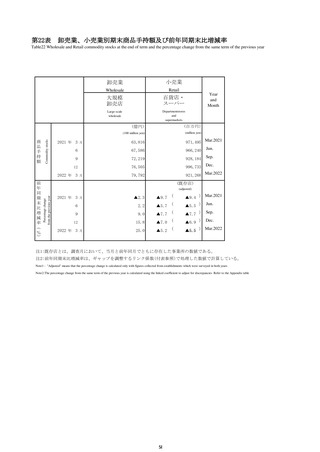
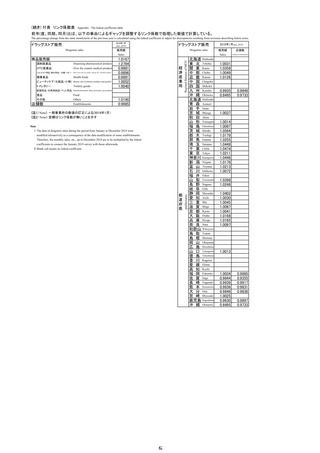
第11表
コンビニエンスストア経済産業局別販売額等及び前年(度・同期・同月)比増減率
Table 11 Sales value of convenience stores by regional bureaus of METI and the percentage change from the same month/term of the previous year
2019 年
2020
2021
2019 年度
販
売
額
(
百
万
円
)
2020
2021
2021 年 1~3月
4~6
7~9
10~12
2022 年 1~3月
2021 年 2月
3
・
4
5
店
舗
数
6
7
8
(
9
店
10
)
11
12
2022 年 1月
2
3
4
2019 年
2020
2021
前
年
(
度
・
同
期
・
同
月
)
比
増
減
率
2019 年度
2020
2021
2021 年 1~3月
4~6
7~9
10~12
2022 年 1~3月
2021 年 2月
3
4
5
6
7
8
9
(
%
)
10
11
12
2022 年 1月
2
3
4
関東
Kanto
中部
Chubu
近畿
Kansai
店舗数
店舗数
店舗数
店舗数
店舗数
Establishments
Establishments
Establishments
Estab ishments
Estab ishments
Year
and
Month
582,578
565,689
569,353
3,007
2,999
3,003
825,895
795,357
795,777
4,108 5,416,537
4,115 5,166,887
4,127 5,208,203
23,614 1,247,910
23,601 1,184,803
23,464 1,194,563
6,183 1,835,429
6,199 1,735,218
6,166 1,762,099
8,667 C Y 2019
8,630
2020
8,679
2021
582,414
562,664
573,792
2,993
2,998
3,001
824,358
792,039
796,344
4,101 5,421,460
4,121 5,120,159
4,119 5,228,399
23,533 1,242,217
23,498 1,175,076
23,468 1,198,942
6,177 1,829,723
6,176 1,724,713
6,153 1,771,466
8,618 F Y 2019
8,592
2020
8,655
2021
131,730
139,737
153,686
144,200
136,169
2,998
3,002
3,005
3,003
3,001
188,287
197,369
208,787
201,334
188,854
4,121
4,123
4,132
4,127
4,119
1,230,897
1,295,529
1,356,609
1,325,168
1,251,093
23,498
23,494
23,500
23,464
23,468
281,171
292,770
312,207
308,415
285,550
6,176
6,179
6,177
6,166
6,153
415,649
431,815
459,343
455,292
425,016
8,592
8,594
8,635
8,679
8,655
Q1
Q1
2022
41,238
46,034
45,542
46,516
47,679
52,550
51,299
49,837
47,553
45,687
50,960
46,133
42,612
47,424
47,300
2,999
2,998
2,998
2,999
3,002
3,004
3,007
3,005
3,004
3,000
3,003
3,004
2,999
3,001
3,000
59,148
65,834
64,617
66,260
66,492
71,377
69,818
67,592
66,518
64,159
70,657
64,362
58,442
66,050
66,514
4,120
4,121
4,123
4,127
4,123
4,132
4,133
4,132
4,137
4,132
4,127
4,125
4,123
4,119
4,118
384,260
434,917
426,890
434,482
434,157
462,178
452,403
442,028
438,194
423,510
463,464
420,189
388,020
442,884
437,150
23,615
23,498
23,492
23,496
23,494
23,512
23,508
23,500
23,495
23,479
23,464
23,467
23,480
23,468
23,473
88,634
98,755
96,710
98,238
97,822
107,863
103,666
100,678
102,052
96,991
109,372
97,125
87,963
100,462
101,336
6,196
6,176
6,179
6,176
6,179
6,178
6,181
6,177
6,176
6,171
6,166
6,160
6,164
6,153
6,151
130,288
147,228
143,257
143,559
144,999
156,579
152,248
150,516
149,502
143,800
161,990
143,760
130,623
150,633
149,512
8,631
8,592
8,601
8,596
8,594
8,601
8,613
8,635
8,654
8,666
8,679
8,679
8,667
8,655
8,664
Feb
2021
2.0
▲2.9
0.6
▲0.4
▲0.3
0.1
0.9
▲3.7
0.1
0.2
0.2
0.3
1.6
▲4.6
0.9
▲0.1
▲0.1
▲0.0
0.9
▲5.1
0.9
▲0.6
0.3
▲0.1
2.6
▲5.5
1.7
▲0.5 C Y 2019
▲0.4
2020
1.1
2021
1.6
▲3.4
2.0
▲0.6
0.2
0.1
0.4
▲3.9
0.5
▲0.2
0.5
▲0.0
1.2
▲5.5
2.3
▲0.5
0.4
▲0.1
▲0.1
▲5.4
2.2
▲0.8
0.4
▲0.4
1.4
▲5.7
2.9
▲0.9 F Y 2019
0.2
2020
0.7
2021
▲2.2
2.3
1.5
0.9
3.4
0.2
0.2
0.2
0.1
0.1
▲1.7
2.6
0.0
▲0.7
0.3
0.5
0.5
0.6
0.3
▲0.0
▲3.6
4.8
1.6
1.1
1.7
0.4
0.3
0.3
▲0.0
▲0.1
▲3.3
3.7
3.0
0.4
1.6
0.4
0.3
0.1
▲0.1
▲0.4
▲2.4
5.6
3.1
0.7
2.4
0.2
0.4
0.7
1.1
0.7
Q1
Q1
2022
▲6.7
3.5
4.5
1.9
0.5
4.8
▲0.3
▲0.1
▲0.4
0.3
2.9
3.8
3.3
3.0
3.9
0.1
0.2
0.1
0.2
0.2
0.4
0.3
0.2
0.2
0.1
0.1
0.1
0.0
0.1
0.1
▲4.8
1.8
6.1
2.8
▲0.7
4.2
▲3.3
▲0.6
▲2.4
▲1.1
1.4
1.7
▲1.2
0.3
2.9
0.5
0.5
0.4
0.7
0.5
0.6
0.7
0.6
0.7
0.5
0.3
0.2
0.1
▲0.0
▲0.1
▲7.7
1.3
7.5
5.3
1.7
5.6
▲1.6
0.9
0.4
▲0.2
2.9
2.2
1.1
1.8
2.4
0.2
0.4
0.3
0.4
0.3
0.4
0.3
0.3
0.2
0.0
▲0.0
▲0.0
▲0.0
▲0.1
▲0.1
▲6.4
1.4
6.2
4.0
1.1
8.3
▲0.2
0.9
▲2.6
▲1.9
5.5
3.7
▲0.6
1.7
4.8
0.3
0.4
0.4
0.4
0.3
0.2
0.1
0.1
0.1
0.0
▲0.1
▲0.2
▲0.1
▲0.4
▲0.5
▲5.9
4.2
9.1
5.3
2.6
7.0
0.1
2.3
▲1.8
▲2.7
6.4
4.3
0.4
2.3
4.4
0.1
0.2
0.3
0.4
0.4
0.5
0.5
0.7
0.8
0.9
1.1
1.0
0.9
0.7
0.7
Feb
2021
注1:2016年9月分から「九州・沖縄」を合算して掲載している。
注2:前年(度、同期、同月)比増減率は、ギャップを調整するリンク係数(付表参照)で処理した数値で計算している。
Note1: Figures for "Kyushu・Okinawa" are to be released from September, 2016, as the sum of "Kyushu" and "Okinawa”
Note2: The percentage change from the same month/term of the previous year is calculated using the linked coefficient to adjust for discrepancies Refer to the Appendix table
45
2021
Q2
Q3
Q4
Mar
Apr
May
Jun
Jul
Aug
Sep
Oct
Sales value (million yen) ・ Number of establishments
月
東北
Tohoku
Nov
Dec
Jan
2022
Feb
Mar
Apr
2021
Q2
Q3
Q4
Mar
Apr
May
Jun
Jul
Aug
Sep
Oct
Nov
Dec
Jan
Feb
Mar
Apr
2022
Percentage change from the same month/term of the previous year (%)
年
北海道
Hokkaido
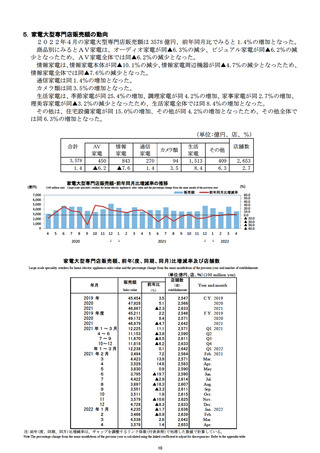
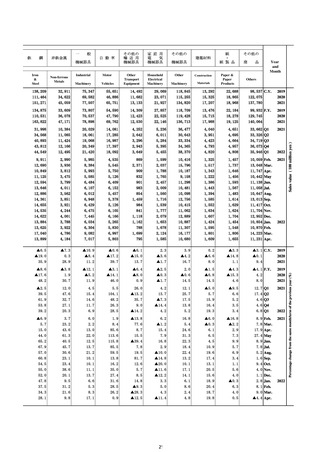
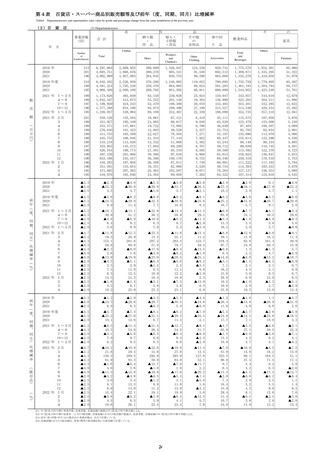
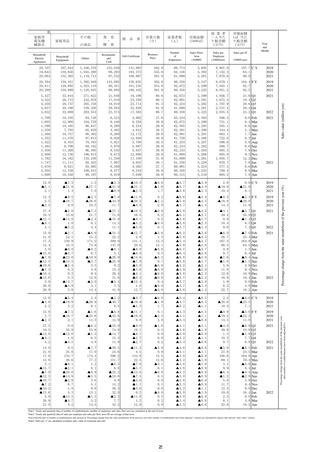
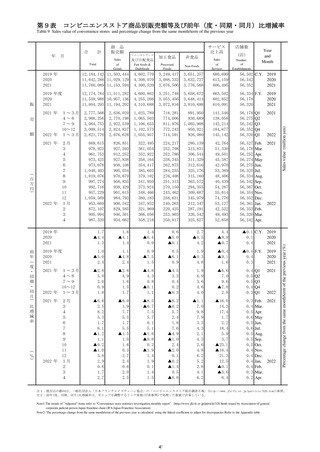
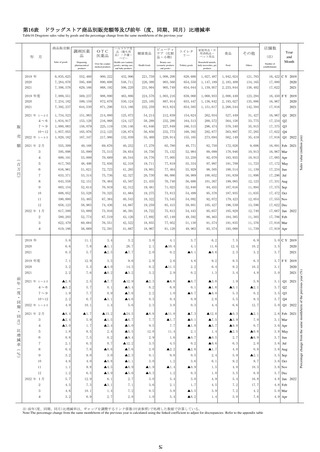
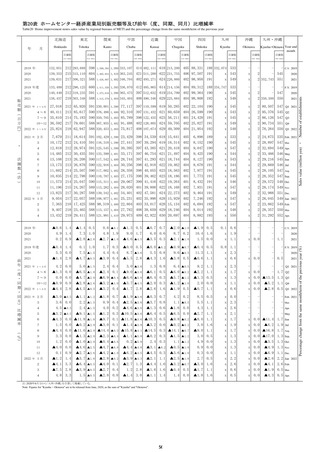
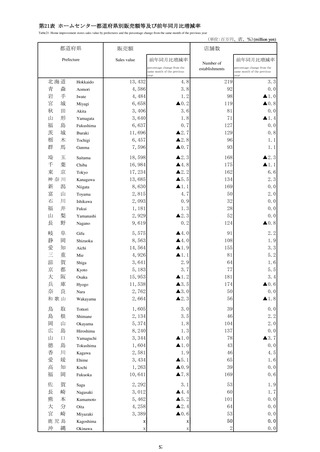
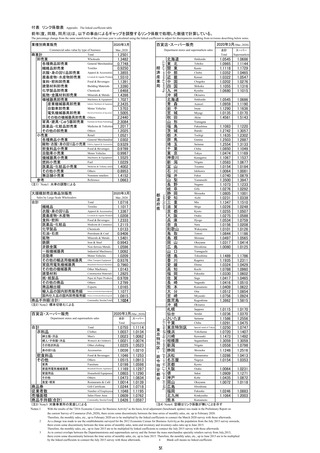
コンビニエンスストア経済産業局別販売額等及び前年(度・同期・同月)比増減率
Table 11 Sales value of convenience stores by regional bureaus of METI and the percentage change from the same month/term of the previous year
2019 年
2020
2021
2019 年度
販
売
額
(
百
万
円
)
2020
2021
2021 年 1~3月
4~6
7~9
10~12
2022 年 1~3月
2021 年 2月
3
・
4
5
店
舗
数
6
7
8
(
9
店
10
)
11
12
2022 年 1月
2
3
4
2019 年
2020
2021
前
年
(
度
・
同
期
・
同
月
)
比
増
減
率
2019 年度
2020
2021
2021 年 1~3月
4~6
7~9
10~12
2022 年 1~3月
2021 年 2月
3
4
5
6
7
8
9
(
%
)
10
11
12
2022 年 1月
2
3
4
関東
Kanto
中部
Chubu
近畿
Kansai
店舗数
店舗数
店舗数
店舗数
店舗数
Establishments
Establishments
Establishments
Estab ishments
Estab ishments
Year
and
Month
582,578
565,689
569,353
3,007
2,999
3,003
825,895
795,357
795,777
4,108 5,416,537
4,115 5,166,887
4,127 5,208,203
23,614 1,247,910
23,601 1,184,803
23,464 1,194,563
6,183 1,835,429
6,199 1,735,218
6,166 1,762,099
8,667 C Y 2019
8,630
2020
8,679
2021
582,414
562,664
573,792
2,993
2,998
3,001
824,358
792,039
796,344
4,101 5,421,460
4,121 5,120,159
4,119 5,228,399
23,533 1,242,217
23,498 1,175,076
23,468 1,198,942
6,177 1,829,723
6,176 1,724,713
6,153 1,771,466
8,618 F Y 2019
8,592
2020
8,655
2021
131,730
139,737
153,686
144,200
136,169
2,998
3,002
3,005
3,003
3,001
188,287
197,369
208,787
201,334
188,854
4,121
4,123
4,132
4,127
4,119
1,230,897
1,295,529
1,356,609
1,325,168
1,251,093
23,498
23,494
23,500
23,464
23,468
281,171
292,770
312,207
308,415
285,550
6,176
6,179
6,177
6,166
6,153
415,649
431,815
459,343
455,292
425,016
8,592
8,594
8,635
8,679
8,655
Q1
Q1
2022
41,238
46,034
45,542
46,516
47,679
52,550
51,299
49,837
47,553
45,687
50,960
46,133
42,612
47,424
47,300
2,999
2,998
2,998
2,999
3,002
3,004
3,007
3,005
3,004
3,000
3,003
3,004
2,999
3,001
3,000
59,148
65,834
64,617
66,260
66,492
71,377
69,818
67,592
66,518
64,159
70,657
64,362
58,442
66,050
66,514
4,120
4,121
4,123
4,127
4,123
4,132
4,133
4,132
4,137
4,132
4,127
4,125
4,123
4,119
4,118
384,260
434,917
426,890
434,482
434,157
462,178
452,403
442,028
438,194
423,510
463,464
420,189
388,020
442,884
437,150
23,615
23,498
23,492
23,496
23,494
23,512
23,508
23,500
23,495
23,479
23,464
23,467
23,480
23,468
23,473
88,634
98,755
96,710
98,238
97,822
107,863
103,666
100,678
102,052
96,991
109,372
97,125
87,963
100,462
101,336
6,196
6,176
6,179
6,176
6,179
6,178
6,181
6,177
6,176
6,171
6,166
6,160
6,164
6,153
6,151
130,288
147,228
143,257
143,559
144,999
156,579
152,248
150,516
149,502
143,800
161,990
143,760
130,623
150,633
149,512
8,631
8,592
8,601
8,596
8,594
8,601
8,613
8,635
8,654
8,666
8,679
8,679
8,667
8,655
8,664
Feb
2021
2.0
▲2.9
0.6
▲0.4
▲0.3
0.1
0.9
▲3.7
0.1
0.2
0.2
0.3
1.6
▲4.6
0.9
▲0.1
▲0.1
▲0.0
0.9
▲5.1
0.9
▲0.6
0.3
▲0.1
2.6
▲5.5
1.7
▲0.5 C Y 2019
▲0.4
2020
1.1
2021
1.6
▲3.4
2.0
▲0.6
0.2
0.1
0.4
▲3.9
0.5
▲0.2
0.5
▲0.0
1.2
▲5.5
2.3
▲0.5
0.4
▲0.1
▲0.1
▲5.4
2.2
▲0.8
0.4
▲0.4
1.4
▲5.7
2.9
▲0.9 F Y 2019
0.2
2020
0.7
2021
▲2.2
2.3
1.5
0.9
3.4
0.2
0.2
0.2
0.1
0.1
▲1.7
2.6
0.0
▲0.7
0.3
0.5
0.5
0.6
0.3
▲0.0
▲3.6
4.8
1.6
1.1
1.7
0.4
0.3
0.3
▲0.0
▲0.1
▲3.3
3.7
3.0
0.4
1.6
0.4
0.3
0.1
▲0.1
▲0.4
▲2.4
5.6
3.1
0.7
2.4
0.2
0.4
0.7
1.1
0.7
Q1
Q1
2022
▲6.7
3.5
4.5
1.9
0.5
4.8
▲0.3
▲0.1
▲0.4
0.3
2.9
3.8
3.3
3.0
3.9
0.1
0.2
0.1
0.2
0.2
0.4
0.3
0.2
0.2
0.1
0.1
0.1
0.0
0.1
0.1
▲4.8
1.8
6.1
2.8
▲0.7
4.2
▲3.3
▲0.6
▲2.4
▲1.1
1.4
1.7
▲1.2
0.3
2.9
0.5
0.5
0.4
0.7
0.5
0.6
0.7
0.6
0.7
0.5
0.3
0.2
0.1
▲0.0
▲0.1
▲7.7
1.3
7.5
5.3
1.7
5.6
▲1.6
0.9
0.4
▲0.2
2.9
2.2
1.1
1.8
2.4
0.2
0.4
0.3
0.4
0.3
0.4
0.3
0.3
0.2
0.0
▲0.0
▲0.0
▲0.0
▲0.1
▲0.1
▲6.4
1.4
6.2
4.0
1.1
8.3
▲0.2
0.9
▲2.6
▲1.9
5.5
3.7
▲0.6
1.7
4.8
0.3
0.4
0.4
0.4
0.3
0.2
0.1
0.1
0.1
0.0
▲0.1
▲0.2
▲0.1
▲0.4
▲0.5
▲5.9
4.2
9.1
5.3
2.6
7.0
0.1
2.3
▲1.8
▲2.7
6.4
4.3
0.4
2.3
4.4
0.1
0.2
0.3
0.4
0.4
0.5
0.5
0.7
0.8
0.9
1.1
1.0
0.9
0.7
0.7
Feb
2021
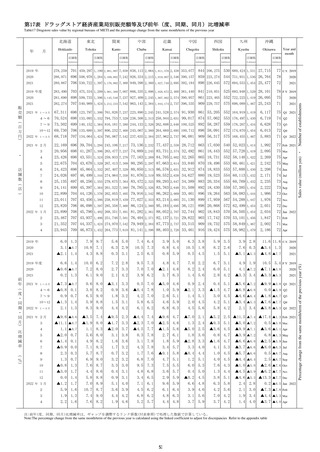
注1:2016年9月分から「九州・沖縄」を合算して掲載している。
注2:前年(度、同期、同月)比増減率は、ギャップを調整するリンク係数(付表参照)で処理した数値で計算している。
Note1: Figures for "Kyushu・Okinawa" are to be released from September, 2016, as the sum of "Kyushu" and "Okinawa”
Note2: The percentage change from the same month/term of the previous year is calculated using the linked coefficient to adjust for discrepancies Refer to the Appendix table
45
2021
Q2
Q3
Q4
Mar
Apr
May
Jun
Jul
Aug
Sep
Oct
Sales value (million yen) ・ Number of establishments
月
東北
Tohoku
Nov
Dec
Jan
2022
Feb
Mar
Apr
2021
Q2
Q3
Q4
Mar
Apr
May
Jun
Jul
Aug
Sep
Oct
Nov
Dec
Jan
Feb
Mar
Apr
2022
Percentage change from the same month/term of the previous year (%)
年
北海道
Hokkaido