

よむ、つかう、まなぶ。
商業動態統計速報 2022年9月分 (9 ページ)
出典
| 公開元URL | https://www.meti.go.jp/statistics/tyo/syoudou/result/sokuho_2.html |
| 出典情報 | 商業動態統計速報 2022年9月分(10/31)《経済産業省》 |
ページ画像
ダウンロードした画像を利用する際は「出典情報」を明記してください。
低解像度画像をダウンロード
プレーンテキスト
資料テキストはコンピュータによる自動処理で生成されており、完全に資料と一致しない場合があります。
テキストをコピーしてご利用いただく際は資料と付け合わせてご確認ください。
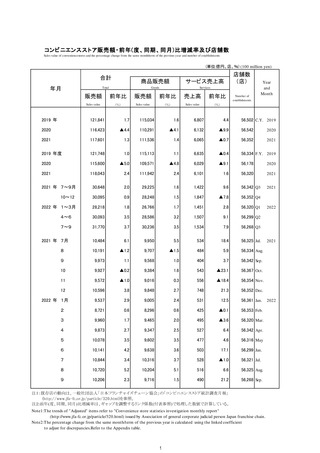
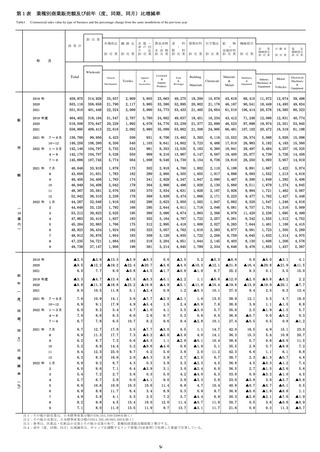
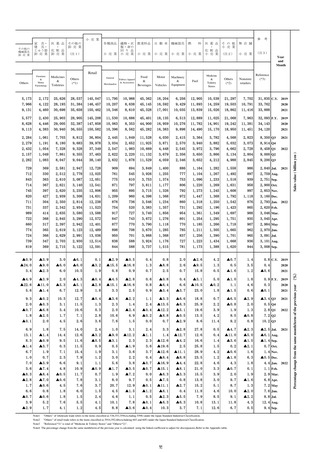
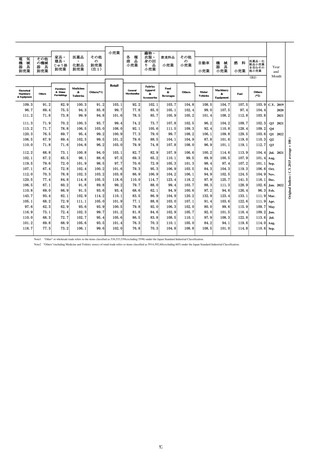
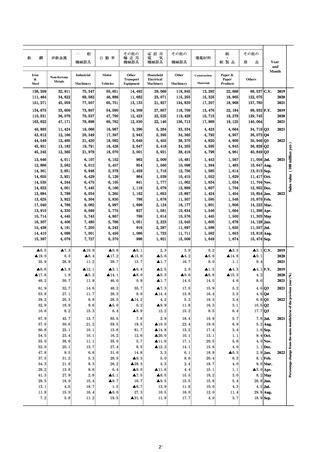
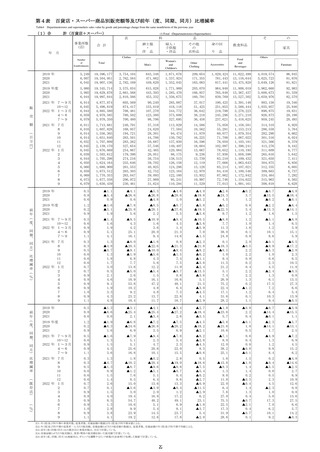
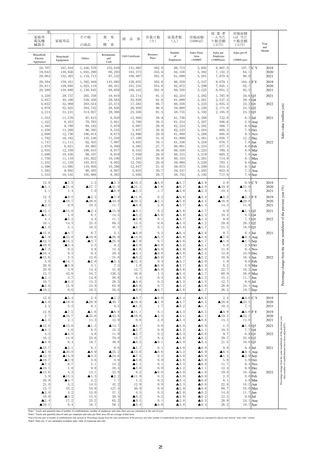
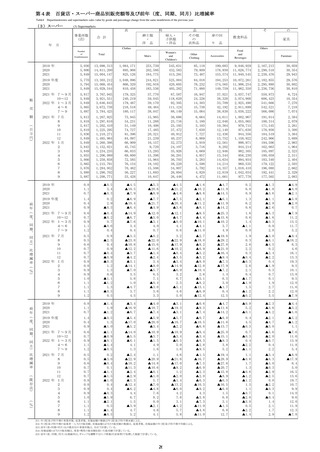
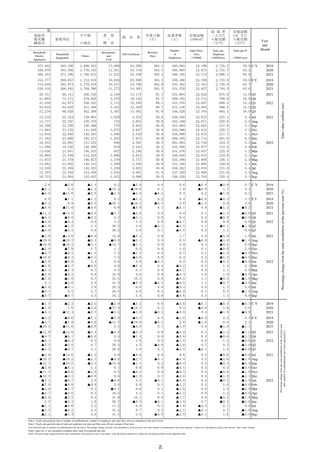
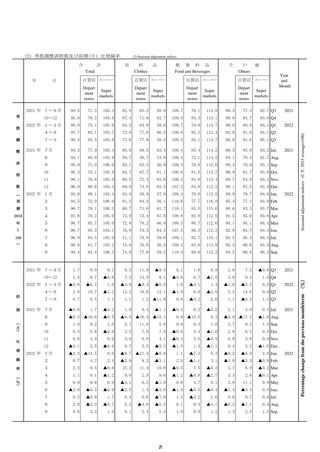
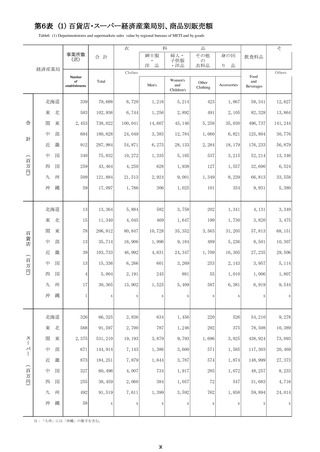
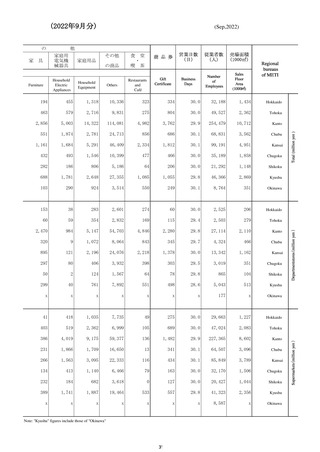
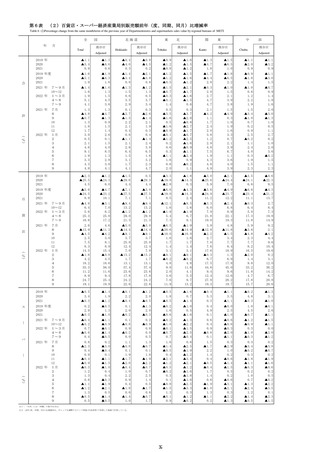
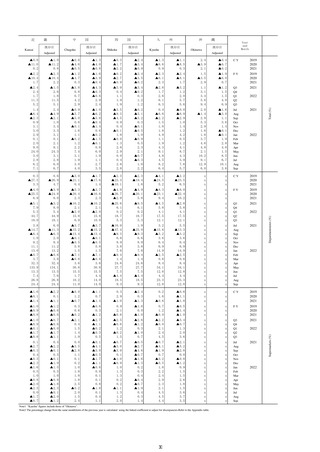
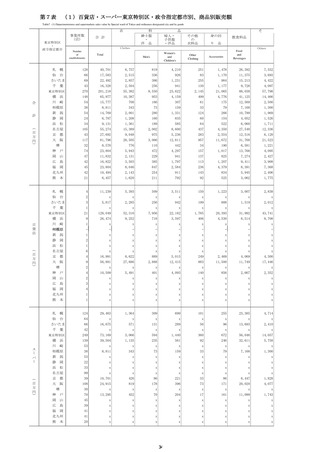
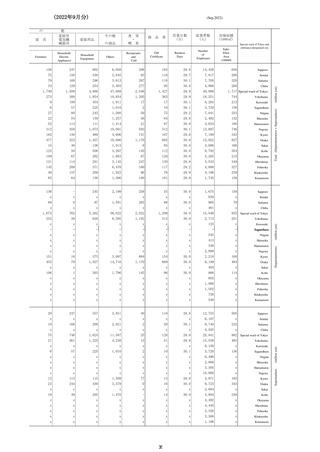
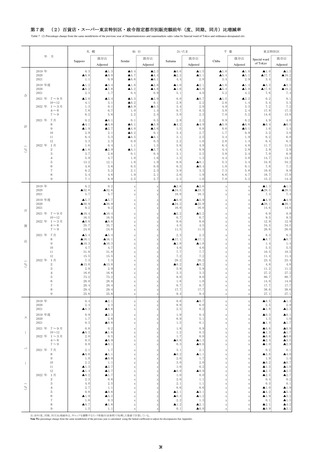
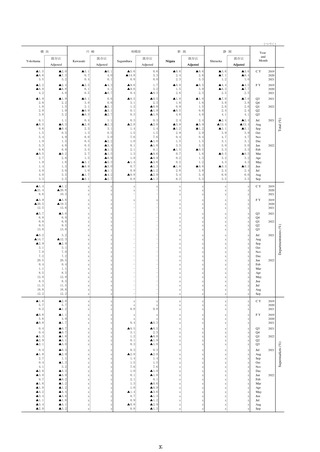
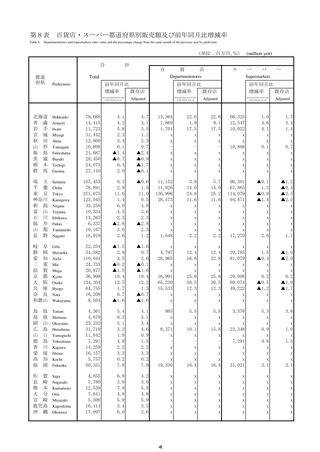
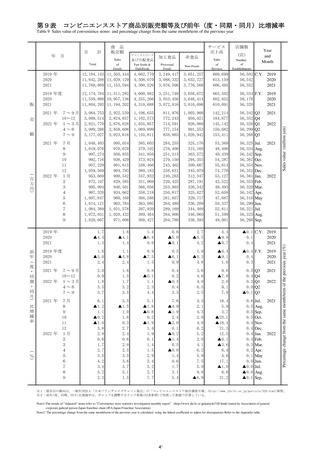
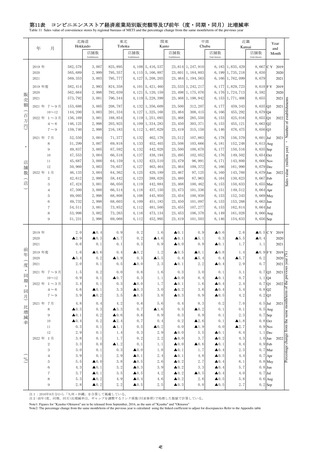
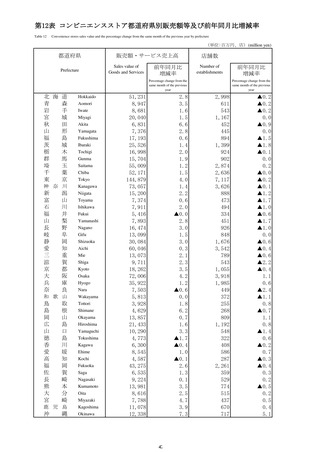
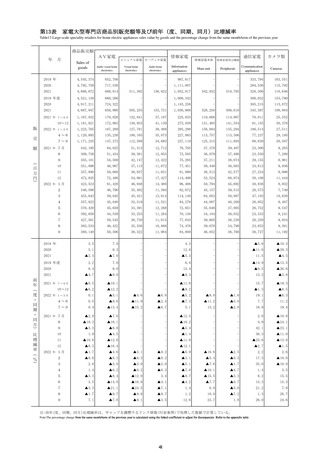
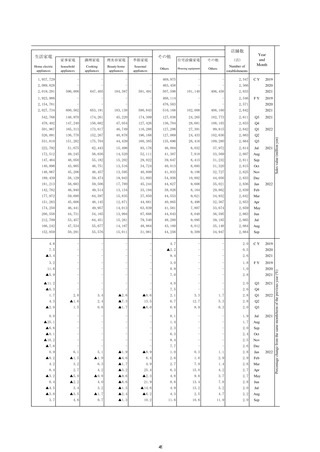
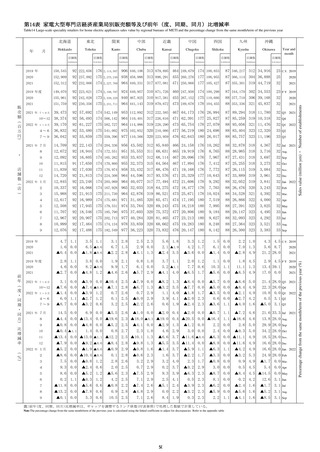
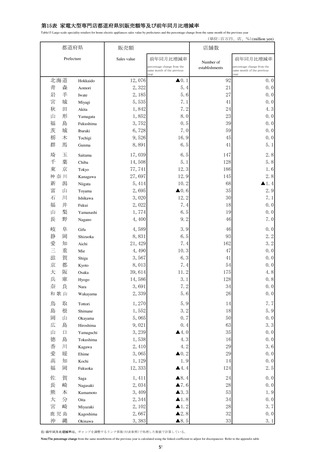
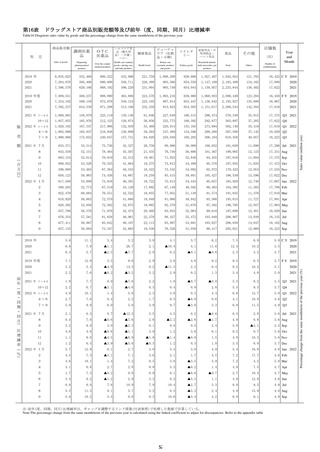
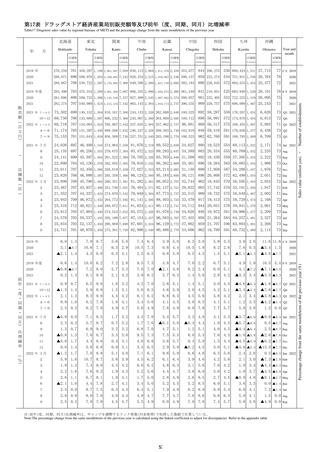
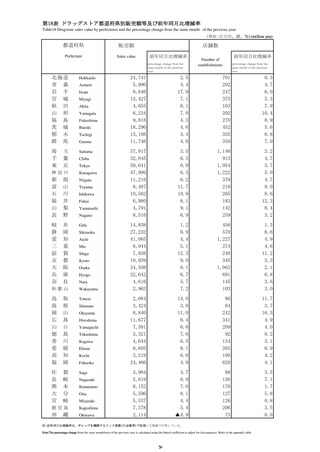
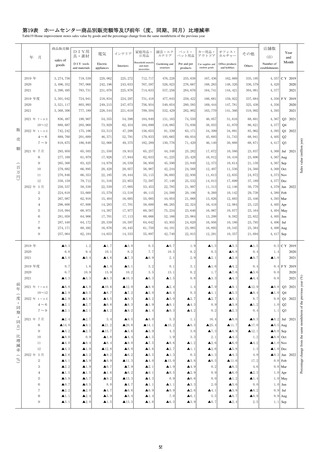
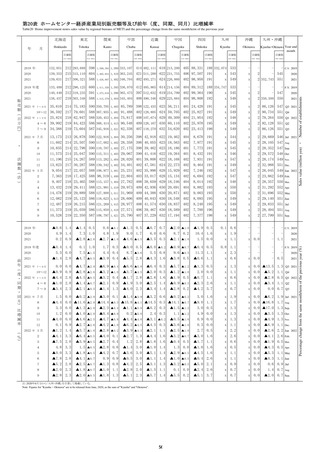
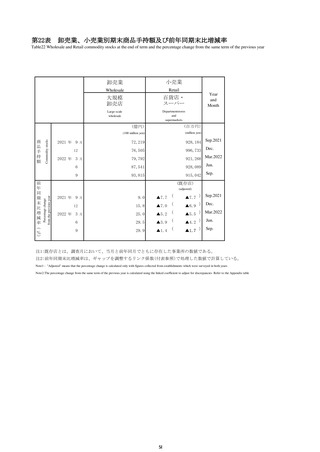
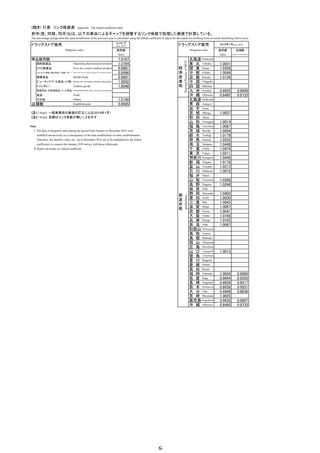
コンビニエンスストア販売額・前年(度、同期、同月)比増減率及び店舗数
Sales value of conveniencestores and the percentage change from the same month/term of the previous y ear and number of establishments
(単位:億円、店、%) (100 million yen)
合計
年月
商品販売額
サービス売上高
Goods
Services
Total
販売額
前年比
販売額
前年比
売上高
前年比
Sales value
(%)
Sales value
(%)
Sales value
(%)
店舗数
(店)
Number of
establishments
Year
and
Month
2019 年
121,841
1.7
115,034
1.6
6,807
4.4
2020
116,423
▲4.4
110,291
▲4.1
6,132
▲9.9
56,542
2020
2021
117,601
1.3
111,536
1.4
6,065
▲0.7
56,352
2021
2019 年度
121,748
1.0
115,113
1.1
6,635
▲0.4
56,334 F.Y. 2019
2020
115,600
▲5.0
109,571
▲4.8
6,029
▲9.1
56,178
2020
2021
118,043
2.4
111,942
2.4
6,101
1.6
56,320
2021
30,648
2.0
29,225
1.6
1,422
9.6
56,342 Q3
2021
30,095
0.9
28,248
1.5
1,847
▲7.8
56,352 Q4
28,218
1.8
26,766
1.7
1,451
2.8
56,320 Q1
4~6
30,093
3.5
28,586
3.2
1,507
9.1
56,299 Q2
7~9
31,770
3.7
30,236
3.5
1,534
7.9
56,268 Q3
10,484
6.1
9,950
5.5
534
18.4
56,325 Jul.
8
10,191
▲1.2
9,707
▲1.5
484
5.9
56,334 Aug.
9
9,973
1.1
9,568
1.0
404
3.7
56,342 Sep.
10
9,927
▲0.2
9,384
1.6
543
▲23.1
56,367 Oct.
11
9,572
▲1.0
9,016
0.3
556
▲18.4
56,354 Nov.
12
10,596
3.8
9,848
2.7
748
21.3
56,352 Dec.
9,537
2.9
9,005
2.4
531
12.5
56,361 Jan.
2
8,721
0.6
8,296
0.6
425
▲0.1
56,353 Feb.
3
9,960
1.7
9,465
2.0
495
▲3.6
56,320 Mar.
4
9,873
2.7
9,347
2.5
527
6.4
56,342 Apr.
5
10,078
3.5
9,602
3.5
477
4.6
56,316 May
6
10,141
4.2
9,638
3.6
503
17.1
56,299 Jun.
7
10,844
3.4
10,316
3.7
528
▲1.0
56,321 Jul.
8
10,720
5.2
10,204
5.1
516
6.6
56,325 Aug.
9
10,206
2.3
9,716
1.5
490
21.2
56,268 Sep.
2021 年 7~9月
10~12
2022 年 1~3月
2021 年 7月
2022 年 1月
56,502 C.Y. 2019
注1:既存店の動向は、一般社団法人「日本フランチャイズチェーン協会」の「コンビニエンスストア統計調査月報」
(http://www.jfa-fc.or.jp/particle/320.html)を参照。
注2:前年(度、同期、同月)比増減率は、ギャップを調整するリンク係数(付表参照)で処理した数値で計算している。
Note1:T he trends of "Adjusted" items refer to "Convenience store statistics investigation monthly report"
(http://www.jfa-fc.or.jp/particle/320.html) issued by Association of general corporate judicial person Japan franchise chain.
Note2:T he percentage change from the same month/term of the previous year is calculated using the linked coefficient
to adjust for discrepancies.Refer to the Appendix table.
9
2022
2021
2022
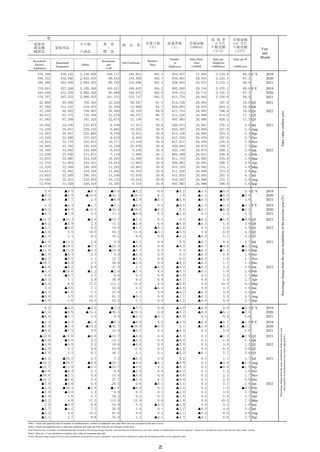
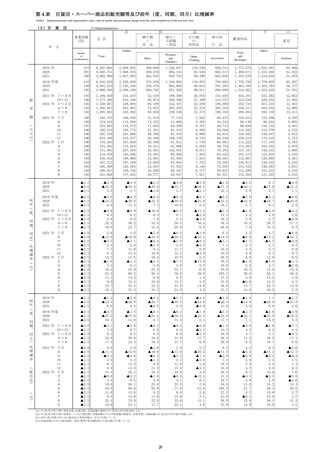
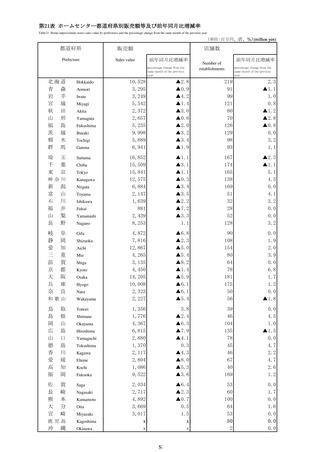