


よむ、つかう、まなぶ。
商業動態統計速報 2022年9月分 (29 ページ)
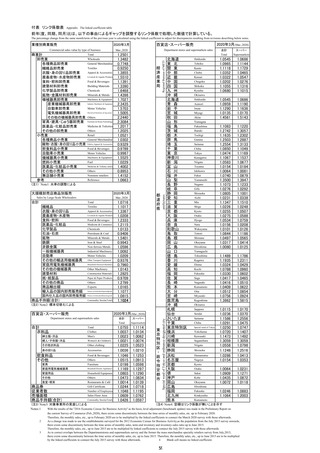
出典
| 公開元URL | https://www.meti.go.jp/statistics/tyo/syoudou/result/sokuho_2.html |
| 出典情報 | 商業動態統計速報 2022年9月分(10/31)《経済産業省》 |
ページ画像
ダウンロードした画像を利用する際は「出典情報」を明記してください。
低解像度画像をダウンロード
プレーンテキスト
資料テキストはコンピュータによる自動処理で生成されており、完全に資料と一致しない場合があります。
テキストをコピーしてご利用いただく際は資料と付け合わせてご確認ください。
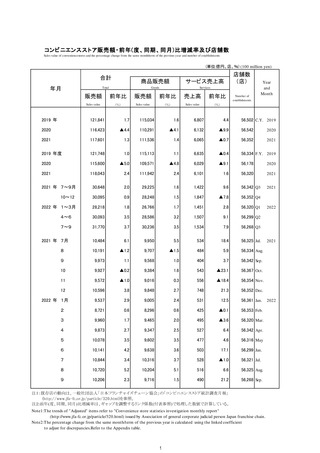
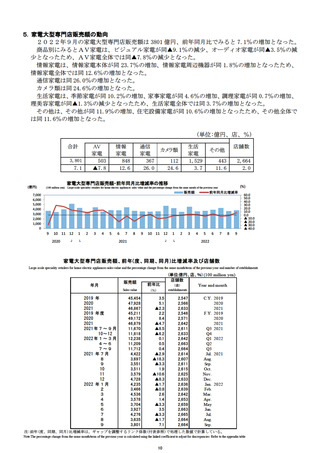
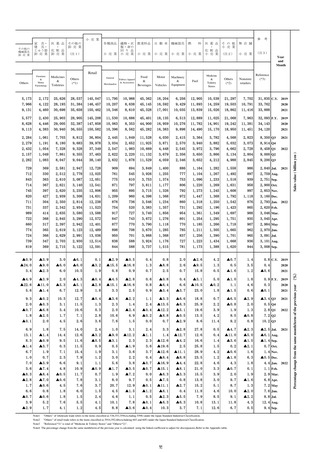
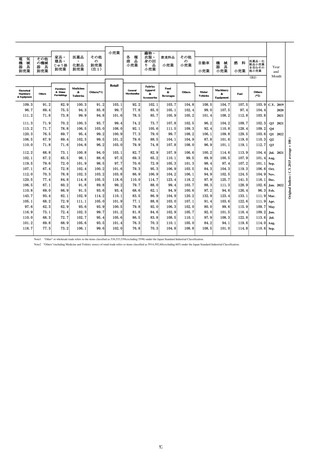
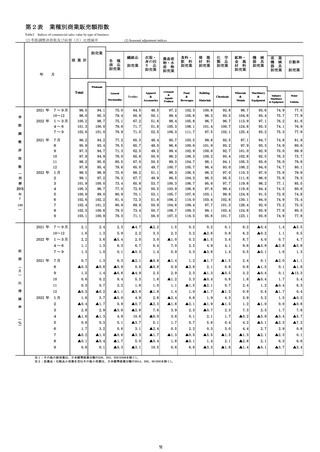
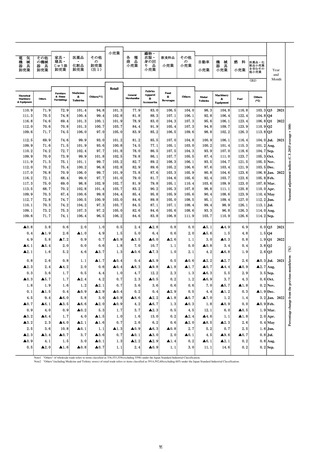
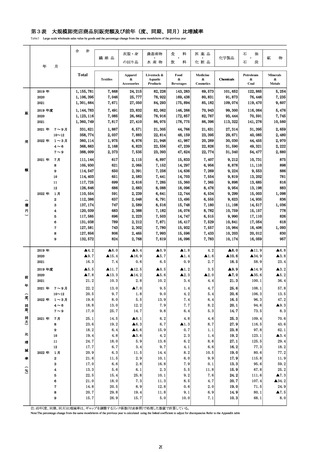
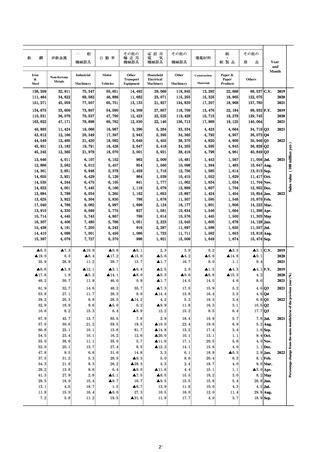
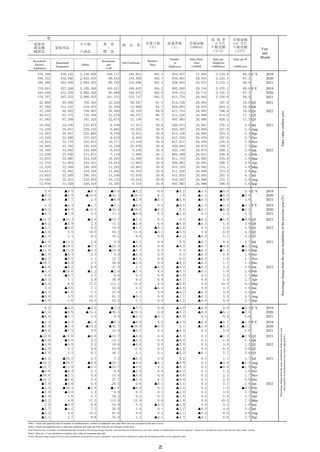
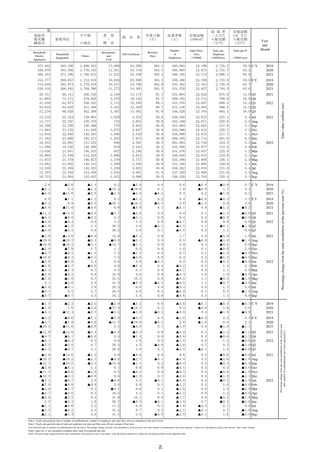
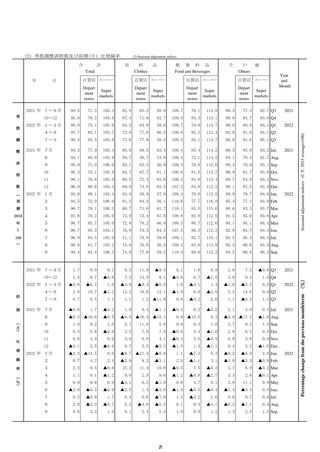
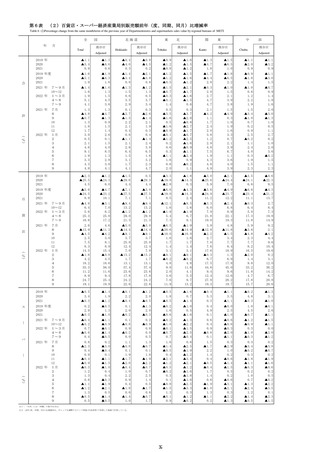
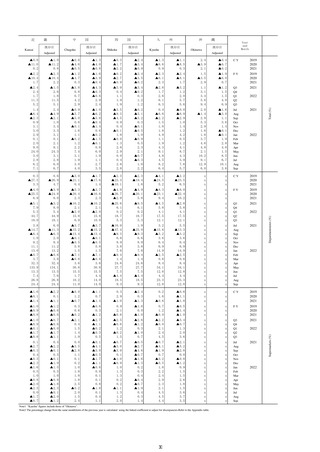
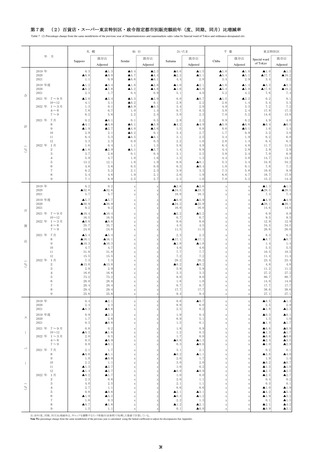
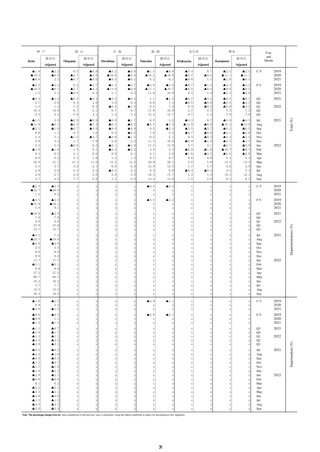
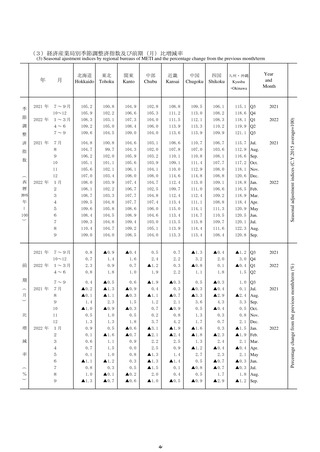
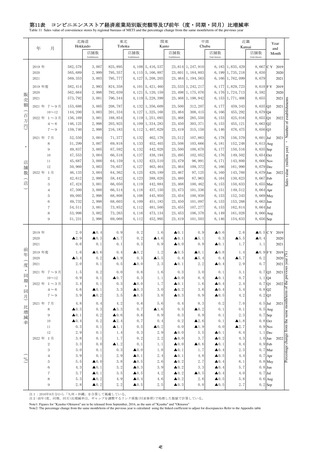
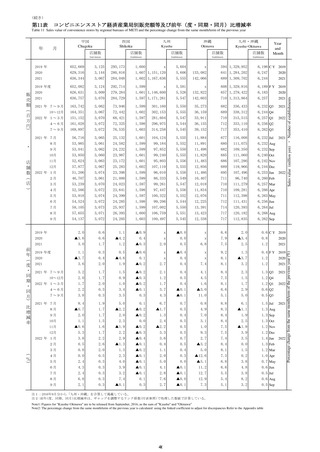
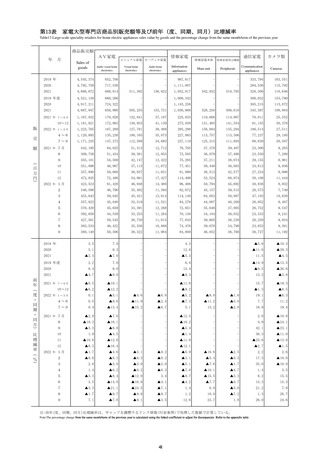
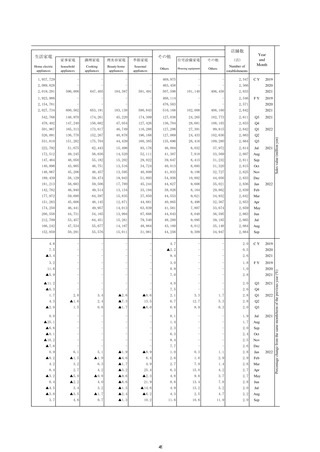
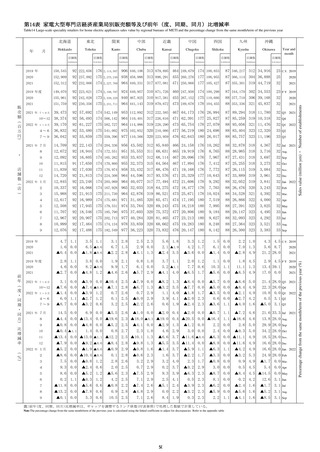
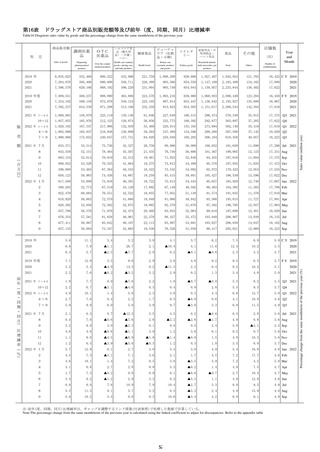
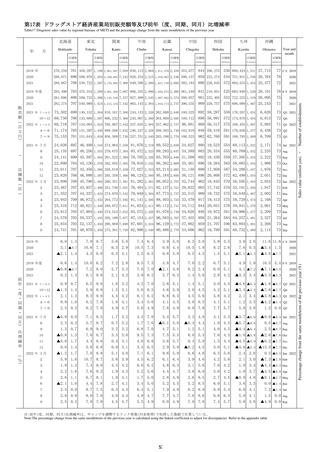
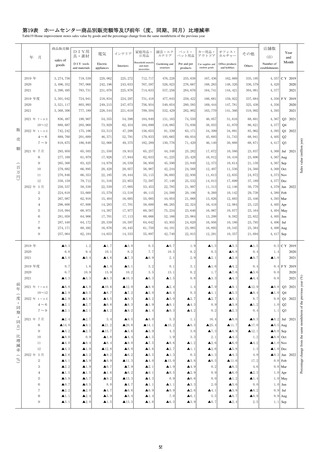
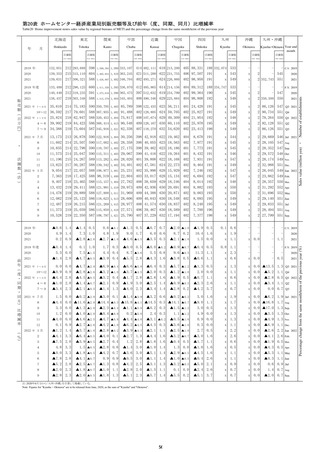
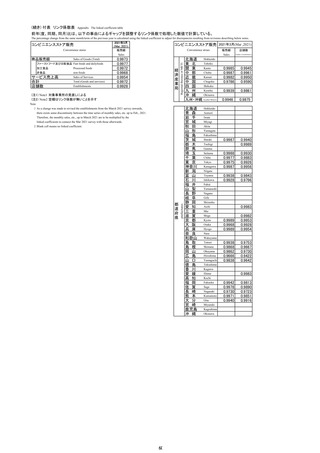
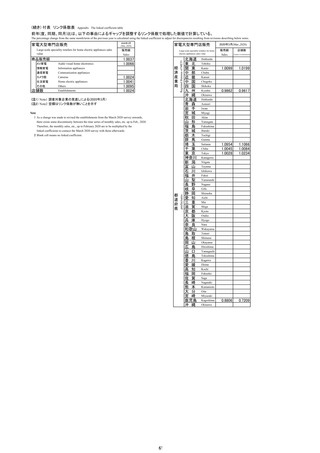
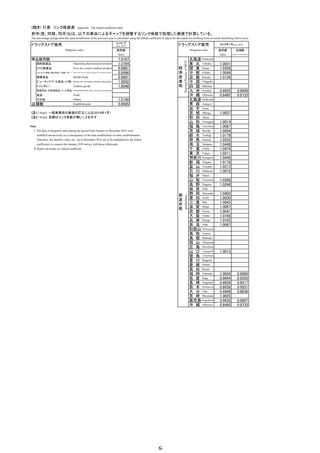
(2) 季節調整済指数及び前期(月)比増減率
衣
年
月
2021 年 7~9月
季
節
調
整
済
指
数
料
Clothes
品
飲 食 料 品
Food and Beverages
そ
の
Others
他
百貨店 スーパー
百貨店 スーパー
百貨店 スーパー
百貨店
スーパー
Depart
ment
stores
Depart
ment
stores
Depart
ment
stores
Depart
ment
stores
Super
markets
Super
markets
Super
markets
Super
markets
Year
and
Month
(
94.5
71.3
105.4
62.8
63.2
58.0
108.7
78.1
114.8
86.3
77.4
92.7 Q3
95.8
78.2
104.8
67.4
71.6
62.7
108.0
83.3
113.1
89.6
84.7
93.6 Q4
95.0
73.1
105.9
64.3
64.9
58.6
109.7
79.9
114.7
88.0
80.0
94.1 Q1
4~6
97.7
83.1
104.7
72.8
77.0
66.3
108.6
85.3
112.4
92.8
91.8
94.1 Q2
7~9
98.4
83.5
105.8
73.6
77.9
58.5
109.5
85.1
114.7
93.8
91.6
95.1 Q3
94.3
77.9
105.4
65.6
69.5
63.4
108.4
83.4
114.2
88.3
85.0
93.2 Jul.
8
94.1
65.0
104.9
59.7
56.7
53.8
108.4
72.1
114.5
84.1
70.4
91.7 Aug.
9
95.0
71.0
106.0
63.1
63.3
56.9
109.3
78.8
115.6
86.4
76.9
93.1 Sep.
10
95.3
75.1
105.0
64.7
67.7
61.1
108.6
81.5
113.7
88.9
81.7
93.6 Oct.
11
96.1
78.8
105.0
68.5
72.3
63.6
108.3
83.6
113.4
89.7
84.8
94.4 Nov.
12
96.0
80.8
104.4
69.0
74.8
63.5
107.2
84.8
112.2
90.1
87.5
92.9 Dec.
93.8
69.1
104.4
63.0
58.9
57.9
108.4
78.6
112.5
89.9
79.7
94.8 Jan.
10~12
2022 年 1~3月
2021 年 7月
2022 年 1月
西
2
94.5
72.0
106.9
61.2
64.3
56.1
110.6
77.7
116.0
85.4
77.1
93.9 Feb.
暦
3
96.7
78.1
106.3
68.7
71.6
61.7
110.1
83.5
115.6
88.6
83.3
93.7 Mar.
2015
4
97.8
78.2
105.0
74.9
73.4
67.6
108.8
82.8
112.5
91.5
85.6
93.6 Apr.
年
5
98.7
85.7
105.0
72.6
78.2
66.9
109.5
86.7
112.6
94.1
95.1
94.4 May
=
6
96.7
85.3
104.1
70.8
79.3
64.5
107.5
86.3
112.2
92.8
94.7
94.4 Jun.
100
7
96.9
84.5
105.9
71.1
79.8
59.6
109.1
82.7
115.1
93.5
95.4
94.4 Jul.
)
8
98.8
81.7
105.2
74.8
76.0
56.5
109.2
83.0
113.8
93.3
88.6
94.8 Aug.
9
99.4
84.4
106.3
74.9
77.8
59.5
110.3
89.6
115.2
94.5
90.8
96.2 Sep.
2021 年 7~9月
10~12
2022 年 1~3月
前
期
比
増
8.0
0.1
8.3
11.9
▲9.2
0.1
1.8
0.9
2.6
7.2
▲0.6 Q3
9.7
▲0.6
7.3
13.3
8.1
▲0.6
6.7
▲1.5
3.8
9.4
1.0 Q4
▲0.8
▲6.5
1.0
▲4.6
▲9.4
▲6.5
1.6
▲4.1
1.4
▲1.8
▲5.5
0.5 Q1
4~6
2.8
13.7
▲1.1
13.2
18.6
13.1
▲1.0
6.8
▲2.0
5.5
14.8
0.0 Q2
7~9
0.7
0.5
1.1
1.1
1.2 ▲11.8
0.8
▲0.2
2.0
1.1
▲0.2
1.1 Q3
▲0.6
1.7
▲0.2
1.9
0.4
▲0.5
0.2
▲0.2
2.1
4.0
0.5 Jul.
▲0.2 ▲16.6
▲0.5
2021 年 7月
8
(
月
)
1.7
1.4
▲1.1
0.0 ▲13.5
0.3
9
1.0
9.2
1.0
5.7
11.6
5.8
0.8
9.3
1.0
2.7
9.2
1.5 Sep.
10
0.3
5.8
▲0.9
2.5
7.0
7.4
▲0.6
3.4
▲1.6
2.9
6.2
0.5 Oct.
11
0.8
4.9
0.0
5.9
6.8
4.1
▲0.3
2.6
▲0.3
0.9
3.8
0.9 Nov.
12
▲0.1
2.5
▲0.6
0.7
3.5
▲0.2
▲1.0
1.4
▲1.1
0.4
3.2
▲1.6 Dec.
▲2.3 ▲14.5
▲4.8 ▲17.2
0.0
▲8.7 ▲21.3
▲8.8
1.1
▲7.3
0.3
▲0.2
▲8.9
2.0 Jan.
2
0.7
4.2
2.4
▲2.9
9.2
▲3.1
2.0
▲1.1
3.1
▲5.0
▲3.3
▲0.9 Feb.
率
3
2.3
8.5
▲0.6
12.3
11.4
10.0
▲0.5
7.5
▲0.3
3.7
8.0
▲0.2 Mar.
4
1.1
0.1
▲1.2
9.0
2.5
9.6
▲1.2
▲0.8
▲2.7
3.3
2.8
▲0.1 Apr.
5
0.9
9.6
0.0
▲3.1
6.5
▲1.0
0.6
4.7
0.1
2.8
11.1
0.9 May
6
▲2.0
▲0.5
▲0.9
▲2.5
1.4
▲3.6
▲1.8
▲0.5
▲0.4
▲1.4
▲0.4
0.0 Jun.
7
0.2
▲0.9
1.7
0.4
0.6
▲7.6
1.5
▲4.2
2.6
0.8
0.7
0.0 Jul.
8
2.0
▲3.3
▲0.7
5.2
▲4.8
▲5.2
0.1
0.4
▲1.1
▲0.2
▲7.1
0.4 Aug.
9
0.6
3.3
1.0
0.1
2.4
5.3
1.0
8.0
1.2
1.3
2.5
1.5 Sep.
29
2022
2021
2022
2021
2022
2021
▲1.6 Aug.
減
(
%
)
2022 年 1月
▲9.0 ▲18.4 ▲15.1
2021
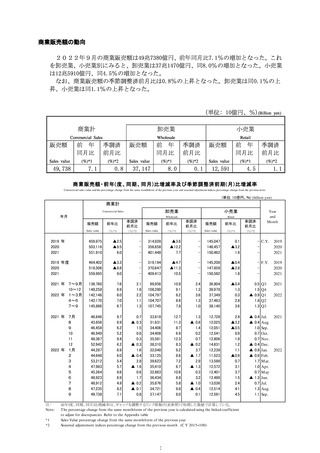
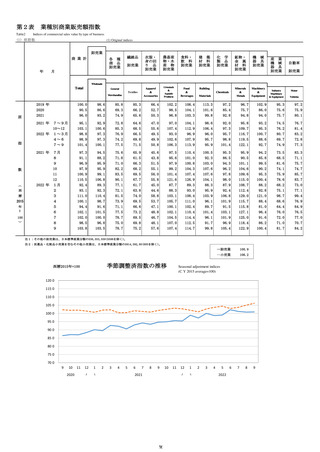
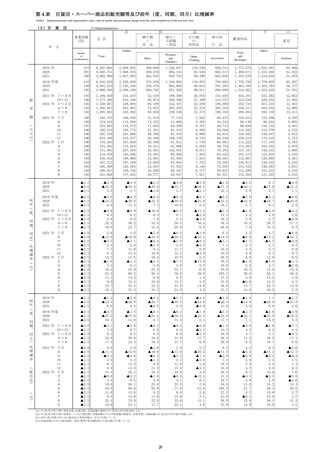
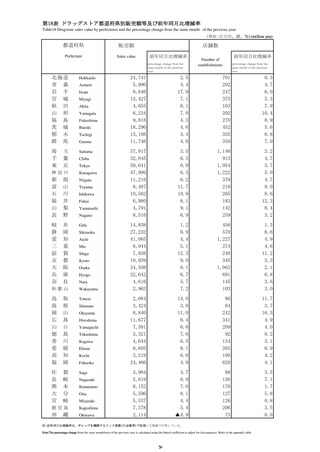
Seasonal adjustment indices (C.Y. 2015 average=100)
計
Total
2022
Percentage change from the previous month/term (%)
合
(2) Seasonal adjustment indices
衣
年
月
2021 年 7~9月
季
節
調
整
済
指
数
料
Clothes
品
飲 食 料 品
Food and Beverages
そ
の
Others
他
百貨店 スーパー
百貨店 スーパー
百貨店 スーパー
百貨店
スーパー
Depart
ment
stores
Depart
ment
stores
Depart
ment
stores
Depart
ment
stores
Super
markets
Super
markets
Super
markets
Super
markets
Year
and
Month
(
94.5
71.3
105.4
62.8
63.2
58.0
108.7
78.1
114.8
86.3
77.4
92.7 Q3
95.8
78.2
104.8
67.4
71.6
62.7
108.0
83.3
113.1
89.6
84.7
93.6 Q4
95.0
73.1
105.9
64.3
64.9
58.6
109.7
79.9
114.7
88.0
80.0
94.1 Q1
4~6
97.7
83.1
104.7
72.8
77.0
66.3
108.6
85.3
112.4
92.8
91.8
94.1 Q2
7~9
98.4
83.5
105.8
73.6
77.9
58.5
109.5
85.1
114.7
93.8
91.6
95.1 Q3
94.3
77.9
105.4
65.6
69.5
63.4
108.4
83.4
114.2
88.3
85.0
93.2 Jul.
8
94.1
65.0
104.9
59.7
56.7
53.8
108.4
72.1
114.5
84.1
70.4
91.7 Aug.
9
95.0
71.0
106.0
63.1
63.3
56.9
109.3
78.8
115.6
86.4
76.9
93.1 Sep.
10
95.3
75.1
105.0
64.7
67.7
61.1
108.6
81.5
113.7
88.9
81.7
93.6 Oct.
11
96.1
78.8
105.0
68.5
72.3
63.6
108.3
83.6
113.4
89.7
84.8
94.4 Nov.
12
96.0
80.8
104.4
69.0
74.8
63.5
107.2
84.8
112.2
90.1
87.5
92.9 Dec.
93.8
69.1
104.4
63.0
58.9
57.9
108.4
78.6
112.5
89.9
79.7
94.8 Jan.
10~12
2022 年 1~3月
2021 年 7月
2022 年 1月
西
2
94.5
72.0
106.9
61.2
64.3
56.1
110.6
77.7
116.0
85.4
77.1
93.9 Feb.
暦
3
96.7
78.1
106.3
68.7
71.6
61.7
110.1
83.5
115.6
88.6
83.3
93.7 Mar.
2015
4
97.8
78.2
105.0
74.9
73.4
67.6
108.8
82.8
112.5
91.5
85.6
93.6 Apr.
年
5
98.7
85.7
105.0
72.6
78.2
66.9
109.5
86.7
112.6
94.1
95.1
94.4 May
=
6
96.7
85.3
104.1
70.8
79.3
64.5
107.5
86.3
112.2
92.8
94.7
94.4 Jun.
100
7
96.9
84.5
105.9
71.1
79.8
59.6
109.1
82.7
115.1
93.5
95.4
94.4 Jul.
)
8
98.8
81.7
105.2
74.8
76.0
56.5
109.2
83.0
113.8
93.3
88.6
94.8 Aug.
9
99.4
84.4
106.3
74.9
77.8
59.5
110.3
89.6
115.2
94.5
90.8
96.2 Sep.
2021 年 7~9月
10~12
2022 年 1~3月
前
期
比
増
8.0
0.1
8.3
11.9
▲9.2
0.1
1.8
0.9
2.6
7.2
▲0.6 Q3
9.7
▲0.6
7.3
13.3
8.1
▲0.6
6.7
▲1.5
3.8
9.4
1.0 Q4
▲0.8
▲6.5
1.0
▲4.6
▲9.4
▲6.5
1.6
▲4.1
1.4
▲1.8
▲5.5
0.5 Q1
4~6
2.8
13.7
▲1.1
13.2
18.6
13.1
▲1.0
6.8
▲2.0
5.5
14.8
0.0 Q2
7~9
0.7
0.5
1.1
1.1
1.2 ▲11.8
0.8
▲0.2
2.0
1.1
▲0.2
1.1 Q3
▲0.6
1.7
▲0.2
1.9
0.4
▲0.5
0.2
▲0.2
2.1
4.0
0.5 Jul.
▲0.2 ▲16.6
▲0.5
2021 年 7月
8
(
月
)
1.7
1.4
▲1.1
0.0 ▲13.5
0.3
9
1.0
9.2
1.0
5.7
11.6
5.8
0.8
9.3
1.0
2.7
9.2
1.5 Sep.
10
0.3
5.8
▲0.9
2.5
7.0
7.4
▲0.6
3.4
▲1.6
2.9
6.2
0.5 Oct.
11
0.8
4.9
0.0
5.9
6.8
4.1
▲0.3
2.6
▲0.3
0.9
3.8
0.9 Nov.
12
▲0.1
2.5
▲0.6
0.7
3.5
▲0.2
▲1.0
1.4
▲1.1
0.4
3.2
▲1.6 Dec.
▲2.3 ▲14.5
▲4.8 ▲17.2
0.0
▲8.7 ▲21.3
▲8.8
1.1
▲7.3
0.3
▲0.2
▲8.9
2.0 Jan.
2
0.7
4.2
2.4
▲2.9
9.2
▲3.1
2.0
▲1.1
3.1
▲5.0
▲3.3
▲0.9 Feb.
率
3
2.3
8.5
▲0.6
12.3
11.4
10.0
▲0.5
7.5
▲0.3
3.7
8.0
▲0.2 Mar.
4
1.1
0.1
▲1.2
9.0
2.5
9.6
▲1.2
▲0.8
▲2.7
3.3
2.8
▲0.1 Apr.
5
0.9
9.6
0.0
▲3.1
6.5
▲1.0
0.6
4.7
0.1
2.8
11.1
0.9 May
6
▲2.0
▲0.5
▲0.9
▲2.5
1.4
▲3.6
▲1.8
▲0.5
▲0.4
▲1.4
▲0.4
0.0 Jun.
7
0.2
▲0.9
1.7
0.4
0.6
▲7.6
1.5
▲4.2
2.6
0.8
0.7
0.0 Jul.
8
2.0
▲3.3
▲0.7
5.2
▲4.8
▲5.2
0.1
0.4
▲1.1
▲0.2
▲7.1
0.4 Aug.
9
0.6
3.3
1.0
0.1
2.4
5.3
1.0
8.0
1.2
1.3
2.5
1.5 Sep.
29
2022
2021
2022
2021
2022
2021
▲1.6 Aug.
減
(
%
)
2022 年 1月
▲9.0 ▲18.4 ▲15.1
2021
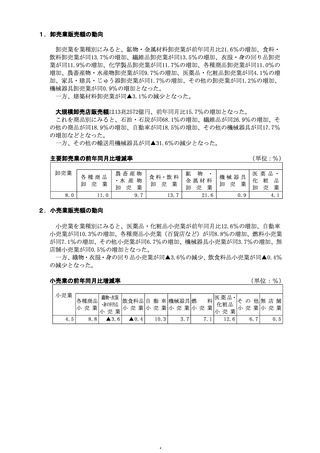
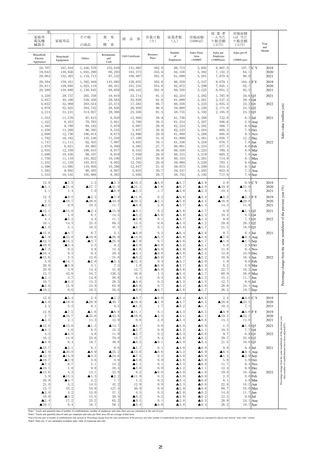
Seasonal adjustment indices (C.Y. 2015 average=100)
計
Total
2022
Percentage change from the previous month/term (%)
合
(2) Seasonal adjustment indices