


よむ、つかう、まなぶ。
商業動態統計速報 2026年3月分 (3 ページ)
出典
| 公開元URL | |
| 出典情報 | 商業動態統計速報 2026年3月分(4/30)《経済産業省》 |
ページ画像
ダウンロードした画像を利用する際は「出典情報」を明記してください。
低解像度画像をダウンロード
プレーンテキスト
資料テキストはコンピュータによる自動処理で生成されており、完全に資料と一致しない場合があります。
テキストをコピーしてご利用いただく際は資料と付け合わせてご確認ください。
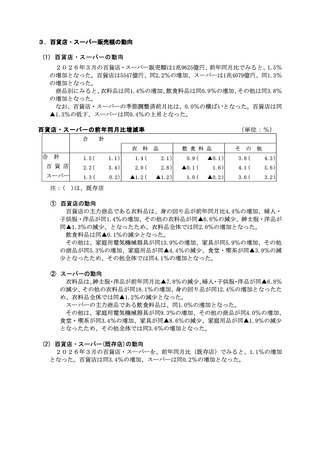
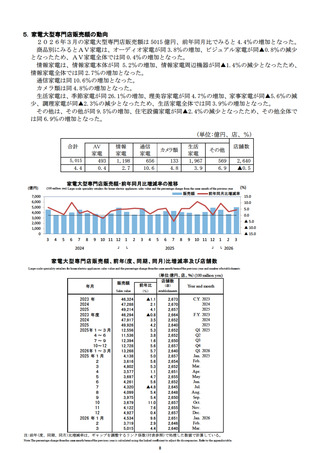
商業販売額の動向
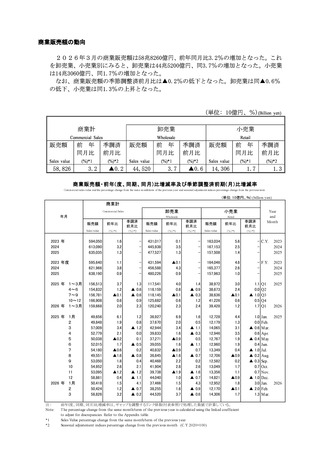
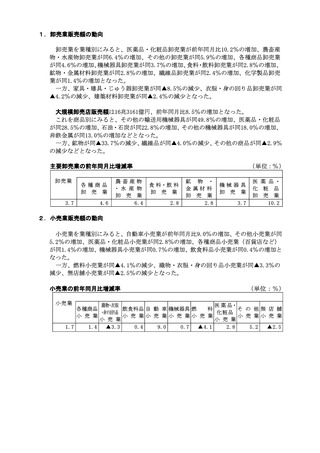
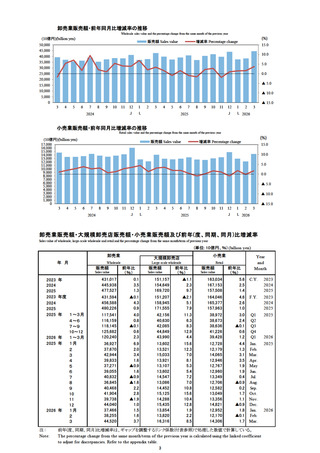
2026年3月の商業販売額は58兆8260億円、前年同月比3.2%の増加となった。これ
を卸売業、小売業別にみると、卸売業は44兆5200億円、同3.7%の増加となった。小売業
は14兆3060億円、同1.7%の増加となった。
なお、商業販売額の季節調整済前月比は▲0.2%の低下となった。卸売業は同▲0.6%
の低下、小売業は同1.3%の上昇となった。
(単位: 10億円、%)(Billion yen)
商業計
卸売業
小売業
Commercial Sales
Wholesale
Retail
販売額
前 年
同月比
季調済
前月比
販売額
前 年
同月比
季調済
前月比
販売額
前 年
同月比
季調済
前月比
Sales value
(%)*1
(%)*2
Sales value
(%)*1
(%)*2
Sales value
(%)*1
(%)*2
▲0.2
44,520
▲0.6
14,306
58,826
3.2
3.7
1.7
1.3
商業販売額・前年(度、同期、同月)比増減率及び季節調整済前期(月)比増減率
Commercial sales value and the percentage change from the same month/term of the previous y ear and seasonal adjustment indices percentage change from the previous term.
(単位: 10億円、%) (billion yen)
商業計
Commercial Sales
年月
小売業
Wholesale
Retail
販売額
前年比
季調済
前月比
販売額
前年比
季調済
前月比
販売額
前年比
季調済
前月比
Sales value
(%)*1
(%)*2
Sales value
(%)*1
(%)*2
Sales value
(%)*1
(%)*2
Year
and
Month
2023 年
2024
2025
594,050
613,090
635,035
1.6
3.2
1.3
-
431,017
445,938
477,527
0.1
3.5
1.3
-
163,034
167,153
157,508
5.6
2.5
1.4
- C.Y.
-
2023
2024
2025
2023 年度
2024
2025
595,640
621,966
638,190
1.1
3.8
0.9
-
431,594
456,588
480,226
▲0.1
4.3
0.9
-
164,046
165,377
157,963
4.6
2.6
1.0
- F.Y.
-
2023
2024
2025
2025 年 1~3月
4~6
7~9
10~12
2026 年 1~3月
156,513
154,832
156,781
166,908
159,668
3.7
1.2
▲0.1
0.6
2.0
1.3
▲ 0.6
▲ 0.6
0.9
2.3
117,541
116,159
118,145
125,682
120,240
4.0
0.8
▲0.1
0.6
2.3
1.4
▲ 0.9
▲ 0.3
1.2
2.4
38,972
38,673
38,636
41,226
39,428
3.0
2.4
▲0.1
0.6
1.2
1.1 Q1
0.0 Q2
▲ 1.0 Q3
0.5 Q4
1.7 Q1
2025
2025 年 1月
2
3
4
5
6
7
8
9
10
11
12
2026 年 1月
2
3
49,656
49,848
57,009
52,779
50,038
52,015
54,180
49,551
53,050
54,952
53,095
58,861
50,418
50,424
58,826
6.1
1.9
3.4
2.1
▲0.2
1.7
▲0.6
▲1.6
1.8
2.6
▲1.2
0.4
1.5
1.2
3.2
1.2
0.8
▲ 1.2
0.0
0.1
▲ 0.5
0.2
▲ 0.8
0.4
2.1
▲ 1.2
▲ 1.1
4.1
▲ 0.7
▲ 0.2
36,927
37,670
42,944
39,833
37,271
39,055
40,832
36,845
40,468
41,904
39,738
44,040
37,466
38,255
44,520
6.9
2.0
3.4
1.6
▲0.9
1.6
▲0.9
▲1.6
2.2
2.8
▲1.9
1.0
1.5
1.6
3.7
1.6
0.5
▲ 1.1
▲ 0.3
0.5
▲ 1.1
0.7
▲ 0.7
0.2
2.6
▲ 1.6
▲ 0.7
4.3
▲ 0.9
▲ 0.6
12,728
12,179
14,065
12,946
12,767
12,960
13,349
12,706
12,582
13,049
13,356
14,821
12,952
12,170
14,306
4.4
1.3
3.1
3.5
1.9
1.9
0.4
▲0.9
0.2
1.7
1.1
▲0.9
1.8
▲0.1
1.7
1.0 Jan.
0.0 Feb.
▲ 0.6 M ar.
0.6 Apr.
▲ 0.4 M ay
0.4 Jun.
▲ 1.0 Jul.
▲ 0.2 Aug.
▲ 0.3 Sep.
0.7 Oct.
0.7 Nov.
▲ 1.0 Dec.
3.0 Jan.
▲ 2.0 Feb.
1.3 M ar.
2025
注:
Note:
*1
*2
卸売業
前年(度、同期、同月)比増減率は、ギャップを調整するリンク係数(付表参照)で処理した数値で計算している。
T he percentage change from the same month/term of the previous year is calculated using the linked coefficient
to adjust for discrepancies. Refer to the Appendix table.
Sales Value percentage change from the same month/term of the previous year
Seasonal adjustement indices percentage change from the previous month (C.Y.2020=100)
1
2026
2026