


よむ、つかう、まなぶ。
商業動態統計速報 2025年6月分 (5 ページ)
出典
| 公開元URL | |
| 出典情報 | 商業動態統計速報 2025年6月分(7/31)《経済産業省》 |
ページ画像
ダウンロードした画像を利用する際は「出典情報」を明記してください。
低解像度画像をダウンロード
プレーンテキスト
資料テキストはコンピュータによる自動処理で生成されており、完全に資料と一致しない場合があります。
テキストをコピーしてご利用いただく際は資料と付け合わせてご確認ください。
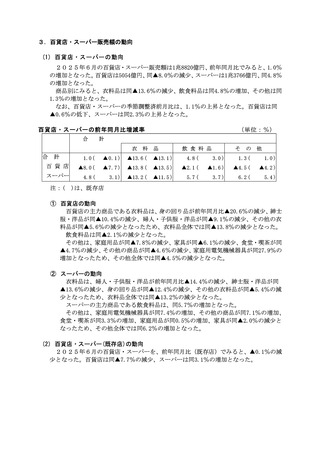
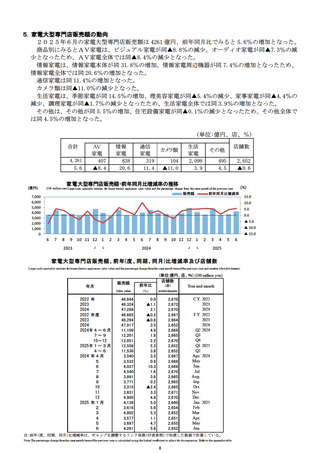
制売業販売額・前年同月比増減率の推移
Wholesale sales valne and 他e peentsge change from te same mon人h of 仙e preunous Year
(blhon %
(10億円) ye) に 屋売額 Sales yalne =ー増減率 Percentage change (9
50.000 15.0
45.000 -
40.000 - - 100
35.000 還 し s0
30.000 -
25.000 - 「- 00
20.000 -
15.000 - 「 人50
40000 - 4100
5.000 -
0 - -全15.0
6 7 8 9 12 1 2 3 4 5 6 7 9 10 11 12 1 2 3 4 6
2023 ゴー上 2024 ゴー上 2025
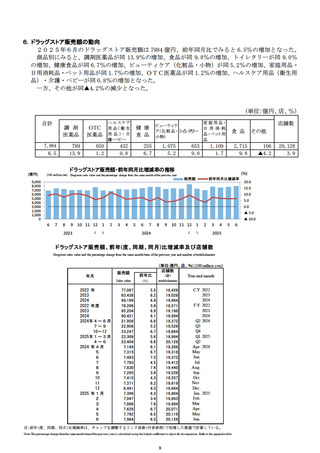
小売業販売額・前年同月比増減率の推移
Retsl sales valine and te percentage change from the same month of the prevnous Year
%)
0夫呈m Ye) = 履売額 Salesvalne =増減率 Percentage change 内 0
- 100
| 50
| 0.0
- 450
- 人10.0
- 15.0
6 7 8 9 10 11 12 1 2 3 4 5 6 7 9 。 10 11 12 1 2 3 4 6
2023 ゴート上 2024 ゴー上 2025
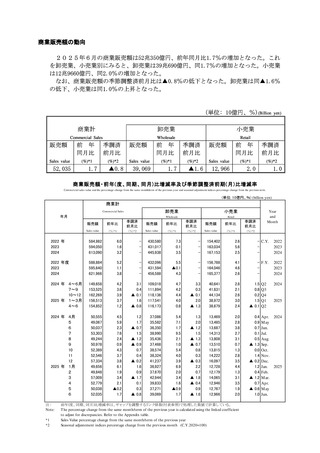
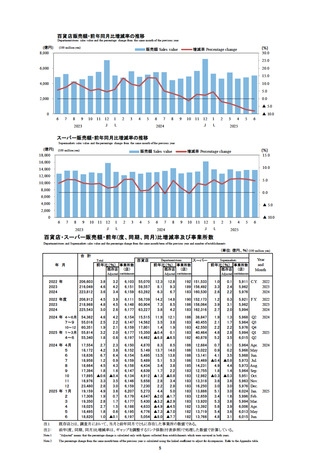
卸売業販売額・大規模卸売店販売額・小売業販売額及び前年(度、同期、同月)比増減率
Sales valne of wholesale. large-scale wholesale andreta1l and fhe percentage change from the same monfh/erm of previous Year
(単位: 10億円 、96) (billion yen)
印売業 | 大表和卸売店 。 作業 Year
年 月 Wholesale TLarge-scale wholesale ー Retail and
販売額 | 前年比 | 販売額 | 前年比 | 販売額 | 前年比 | Moath
2022 年 430.580 7.3 152.812 17.4 154.402 26| CY. 2022
2023 431.017 0.1 151.157 全1.1 163.034 5.6 2023
2024 445.938 3.5 154.649 2.3 167.153 2.5 2024
2022 年度 432.096 5.5 154.441 13.4 156.788 4.1| FY. 2022
2023 431.594 人人0.1 151.207 全2.1 164.046 4.6 2023
2024 456.588 4.3 158.373 4.7 165.377 2.6 2024
2024 年 4~6月 109.018 4.7 38.234 5.9 40.641 28| Q2 2024
7プー9 111.894 4.2 38.846 2.6 41.631 2.1| Q3
10<12 118.136 4.4 39.710 0.8 44.134 26| Q4
2025 年13月 117.541 4.0 41.583 9.8 38.972 3.0| Q1 2025
4と6 116,.173 0.8 39.948 4.5 38.679 2.4| Q2
2024 年 4月 37.086 5.4 12.880 7.0 13.469 20| Apr. 2024
5 35,582 7.1 12.448 7.3 13.485 2.8| May
6 36.350 1.7 12.905 3.6 13.687 3.8| Jan.
フワ 38.990 9.5 13.571 9.4 14.313 2.7| Jl
8 35,436 2.1 12.232 人人0.2 13.808 3.1| Aug.
9 37.468 1.0 13.043 全1.3 13.510 0.7| Sep.
10 38.574 5.4 13.080 2.2 13.815 1.3| Oct.
11 38,.324 4.0 12.942 0.4 14.222 2.8| Nov.
12 41.237 3.9 13.688 人人0.1 16.097 3.5| Dec.
2025 年 1月 36,.927 6.9 13.407 13.9 12.728 4.4| Jan_ 2025
2 37.670 2.0 13.276 10.3 12.179 1.3| Feb.
3 42.944 3.4 14.900 6.0 14.065 3.1| Mar.
4 39.833 1.6 13.602 5.6 12.946 3.5| Apr.
5 37.271 40.9 12.857 3.3 12.767 1.9| May
6 39.069 1.7 13.490 4.5 12.966 2.0| Jan.
Tote-
前年(度、同期、同月)比増減率は、ギャップを調整するリンク係数(付表参照)で処理した数値で計算している。
to adiust for hscrepancies. Refer to the appendix table.
3
The percentage change from the same month/term of the prevlous Year 1s calculated using the linked coefficient
Wholesale sales valne and 他e peentsge change from te same mon人h of 仙e preunous Year
(blhon %
(10億円) ye) に 屋売額 Sales yalne =ー増減率 Percentage change (9
50.000 15.0
45.000 -
40.000 - - 100
35.000 還 し s0
30.000 -
25.000 - 「- 00
20.000 -
15.000 - 「 人50
40000 - 4100
5.000 -
0 - -全15.0
6 7 8 9 12 1 2 3 4 5 6 7 9 10 11 12 1 2 3 4 6
2023 ゴー上 2024 ゴー上 2025
小売業販売額・前年同月比増減率の推移
Retsl sales valine and te percentage change from the same month of the prevnous Year
%)
0夫呈m Ye) = 履売額 Salesvalne =増減率 Percentage change 内 0
- 100
| 50
| 0.0
- 450
- 人10.0
- 15.0
6 7 8 9 10 11 12 1 2 3 4 5 6 7 9 。 10 11 12 1 2 3 4 6
2023 ゴート上 2024 ゴー上 2025
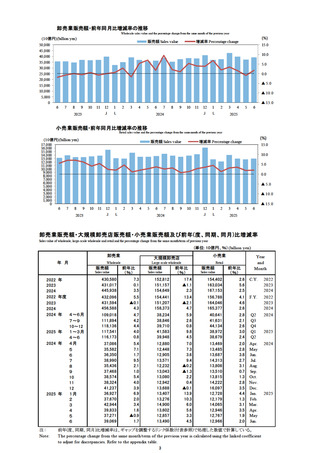
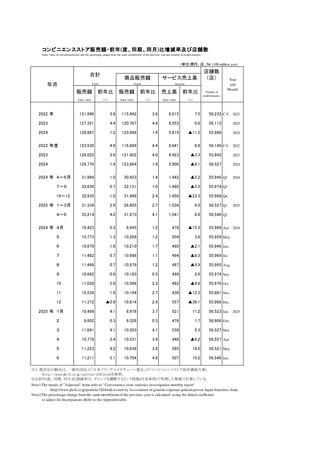
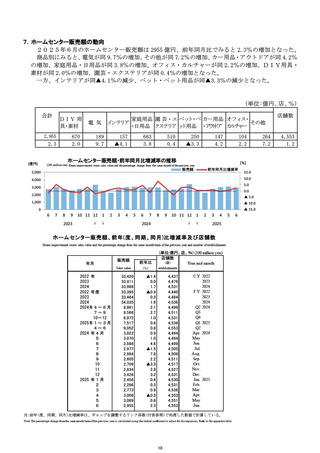
卸売業販売額・大規模卸売店販売額・小売業販売額及び前年(度、同期、同月)比増減率
Sales valne of wholesale. large-scale wholesale andreta1l and fhe percentage change from the same monfh/erm of previous Year
(単位: 10億円 、96) (billion yen)
印売業 | 大表和卸売店 。 作業 Year
年 月 Wholesale TLarge-scale wholesale ー Retail and
販売額 | 前年比 | 販売額 | 前年比 | 販売額 | 前年比 | Moath
2022 年 430.580 7.3 152.812 17.4 154.402 26| CY. 2022
2023 431.017 0.1 151.157 全1.1 163.034 5.6 2023
2024 445.938 3.5 154.649 2.3 167.153 2.5 2024
2022 年度 432.096 5.5 154.441 13.4 156.788 4.1| FY. 2022
2023 431.594 人人0.1 151.207 全2.1 164.046 4.6 2023
2024 456.588 4.3 158.373 4.7 165.377 2.6 2024
2024 年 4~6月 109.018 4.7 38.234 5.9 40.641 28| Q2 2024
7プー9 111.894 4.2 38.846 2.6 41.631 2.1| Q3
10<12 118.136 4.4 39.710 0.8 44.134 26| Q4
2025 年13月 117.541 4.0 41.583 9.8 38.972 3.0| Q1 2025
4と6 116,.173 0.8 39.948 4.5 38.679 2.4| Q2
2024 年 4月 37.086 5.4 12.880 7.0 13.469 20| Apr. 2024
5 35,582 7.1 12.448 7.3 13.485 2.8| May
6 36.350 1.7 12.905 3.6 13.687 3.8| Jan.
フワ 38.990 9.5 13.571 9.4 14.313 2.7| Jl
8 35,436 2.1 12.232 人人0.2 13.808 3.1| Aug.
9 37.468 1.0 13.043 全1.3 13.510 0.7| Sep.
10 38.574 5.4 13.080 2.2 13.815 1.3| Oct.
11 38,.324 4.0 12.942 0.4 14.222 2.8| Nov.
12 41.237 3.9 13.688 人人0.1 16.097 3.5| Dec.
2025 年 1月 36,.927 6.9 13.407 13.9 12.728 4.4| Jan_ 2025
2 37.670 2.0 13.276 10.3 12.179 1.3| Feb.
3 42.944 3.4 14.900 6.0 14.065 3.1| Mar.
4 39.833 1.6 13.602 5.6 12.946 3.5| Apr.
5 37.271 40.9 12.857 3.3 12.767 1.9| May
6 39.069 1.7 13.490 4.5 12.966 2.0| Jan.
Tote-
前年(度、同期、同月)比増減率は、ギャップを調整するリンク係数(付表参照)で処理した数値で計算している。
to adiust for hscrepancies. Refer to the appendix table.
3
The percentage change from the same month/term of the prevlous Year 1s calculated using the linked coefficient