


よむ、つかう、まなぶ。
商業動態統計速報 2025年4月分 (3 ページ)
出典
| 公開元URL | |
| 出典情報 | 商業動態統計速報 2025年4月分(5/30)《経済産業省》 |
ページ画像
ダウンロードした画像を利用する際は「出典情報」を明記してください。
低解像度画像をダウンロード
プレーンテキスト
資料テキストはコンピュータによる自動処理で生成されており、完全に資料と一致しない場合があります。
テキストをコピーしてご利用いただく際は資料と付け合わせてご確認ください。
商業販売額の動向
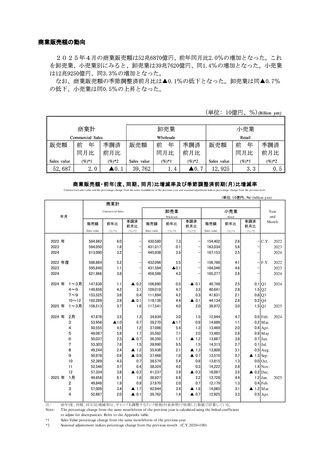
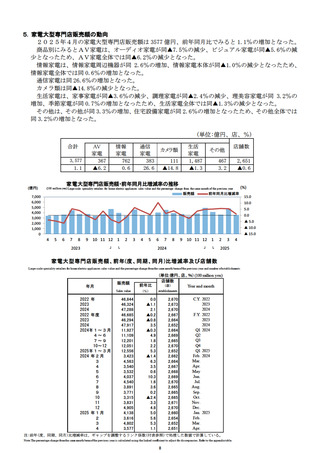
2025年4月の商業販売額は52兆6870億円、前年同月比2.0%の増加となった。これ
を卸売業、小売業別にみると、卸売業は39兆7620億円、同1.4%の増加となった。小売業
は12兆9250億円、同3.3%の増加となった。
なお、商業販売額の季節調整済前月比は▲0.1%の低下となった。卸売業は同▲0.7%
の低下、小売業は同0.5%の上昇となった。
(単位: 10億円、%)(Billion yen)
商業計
卸売業
小売業
Commercial Sales
Wholesale
Retail
販売額
前 年
同月比
季調済
前月比
販売額
前 年
同月比
季調済
前月比
販売額
前 年
同月比
季調済
前月比
Sales value
(%)*1
(%)*2
Sales value
(%)*1
(%)*2
Sales value
(%)*1
(%)*2
▲0.1
39,762
▲0.7
12,925
52,687
2.0
1.4
3.3
0.5
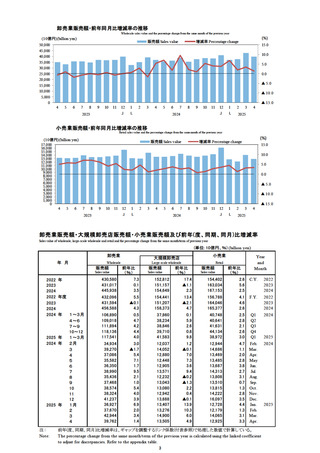
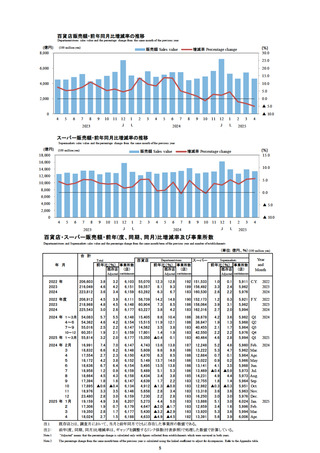
商業販売額・前年(度、同期、同月)比増減率及び季節調整済前期(月)比増減率
Commercial sales value and the percentage change from the same month/term of the previous y ear and seasonal adjustment indices percentage change from the previous term.
(単位: 10億円、%) (billion yen)
商業計
Commercial Sales
年月
小売業
Wholesale
Retail
販売額
前年比
季調済
前月比
販売額
前年比
季調済
前月比
販売額
前年比
季調済
前月比
Sales value
(%)*1
(%)*2
Sales value
(%)*1
(%)*2
Sales value
(%)*1
(%)*2
Year
and
Month
2022 年
2023
2024
584,982
594,050
613,090
6.0
1.6
3.2
-
430,580
431,017
445,938
7.3
0.1
3.5
-
154,402
163,034
167,153
2.6
5.6
2.5
- C.Y.
-
2022
2023
2024
2022 年度
2023
2024
588,884
595,640
621,966
5.2
1.1
3.8
-
432,096
431,594
456,588
5.5
▲0.1
4.3
-
156,788
164,046
165,377
4.1
4.6
2.6
- F.Y.
-
2022
2023
2024
2024 年 1~3月
4~6
7~9
10~12
2025 年 1~3月
147,638
149,658
153,525
162,269
156,513
1.1
4.2
3.6
3.9
3.7
▲ 0.2
3.1
0.4
▲ 0.1
1.6
106,890
109,018
111,894
118,136
117,541
0.5
4.7
4.2
4.4
4.0
▲ 0.1
3.3
0.3
▲ 0.1
2.0
40,748
40,641
41,631
44,134
38,972
2.5
2.8
2.1
2.6
3.0
0.1 Q1
1.5 Q2
0.8 Q3
0.2 Q4
1.5 Q1
2024
2024 年 2月
3
4
5
6
7
8
9
10
11
12
2025 年 1月
2
3
4
47,878
53,956
50,555
49,067
50,037
53,303
49,244
50,978
52,389
52,546
57,334
49,656
49,848
57,009
52,687
3.5
▲1.0
4.5
5.9
2.3
7.6
2.4
0.9
4.3
3.7
3.8
6.1
1.9
3.4
2.0
1.3
0.7
1.2
1.7
▲ 0.7
1.5
▲ 1.2
▲ 0.9
0.7
0.4
▲ 0.2
1.6
0.9
▲ 1.7
▲ 0.1
34,934
39,270
37,086
35,582
36,350
38,990
35,436
37,468
38,574
38,324
41,237
36,927
37,670
42,944
39,762
3.0
▲1.7
5.4
7.1
1.7
9.5
2.1
1.0
5.4
4.0
3.9
6.9
2.0
3.4
1.4
1.5
0.9
1.3
2.0
▲ 1.2
1.5
▲ 1.3
▲ 0.7
0.8
0.3
▲ 0.3
2.2
0.7
▲ 1.8
▲ 0.7
12,944
14,686
13,469
13,485
13,687
14,313
13,808
13,510
13,815
14,222
16,097
12,728
12,179
14,065
12,925
4.7
1.1
2.0
2.8
3.8
2.7
3.1
0.7
1.3
2.8
3.5
4.4
1.3
3.1
3.3
0.5 Feb.
0.2 M ar.
0.4 Apr.
0.9 M ay
0.7 Jun.
0.1 Jul.
0.5 Aug.
▲ 1.3 Sep.
0.0 Oct.
1.4 Nov.
▲ 0.2 Dec.
1.2 Jan.
0.4 Feb.
▲ 1.2 M ar.
0.5 Apr.
2024
注:
Note:
*1
*2
卸売業
前年(度、同期、同月)比増減率は、ギャップを調整するリンク係数(付表参照)で処理した数値で計算している。
T he percentage change from the same month/term of the previous year is calculated using the linked coefficient
to adjust for discrepancies. Refer to the Appendix table.
Sales Value percentage change from the same month/term of the previous year
Seasonal adjustement indices percentage change from the previous month (C.Y.2020=100)
1
2025
2025
2025年4月の商業販売額は52兆6870億円、前年同月比2.0%の増加となった。これ
を卸売業、小売業別にみると、卸売業は39兆7620億円、同1.4%の増加となった。小売業
は12兆9250億円、同3.3%の増加となった。
なお、商業販売額の季節調整済前月比は▲0.1%の低下となった。卸売業は同▲0.7%
の低下、小売業は同0.5%の上昇となった。
(単位: 10億円、%)(Billion yen)
商業計
卸売業
小売業
Commercial Sales
Wholesale
Retail
販売額
前 年
同月比
季調済
前月比
販売額
前 年
同月比
季調済
前月比
販売額
前 年
同月比
季調済
前月比
Sales value
(%)*1
(%)*2
Sales value
(%)*1
(%)*2
Sales value
(%)*1
(%)*2
▲0.1
39,762
▲0.7
12,925
52,687
2.0
1.4
3.3
0.5
商業販売額・前年(度、同期、同月)比増減率及び季節調整済前期(月)比増減率
Commercial sales value and the percentage change from the same month/term of the previous y ear and seasonal adjustment indices percentage change from the previous term.
(単位: 10億円、%) (billion yen)
商業計
Commercial Sales
年月
小売業
Wholesale
Retail
販売額
前年比
季調済
前月比
販売額
前年比
季調済
前月比
販売額
前年比
季調済
前月比
Sales value
(%)*1
(%)*2
Sales value
(%)*1
(%)*2
Sales value
(%)*1
(%)*2
Year
and
Month
2022 年
2023
2024
584,982
594,050
613,090
6.0
1.6
3.2
-
430,580
431,017
445,938
7.3
0.1
3.5
-
154,402
163,034
167,153
2.6
5.6
2.5
- C.Y.
-
2022
2023
2024
2022 年度
2023
2024
588,884
595,640
621,966
5.2
1.1
3.8
-
432,096
431,594
456,588
5.5
▲0.1
4.3
-
156,788
164,046
165,377
4.1
4.6
2.6
- F.Y.
-
2022
2023
2024
2024 年 1~3月
4~6
7~9
10~12
2025 年 1~3月
147,638
149,658
153,525
162,269
156,513
1.1
4.2
3.6
3.9
3.7
▲ 0.2
3.1
0.4
▲ 0.1
1.6
106,890
109,018
111,894
118,136
117,541
0.5
4.7
4.2
4.4
4.0
▲ 0.1
3.3
0.3
▲ 0.1
2.0
40,748
40,641
41,631
44,134
38,972
2.5
2.8
2.1
2.6
3.0
0.1 Q1
1.5 Q2
0.8 Q3
0.2 Q4
1.5 Q1
2024
2024 年 2月
3
4
5
6
7
8
9
10
11
12
2025 年 1月
2
3
4
47,878
53,956
50,555
49,067
50,037
53,303
49,244
50,978
52,389
52,546
57,334
49,656
49,848
57,009
52,687
3.5
▲1.0
4.5
5.9
2.3
7.6
2.4
0.9
4.3
3.7
3.8
6.1
1.9
3.4
2.0
1.3
0.7
1.2
1.7
▲ 0.7
1.5
▲ 1.2
▲ 0.9
0.7
0.4
▲ 0.2
1.6
0.9
▲ 1.7
▲ 0.1
34,934
39,270
37,086
35,582
36,350
38,990
35,436
37,468
38,574
38,324
41,237
36,927
37,670
42,944
39,762
3.0
▲1.7
5.4
7.1
1.7
9.5
2.1
1.0
5.4
4.0
3.9
6.9
2.0
3.4
1.4
1.5
0.9
1.3
2.0
▲ 1.2
1.5
▲ 1.3
▲ 0.7
0.8
0.3
▲ 0.3
2.2
0.7
▲ 1.8
▲ 0.7
12,944
14,686
13,469
13,485
13,687
14,313
13,808
13,510
13,815
14,222
16,097
12,728
12,179
14,065
12,925
4.7
1.1
2.0
2.8
3.8
2.7
3.1
0.7
1.3
2.8
3.5
4.4
1.3
3.1
3.3
0.5 Feb.
0.2 M ar.
0.4 Apr.
0.9 M ay
0.7 Jun.
0.1 Jul.
0.5 Aug.
▲ 1.3 Sep.
0.0 Oct.
1.4 Nov.
▲ 0.2 Dec.
1.2 Jan.
0.4 Feb.
▲ 1.2 M ar.
0.5 Apr.
2024
注:
Note:
*1
*2
卸売業
前年(度、同期、同月)比増減率は、ギャップを調整するリンク係数(付表参照)で処理した数値で計算している。
T he percentage change from the same month/term of the previous year is calculated using the linked coefficient
to adjust for discrepancies. Refer to the Appendix table.
Sales Value percentage change from the same month/term of the previous year
Seasonal adjustement indices percentage change from the previous month (C.Y.2020=100)
1
2025
2025