

よむ、つかう、まなぶ。

商業動態統計速報 2022年12月分 (58 ページ)
出典
| 公開元URL | https://www.meti.go.jp/statistics/tyo/syoudou/result/sokuho_2.html |
| 出典情報 | 商業動態統計速報 2022年12月分(1/31)《経済産業省》 |
ページ画像
ダウンロードした画像を利用する際は「出典情報」を明記してください。
低解像度画像をダウンロード
プレーンテキスト
資料テキストはコンピュータによる自動処理で生成されており、完全に資料と一致しない場合があります。
テキストをコピーしてご利用いただく際は資料と付け合わせてご確認ください。
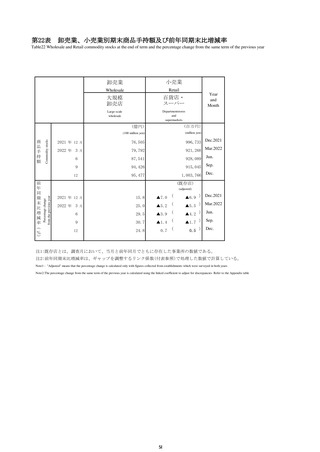
第22表
卸売業、小売業別期末商品手持額及び前年同期末比増減率
前
年
同
期
末
比
増
減
率
(
%
)
卸売業
小売業
Wholesale
Retail
大規模
卸売店
百貨店・
スーパー
Large-scale
wholesale
Departmentstores
and
supermarkets
Year
and
Month
(億円)
(百万円)
(100 million yen)
(million yen)
2021 年 12
月
76,505
2022 年 3
月
79,792
996,733 Dec.2021
921,268 Mar.2022
6
87,541
928,089
Jun.
9
94,426
915,045
Sep.
12
95,477
1,003,766
Dec.
(既存店)
(adjusted)
Percentage change
from the previous year
商
品
手
持
額
Commodity stocks
Table22 Wholesale and Retail commodity stocks at the end of term and the percentage change from the same term of the previous year
2021 年 12
月
15.8
▲7.0 (
2022 年 3
月
25.0
▲5.2 (
▲6.9 ) Dec.2021
▲5.5 ) Mar.2022
6
29.5
▲3.9 (
▲4.2 )
Jun.
9
30.7
▲1.4 (
▲1.7 )
Sep.
12
24.8
0.7 (
0.5 )
Dec.
注1:既存店とは、調査月において、当月と前年同月でともに存在した事業所の数値である。
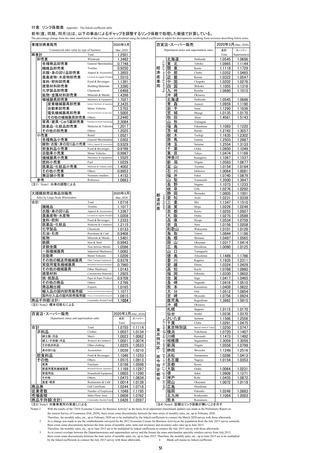
注2:前年同期末比増減率は、ギャップを調整するリンク係数(付表参照)で処理した数値で計算している。
Note1 : "Adjusted" means that the percentage change is calculated only with figures collected from establishments which were surveyed in both years
Note2:The percentage change from the same term of the previous year is calculated using the linked coefficient to adjust for discrepancies Refer to the Appendix table
58
卸売業、小売業別期末商品手持額及び前年同期末比増減率
前
年
同
期
末
比
増
減
率
(
%
)
卸売業
小売業
Wholesale
Retail
大規模
卸売店
百貨店・
スーパー
Large-scale
wholesale
Departmentstores
and
supermarkets
Year
and
Month
(億円)
(百万円)
(100 million yen)
(million yen)
2021 年 12
月
76,505
2022 年 3
月
79,792
996,733 Dec.2021
921,268 Mar.2022
6
87,541
928,089
Jun.
9
94,426
915,045
Sep.
12
95,477
1,003,766
Dec.
(既存店)
(adjusted)
Percentage change
from the previous year
商
品
手
持
額
Commodity stocks
Table22 Wholesale and Retail commodity stocks at the end of term and the percentage change from the same term of the previous year
2021 年 12
月
15.8
▲7.0 (
2022 年 3
月
25.0
▲5.2 (
▲6.9 ) Dec.2021
▲5.5 ) Mar.2022
6
29.5
▲3.9 (
▲4.2 )
Jun.
9
30.7
▲1.4 (
▲1.7 )
Sep.
12
24.8
0.7 (
0.5 )
Dec.
注1:既存店とは、調査月において、当月と前年同月でともに存在した事業所の数値である。
注2:前年同期末比増減率は、ギャップを調整するリンク係数(付表参照)で処理した数値で計算している。
Note1 : "Adjusted" means that the percentage change is calculated only with figures collected from establishments which were surveyed in both years
Note2:The percentage change from the same term of the previous year is calculated using the linked coefficient to adjust for discrepancies Refer to the Appendix table
58