
よむ、つかう、まなぶ。
商業動態統計速報 (54 ページ)
出典
| 公開元URL | https://www.meti.go.jp/statistics/tyo/syoudou/result/sokuho_2.html |
| 出典情報 | 商業動態統計速報 2022年3月分(4/28)《経済産業省》 |
ページ画像
ダウンロードした画像を利用する際は「出典情報」を明記してください。
低解像度画像をダウンロード
プレーンテキスト
資料テキストはコンピュータによる自動処理で生成されており、完全に資料と一致しない場合があります。
テキストをコピーしてご利用いただく際は資料と付け合わせてご確認ください。
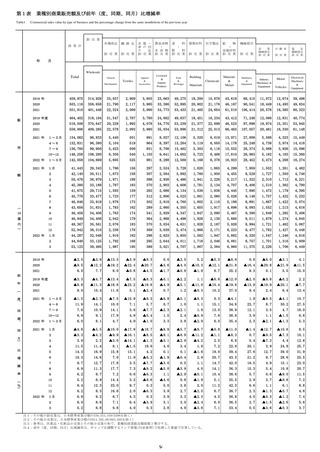
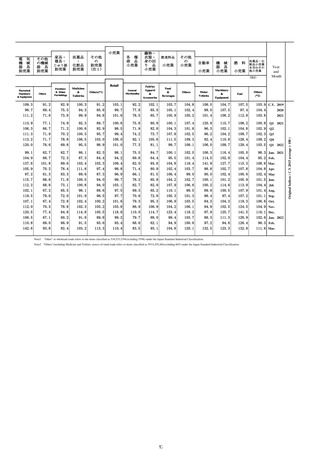
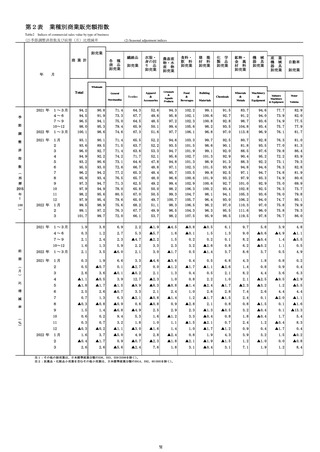
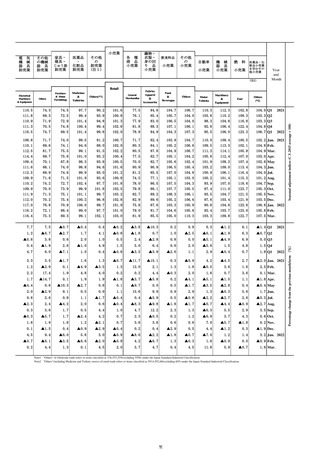
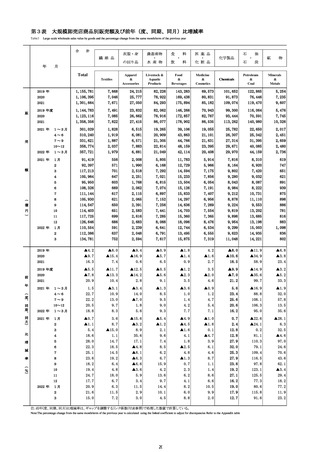
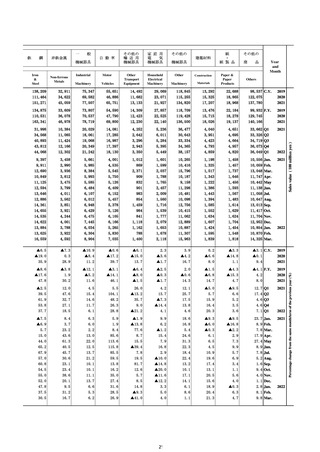
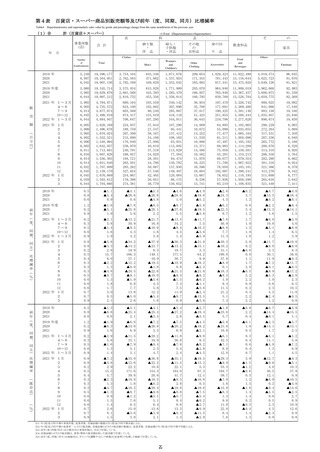
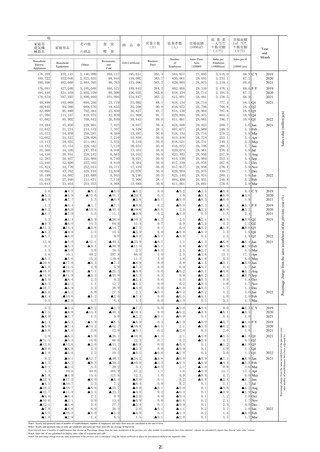
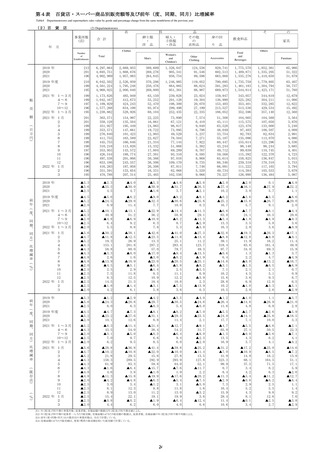
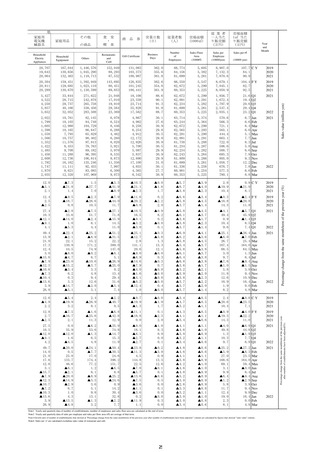
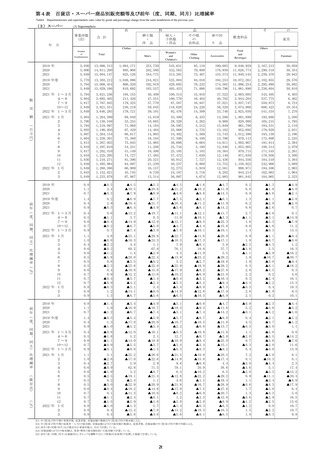
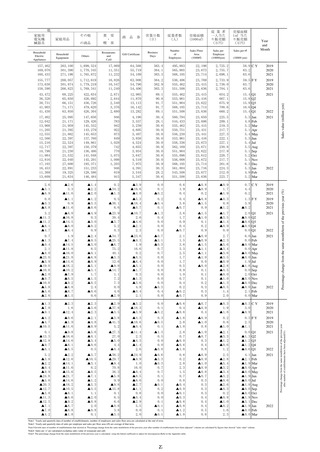
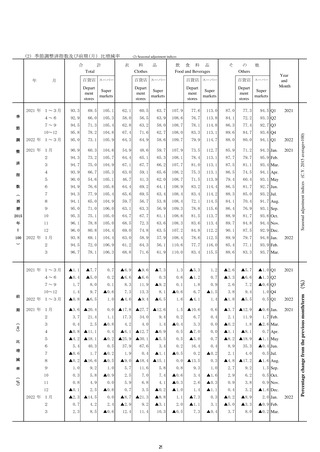
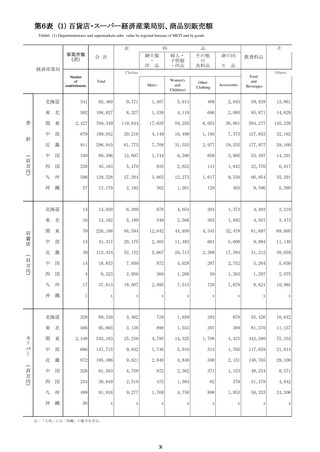
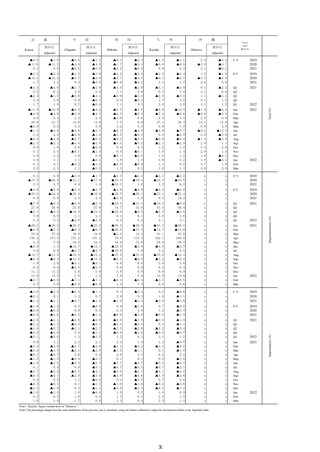
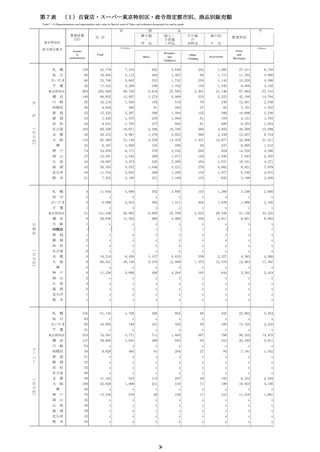
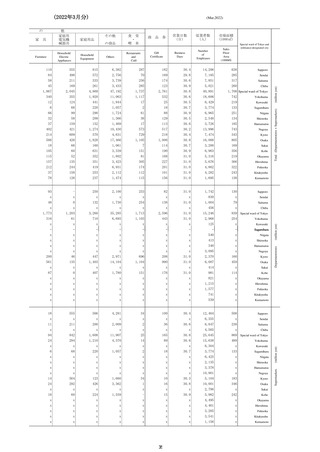
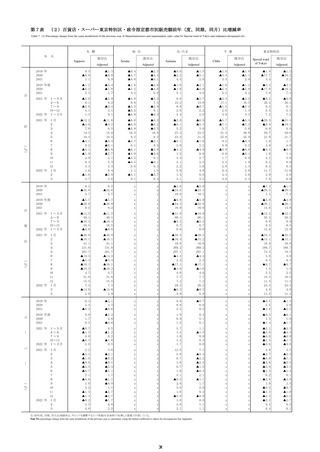
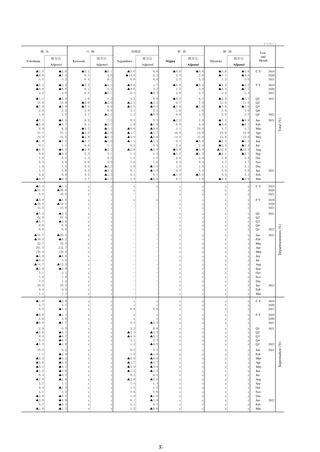
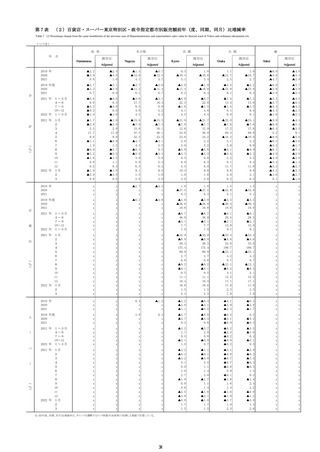
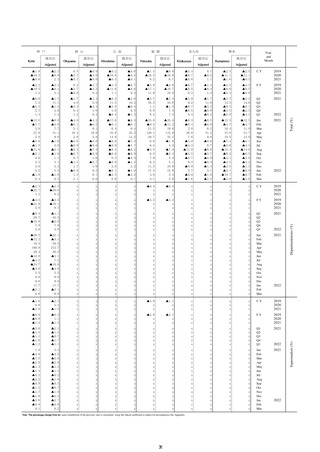
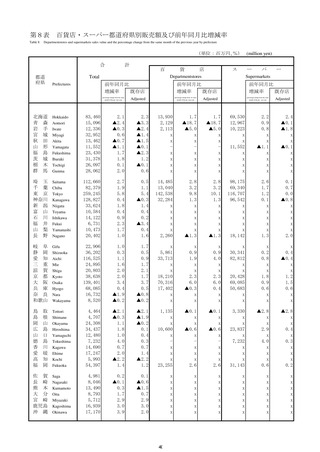
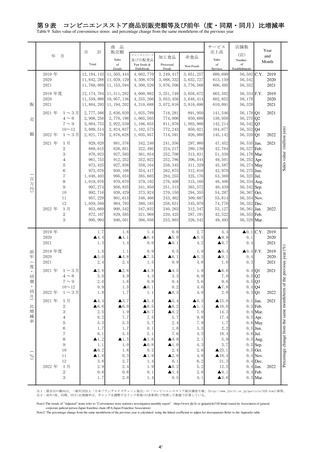
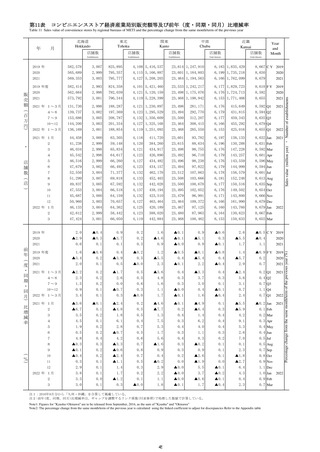
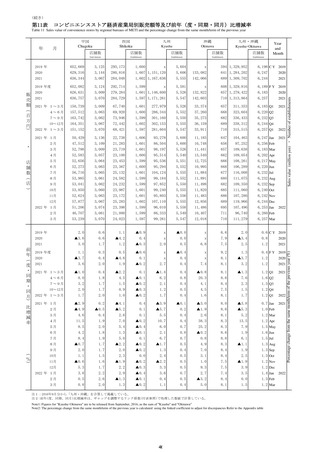
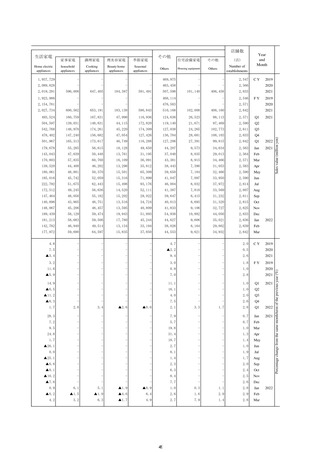
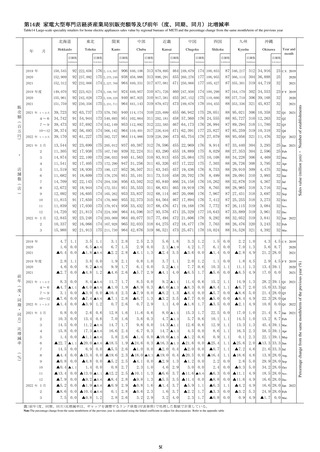
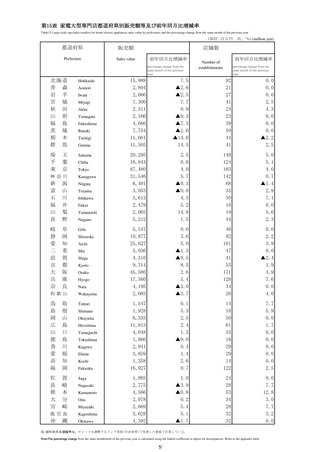
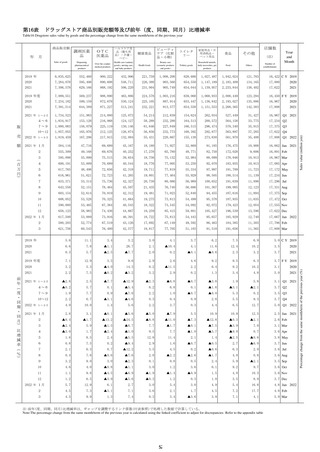
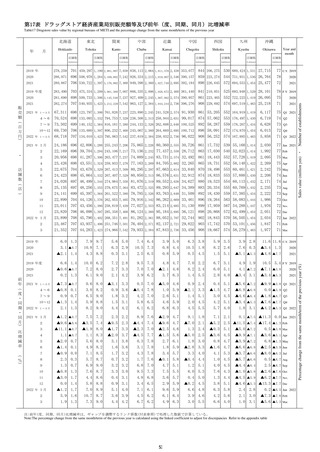
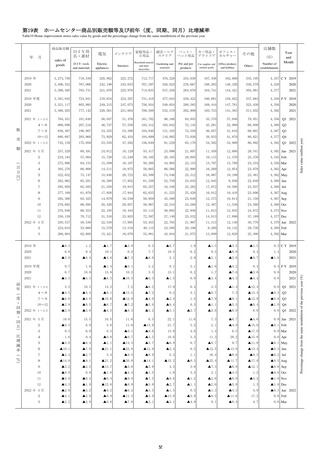
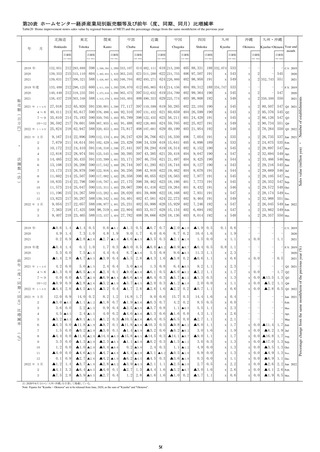
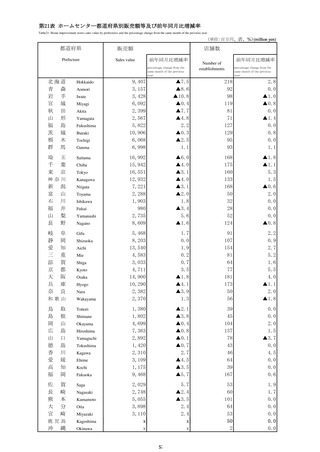
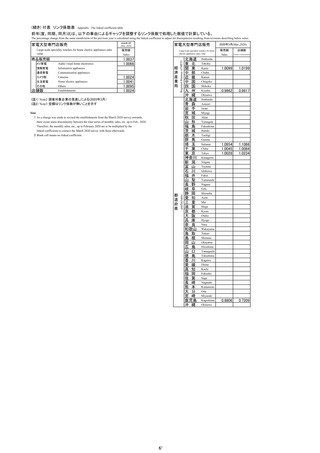
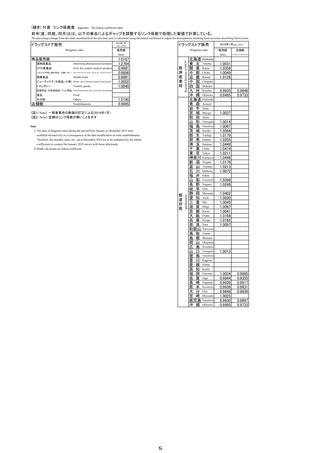
第18表 ドラッグストア都道府県別販売額等及び前年同月比増減率
Table18 Drugstore sales value by prefectures and the percentage change from the same month of the previous year.
(単位:百万円、店、%)(million yen)
都道府県
販売額
Prefecture
Sales value
店舗数
前年同月比増減率
percentage change from the
same month of the previous
year
北海道
青 森
岩 手
宮 城
秋 田
山 形
福 島
茨 城
栃 木
群 馬
Hokkaido
埼
千
東
Saitama
玉
葉
京
Aomori
Iwate
Miyagi
Akita
Yamagata
Fukushima
Ibaraki
Tochigi
Gunma
Chiba
Tokyo
神奈川
Kanagawa
新
富
石
福
山
長
潟
山
川
井
梨
野
Niigata
岐
静
愛
三
滋
京
大
兵
奈
阜
岡
知
重
賀
都
阪
庫
良
Gifu
Toyama
Ishikawa
Fukui
Yamanashi
Nagano
Shizuoka
Aichi
Mie
Shiga
Kyoto
Osaka
Hyogo
Nara
和歌山
Wakayama
鳥
島
岡
広
山
徳
香
愛
高
福
取
根
山
島
口
島
川
媛
知
岡
Tottori
佐
長
熊
大
宮
賀
崎
本
分
崎
Saga
Shimane
Okayama
Hiroshima
Yamaguchi
Tokushima
Kagawa
Ehime
Kochi
Fukuoka
Nagasaki
Kumamoto
Oita
Miyazaki
鹿児島
Kagoshima
沖
Okinawa
縄
Number of
establishments
前年同月比増減率
percentage change from the
same month of the previous
year
21,352
5,648
7,872
12,279
4,157
5,488
8,839
17,689
12,443
11,360
1.9
7.7
17.0
5.0
7.9
6.1
2.9
4.8
4.4
4.6
707
200
243
368
156
194
262
448
324
341
1.3
8.1
10.5
7.0
8.3
9.6
11.0
6.2
9.8
6.6
39,147
32,784
61,951
48,663
10,606
7,725
9,463
6,459
4,562
8,219
3.4
6.0
0.5
6.6
5.2
11.2
9.9
12.3
5.3
5.3
1,127
889
1,907
1,185
372
214
254
177
135
254
2.5
3.7
2.3
4.5
7.5
11.5
10.4
15.7
5.5
4.5
14,684
27,542
40,173
7,888
7,330
10,834
33,692
22,072
4,555
2,901
4.5
8.0
6.0
7.0
7.5
8.2
3.3
2.9
3.7
8.4
451
560
1,198
267
235
351
1,059
669
142
103
1.8
6.1
6.1
6.4
8.8
6.0
4.7
5.9
4.4
8.4
2,553
3,511
8,336
11,861
7,195
3,303
4,652
8,650
3,062
23,702
7.3
4.2
2.6
1.3
4.2
5.8
7.6
6.5
6.5
0.1
81
84
211
327
205
88
134
253
99
615
12.5
5.0
8.8
3.5
3.0
6.0
3.9
3.3
4.2
3.4
3,798
5,321
7,649
5,353
5,353
7,103
1,977
▲0.7
3.2
▲0.6
1.2
0.7
4.9
▲5.6
86
132
174
123
127
206
71
0.0
4.8
0.6
3.4
1.6
5.6
▲5.3
注:前年同月比増減率は、ギャップを調整するリンク係数(付表参照)で処理した数値で計算している。
Note:The percentage change from the same month/term of the previous year is calculated using the linked coefficient to adjust for discrepancies Refer to the appendix table
54